| Param | Original file | Final file |
|---|---|---|
| Filename | modeM0/AS1C07_001T11_9000005710_41853cztM0_level2.fits | modeM0/AS1C07_001T11_9000005710_41853cztM0_level2_quad_clean.evt |
| Size (bytes) | 428,803,200 | 86,664,960 |
| Size | 408.9 MB | 82.7 MB |
| Events in quadrant A | 4,644,193 | 577,867 |
| Events in quadrant B | 2,387,828 | 620,386 |
| Events in quadrant C | 3,594,068 | 556,837 |
| Events in quadrant D | 4,841,243 | 503,099 |
| Mode SS | |||
|---|---|---|---|
| Quadrant | BADHDUFLAG | Total packets | Discarded packets |
| A | 0 | 108 | 0 |
| B | 0 | 108 | 0 |
| C | 0 | 108 | 0 |
| D | 0 | 108 | 0 |
| Mode M0 | |||
|---|---|---|---|
| Quadrant | BADHDUFLAG | Total packets | Discarded packets |
| A | 0 | 17287 | 2 |
| B | 0 | 10730 | 2 |
| C | 0 | 13982 | 2 |
| D | 0 | 18031 | 2 |
| Mode M9 | |||
|---|---|---|---|
| Quadrant | BADHDUFLAG | Total packets | Discarded packets |
| A | 0 | 20 | 0 |
| B | 0 | 20 | 0 |
| C | 0 | 21 | 0 |
| D | 0 | 21 | 0 |
| Quadrant | Total seconds | Saturated seconds | Saturation percentage |
|---|---|---|---|
| A | 5218 | 413 | 7.914910% |
| B | 5218 | 7 | 0.134151% |
| C | 5218 | 314 | 6.017631% |
| D | 5218 | 588 | 11.268685% |
Noise dominated data is calculated using 1-second bins in cleaned event files. If a bin has >2000 counts, and if more than 50% of those come from <1% of pixels, then it is considered to be noise-dominated and hence unusable.
| Quadrant | # 1 sec bins | Bins with >0 counts | Bins with >2000 counts | High rate bins dominated by noise | Noise dominated (total time) | Noise dominated (detector-on time) | Marked lightcurve |
|---|---|---|---|---|---|---|---|
| A | 7311 | 5219 | 287 | 287 | 3.93% | 5.50% | 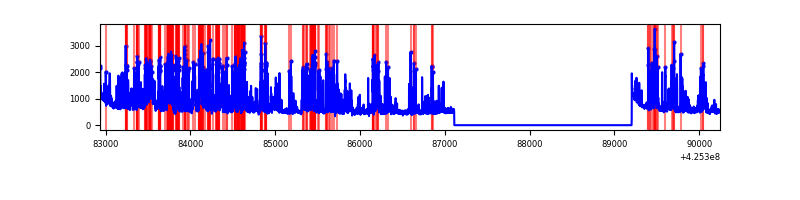 |
| B | 7311 | 5219 | 4 | 4 | 0.05% | 0.08% | 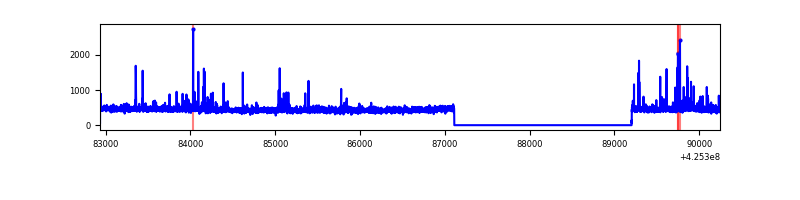 |
| C | 7311 | 5219 | 309 | 309 | 4.23% | 5.92% | 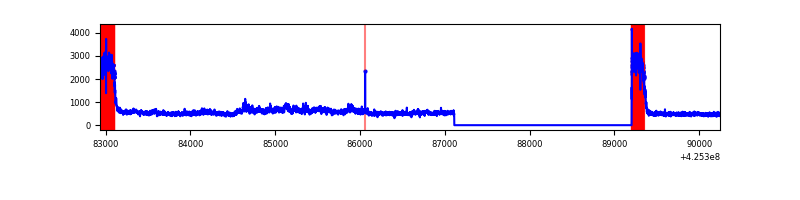 |
| D | 7311 | 5219 | 612 | 612 | 8.37% | 11.73% | 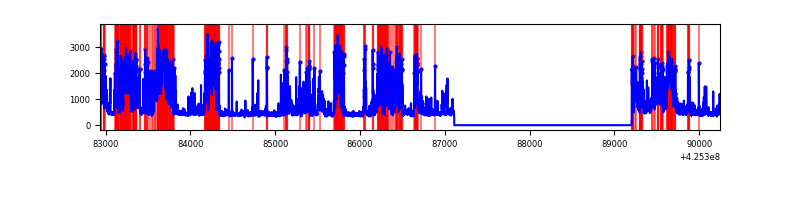 |
Top three noisy pixels from each quadrant. If the there are fewer than three noisy pixels in the level2.evt file, extra rows are filled as -1
| Pixel properties | Quadrant properties | ||||||
|---|---|---|---|---|---|---|---|
| Quadrant | DetID | PixID | Counts | Sigma | Mean | Median | Sigma |
| A | 14 | 24 | 1816144 | 15714.44 | 566 | 555 | 115.5 |
| A | 10 | 83 | 551914 | 4772.17 | 566 | 555 | 115.5 |
| A | 15 | 223 | 54291 | 465.1 | 566 | 555 | 115.5 |
| B | 5 | 255 | 78416 | 708.41 | 571 | 556 | 109.9 |
| B | 3 | 112 | 31657 | 282.97 | 571 | 556 | 109.9 |
| B | 12 | 111 | 13317 | 116.1 | 571 | 556 | 109.9 |
| C | 0 | 10 | 1282762 | 10249.9 | 537 | 539 | 125.1 |
| C | 15 | 214 | 203307 | 1620.9 | 537 | 539 | 125.1 |
| C | 14 | 254 | 6918 | 50.99 | 537 | 539 | 125.1 |
| D | 12 | 79 | 1060412 | 7978.98 | 543 | 530 | 132.8 |
| D | 13 | 249 | 546977 | 4113.75 | 543 | 530 | 132.8 |
| D | 2 | 249 | 438124 | 3294.28 | 543 | 530 | 132.8 |
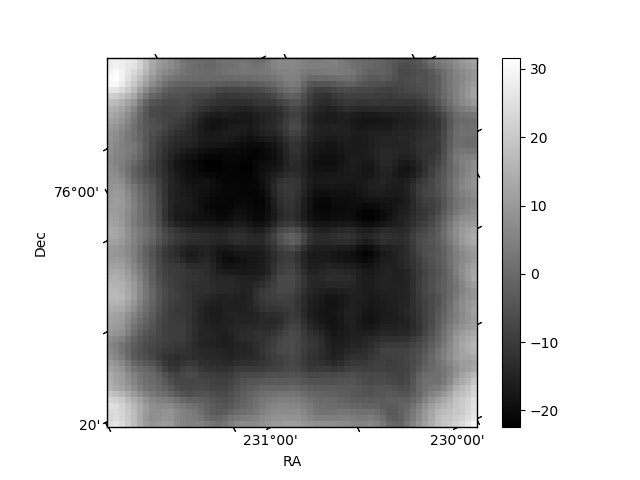
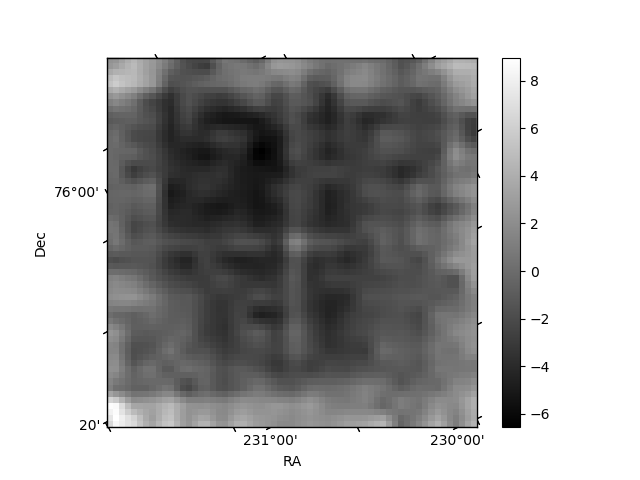
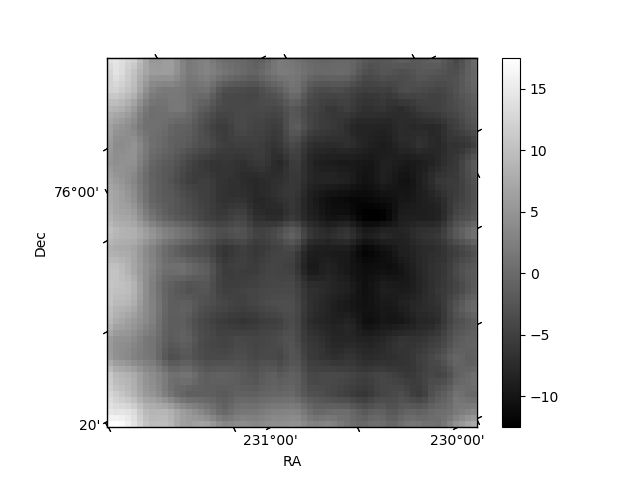
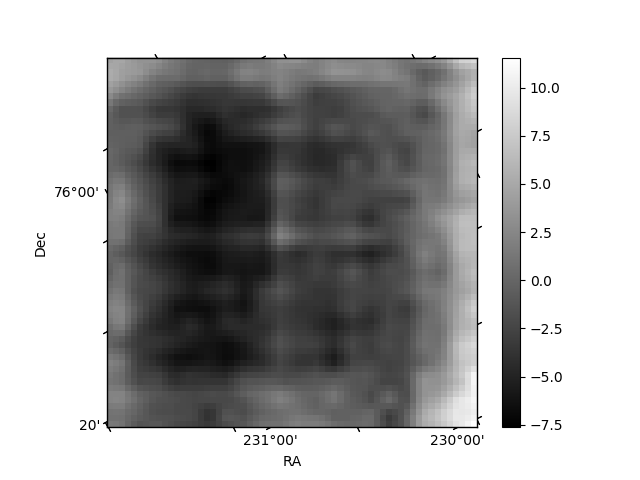
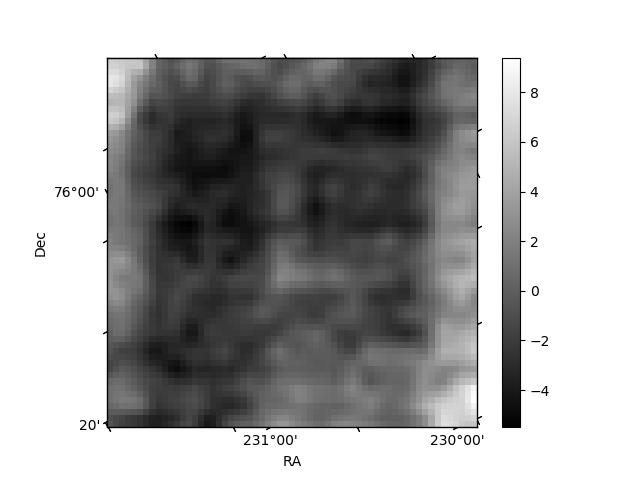
Histogram calculated using DETX and DETY for each event in the final _common_clean file
| Quadrant A | 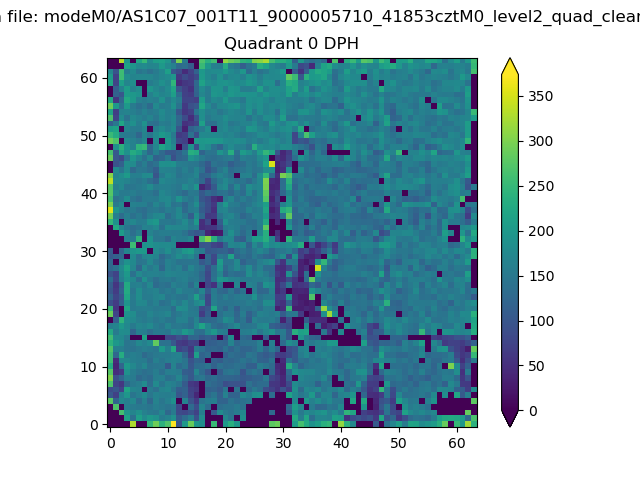 |
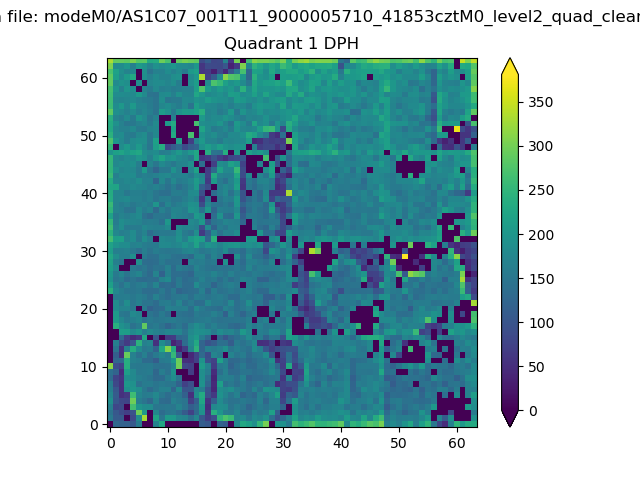 |
Quadrant B |
|---|---|---|---|
| Quadrant D | 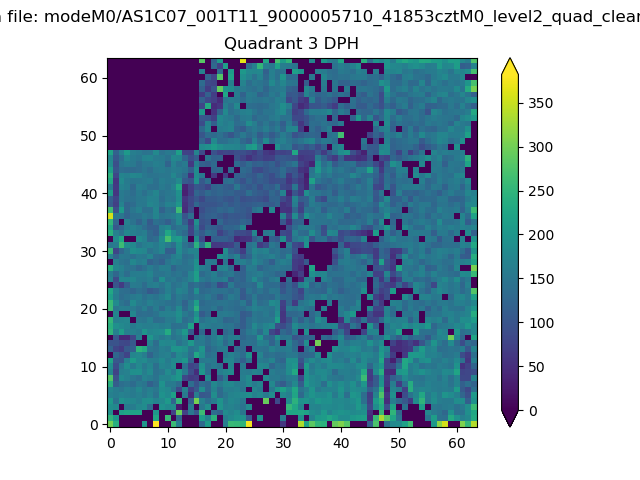 |
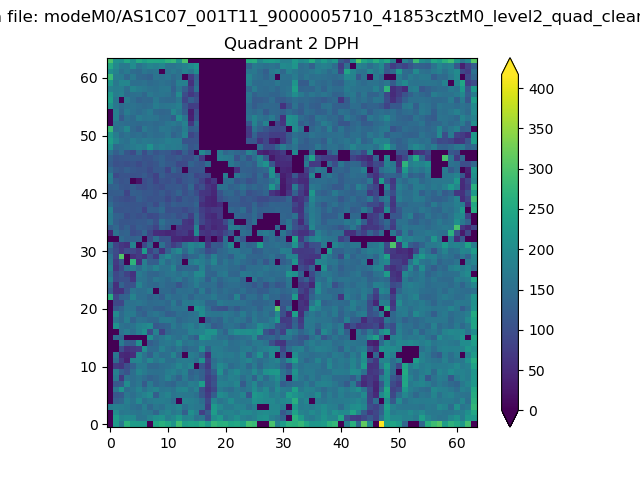 |
Quadrant C |
| Plot type | Count rate plots | Images |
|---|---|---|
| Comparison with Poisson distribution Blue bars denote a histogram of data divided into 1 sec bins. Red curve is a Poisson curve with rate = median count rate of data. |
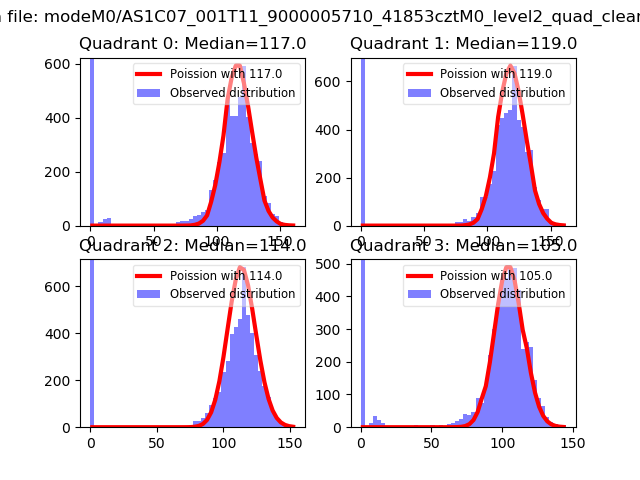 |
 |
| Quadrant-wise count rates Data is divided into 100 sec bins |
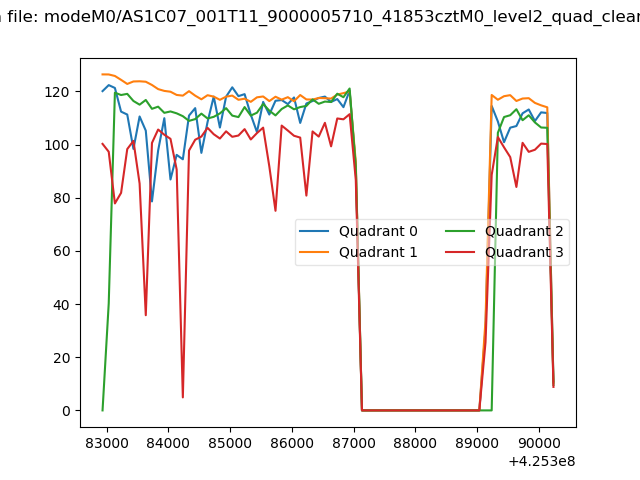 |
|
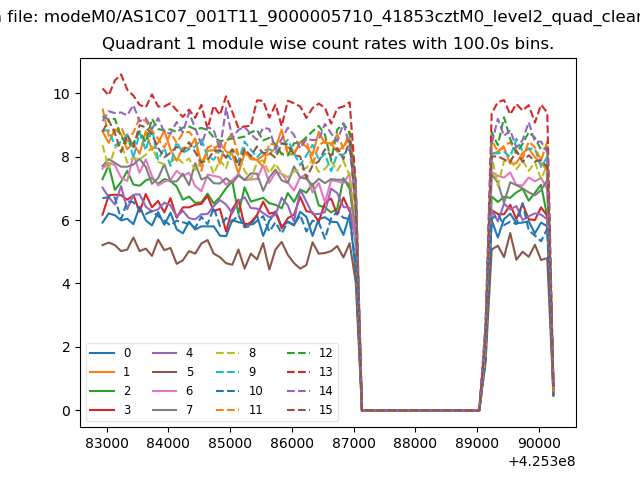
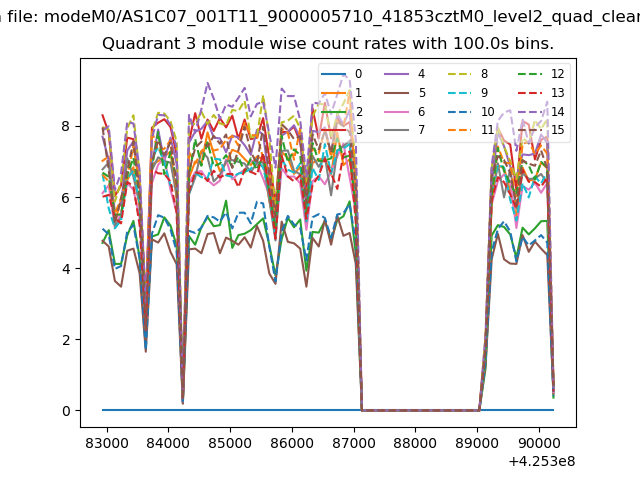
| Module-wise count rates for Quadrant A Data is divided into 100 sec bins |
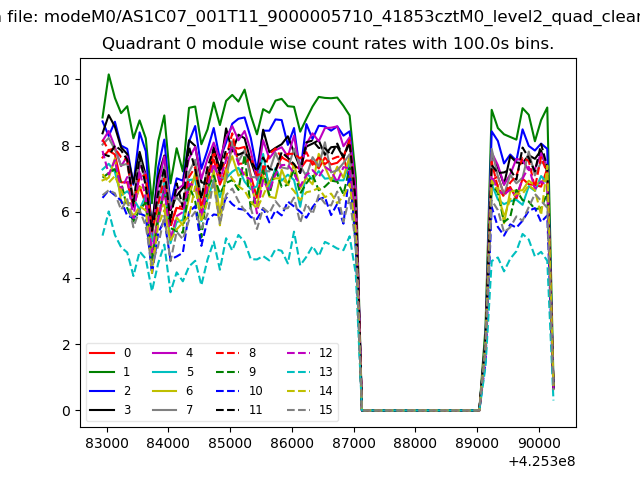 |
 |
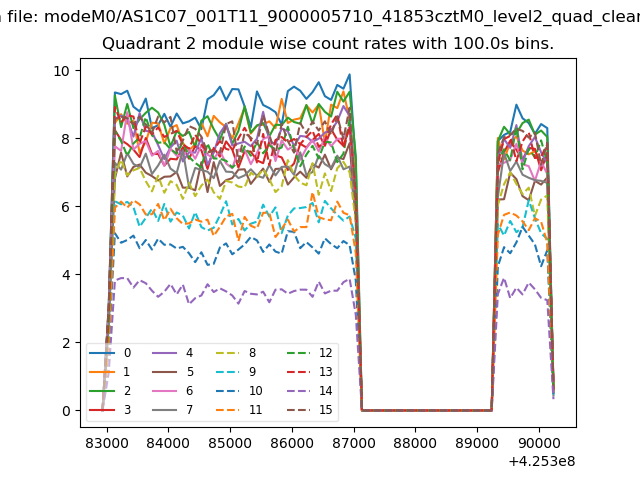
| Module-wise count rates for Quadrant B Data is divided into 100 sec bins |
 |
 |
| Module-wise count rates for Quadrant C Data is divided into 100 sec bins |
 |
 |
| Module-wise count rates for Quadrant D Data is divided into 100 sec bins |
 |
 |
| Parameter | Plot |
|---|---|
| CZT HV Monitor | 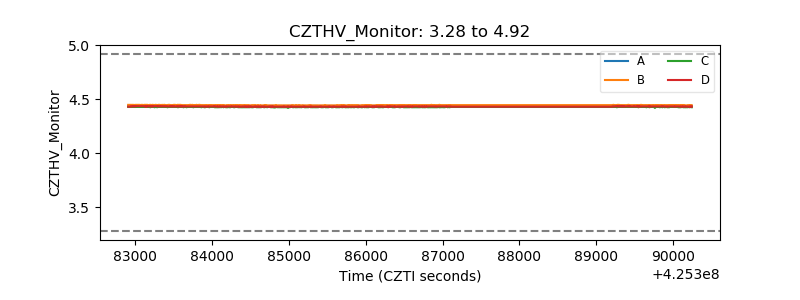 |
| D_VDD | 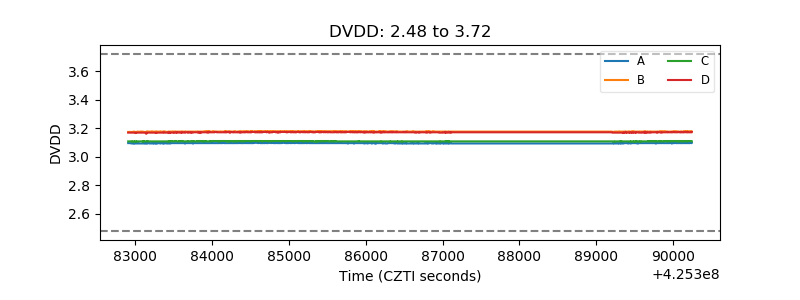 |
| Temperature 1 | 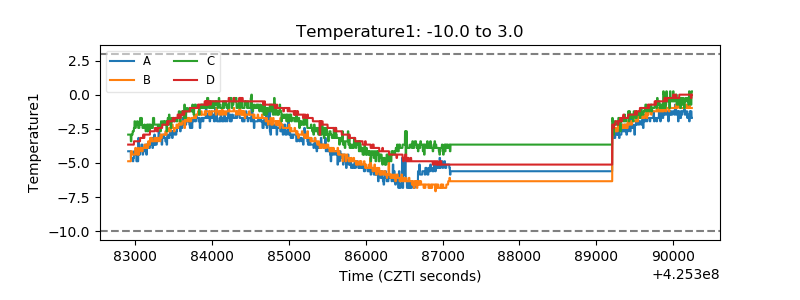 |
| Veto HV Monitor | 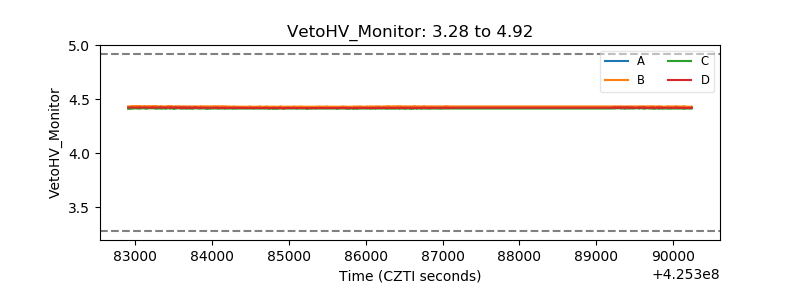 |
| Veto LLD |  |
| Alpha Counter | 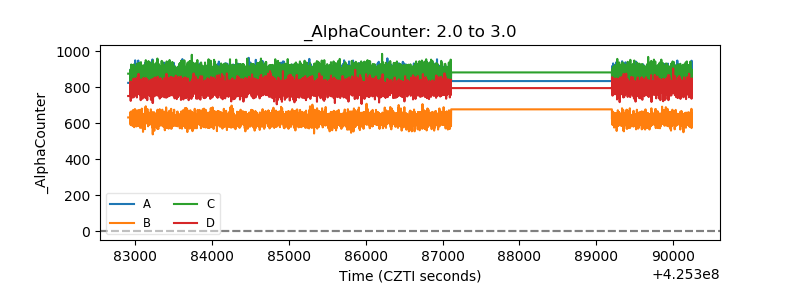 |
| _CPM_Rate | 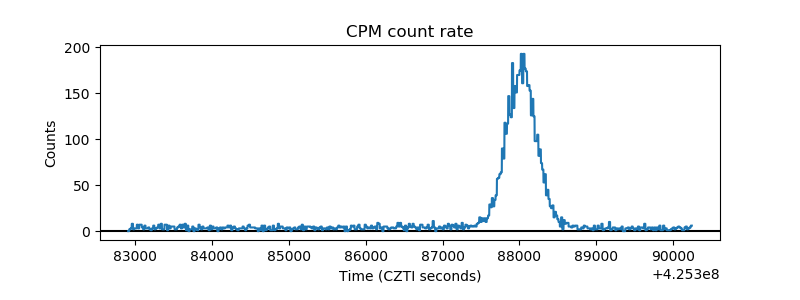 |
| CZT Counter | 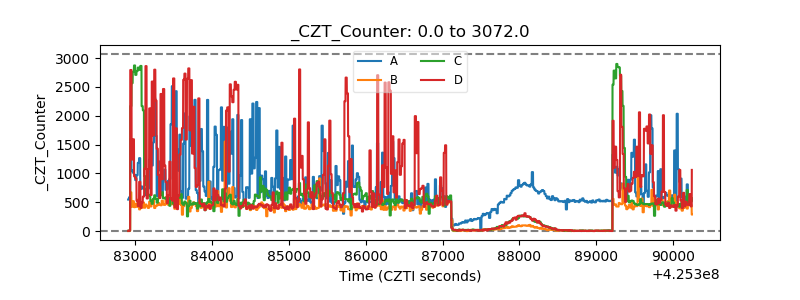 |
| +2.5 Volts monitor | 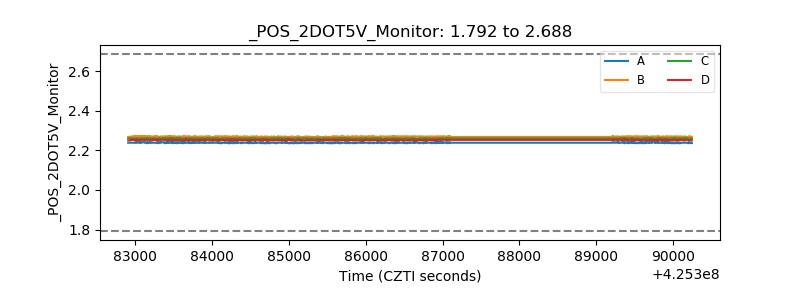 |
| +5 Volts monitor | 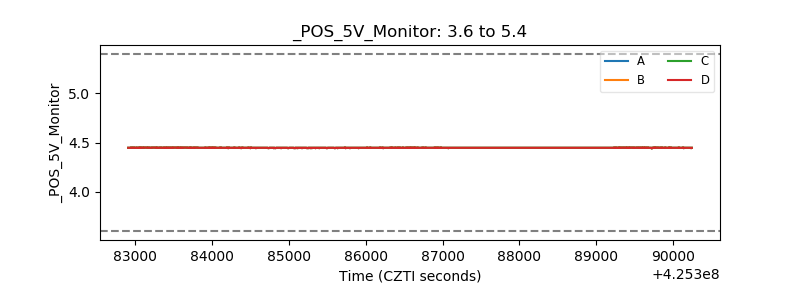 |
| _ROLL_ROT | 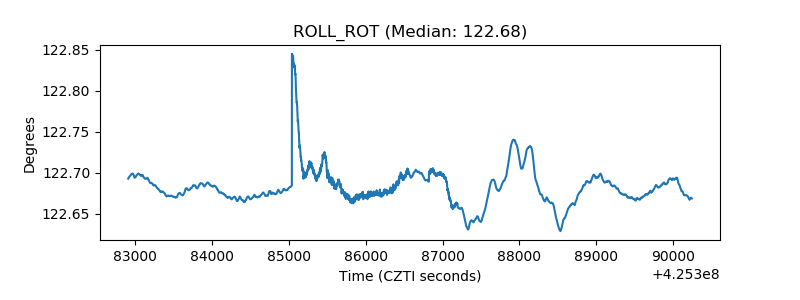 |
| _Roll_DEC | 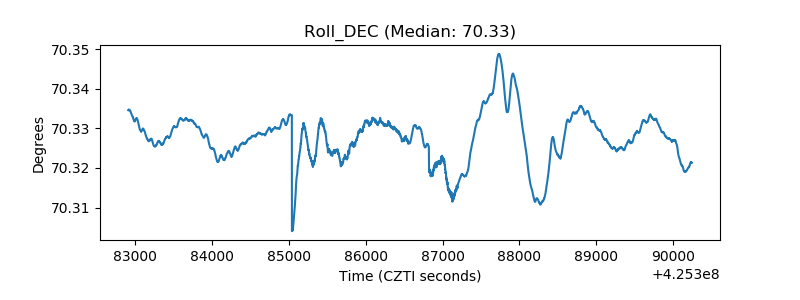 |
| _Roll_RA | 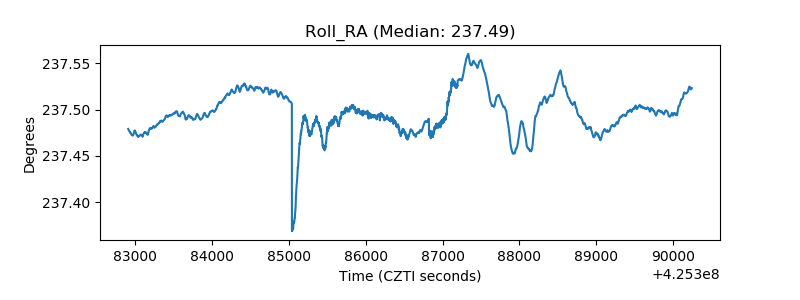 |
| Veto Counter | 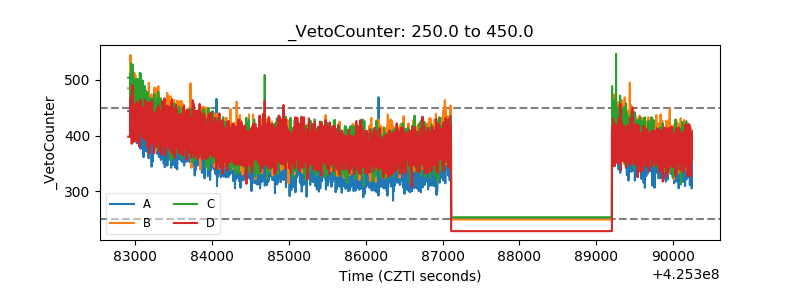 |