| Param | Original file | Final file |
|---|---|---|
| Filename | modeM0/AS1C07_001T11_9000005710_41854cztM0_level2.fits | modeM0/AS1C07_001T11_9000005710_41854cztM0_level2_quad_clean.evt |
| Size (bytes) | 361,440,000 | 87,016,320 |
| Size | 344.7 MB | 83.0 MB |
| Events in quadrant A | 3,673,247 | 584,161 |
| Events in quadrant B | 2,368,662 | 601,688 |
| Events in quadrant C | 3,413,560 | 548,724 |
| Events in quadrant D | 3,510,642 | 528,073 |
| Mode SS | |||
|---|---|---|---|
| Quadrant | BADHDUFLAG | Total packets | Discarded packets |
| A | 0 | 110 | 0 |
| B | 0 | 110 | 0 |
| C | 0 | 110 | 0 |
| D | 0 | 110 | 0 |
| Mode M0 | |||
|---|---|---|---|
| Quadrant | BADHDUFLAG | Total packets | Discarded packets |
| A | 0 | 14277 | 2 |
| B | 0 | 10903 | 2 |
| C | 0 | 13432 | 2 |
| D | 0 | 14200 | 2 |
| Mode M9 | |||
|---|---|---|---|
| Quadrant | BADHDUFLAG | Total packets | Discarded packets |
| A | 0 | 22 | 0 |
| B | 0 | 22 | 0 |
| C | 0 | 23 | 0 |
| D | 0 | 23 | 0 |
| Quadrant | Total seconds | Saturated seconds | Saturation percentage |
|---|---|---|---|
| A | 5306 | 185 | 3.486619% |
| B | 5306 | 7 | 0.131926% |
| C | 5306 | 286 | 5.390124% |
| D | 5305 | 163 | 3.072573% |
Noise dominated data is calculated using 1-second bins in cleaned event files. If a bin has >2000 counts, and if more than 50% of those come from <1% of pixels, then it is considered to be noise-dominated and hence unusable.
| Quadrant | # 1 sec bins | Bins with >0 counts | Bins with >2000 counts | High rate bins dominated by noise | Noise dominated (total time) | Noise dominated (detector-on time) | Marked lightcurve |
|---|---|---|---|---|---|---|---|
| A | 7219 | 5307 | 127 | 127 | 1.76% | 2.39% | 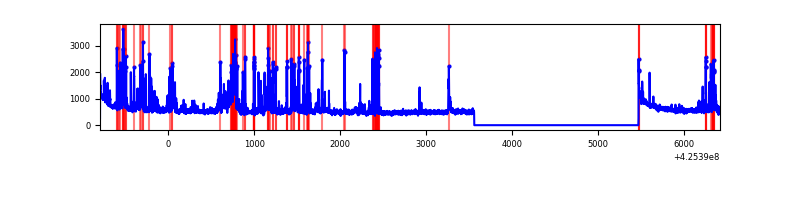 |
| B | 7219 | 5307 | 4 | 4 | 0.06% | 0.08% | 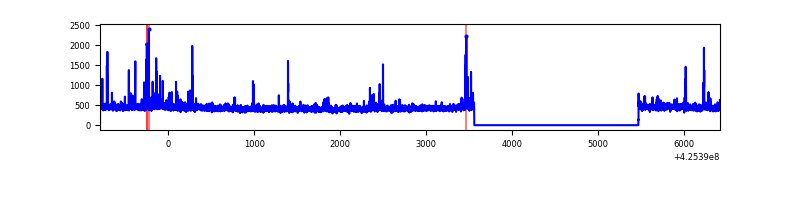 |
| C | 7219 | 5307 | 286 | 286 | 3.96% | 5.39% | 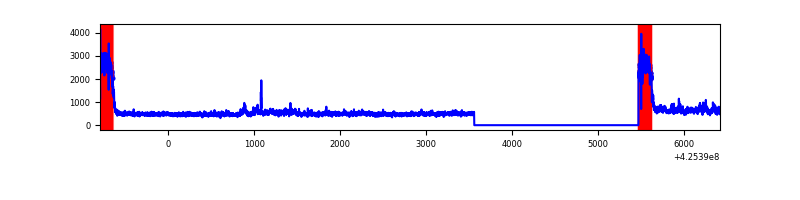 |
| D | 7218 | 5306 | 169 | 169 | 2.34% | 3.19% | 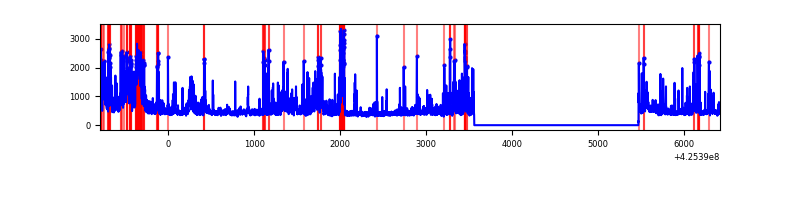 |
Top three noisy pixels from each quadrant. If the there are fewer than three noisy pixels in the level2.evt file, extra rows are filled as -1
| Pixel properties | Quadrant properties | ||||||
|---|---|---|---|---|---|---|---|
| Quadrant | DetID | PixID | Counts | Sigma | Mean | Median | Sigma |
| A | 14 | 24 | 832080 | 7233.08 | 566 | 554 | 115.0 |
| A | 10 | 83 | 576337 | 5008.49 | 566 | 554 | 115.0 |
| A | 15 | 223 | 54483 | 469.1 | 566 | 554 | 115.0 |
| B | 5 | 255 | 76298 | 698.14 | 566 | 552 | 108.5 |
| B | 3 | 112 | 25599 | 230.85 | 566 | 552 | 108.5 |
| B | 12 | 111 | 13026 | 114.97 | 566 | 552 | 108.5 |
| C | 0 | 10 | 1098528 | 8721.08 | 538 | 541 | 125.9 |
| C | 15 | 214 | 206760 | 1637.95 | 538 | 541 | 125.9 |
| C | 15 | 111 | 7869 | 58.2 | 538 | 541 | 125.9 |
| D | 2 | 120 | 443080 | 3286.64 | 556 | 542 | 134.6 |
| D | 13 | 249 | 326116 | 2417.97 | 556 | 542 | 134.6 |
| D | 2 | 249 | 210021 | 1555.76 | 556 | 542 | 134.6 |
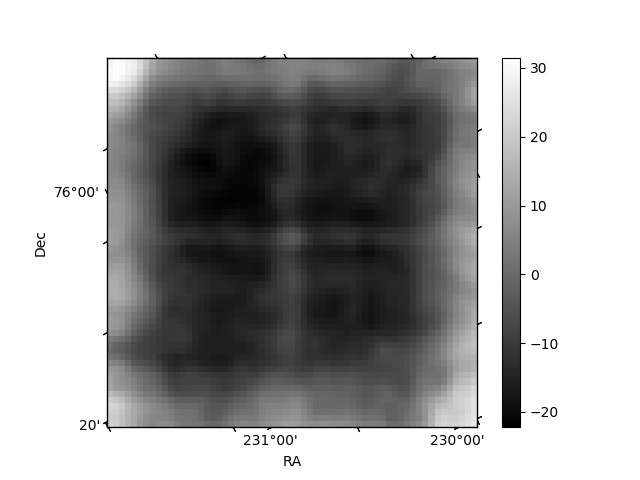
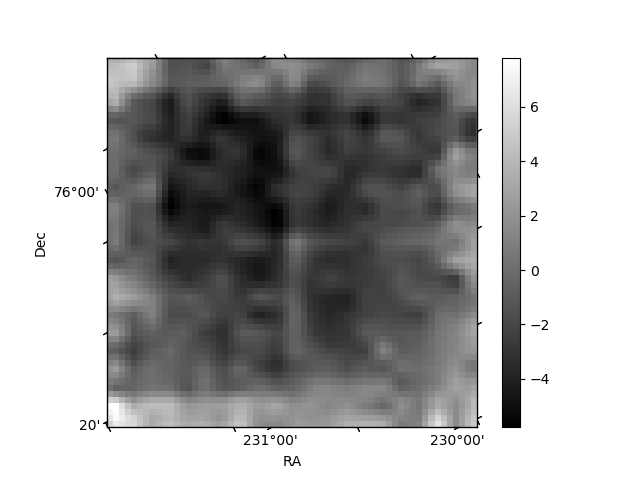
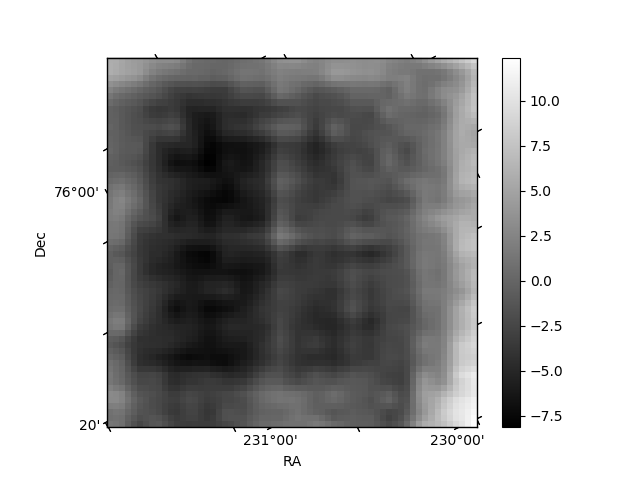
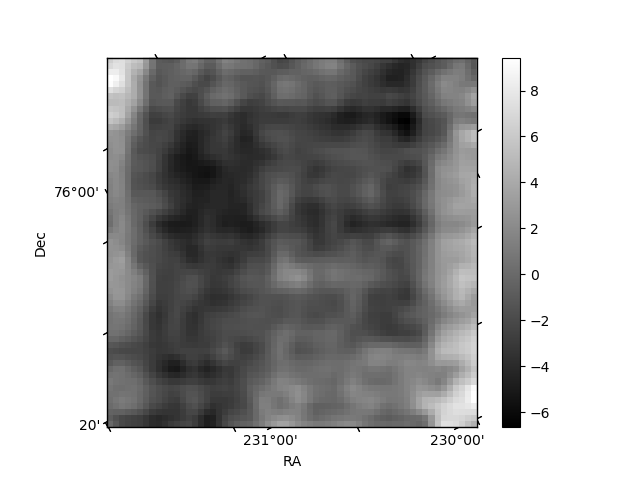
Histogram calculated using DETX and DETY for each event in the final _common_clean file
| Quadrant A | 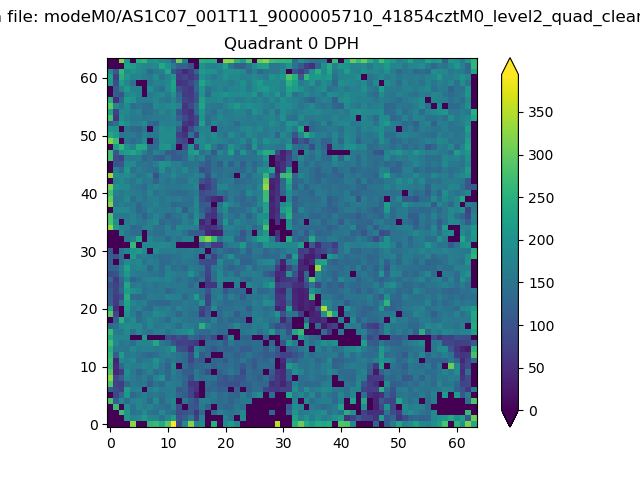 |
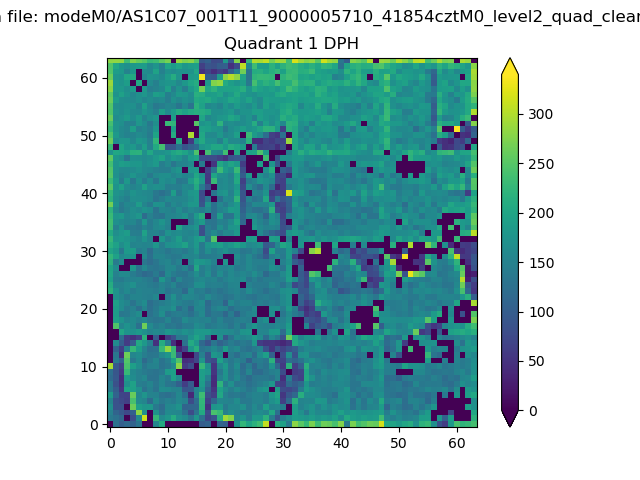 |
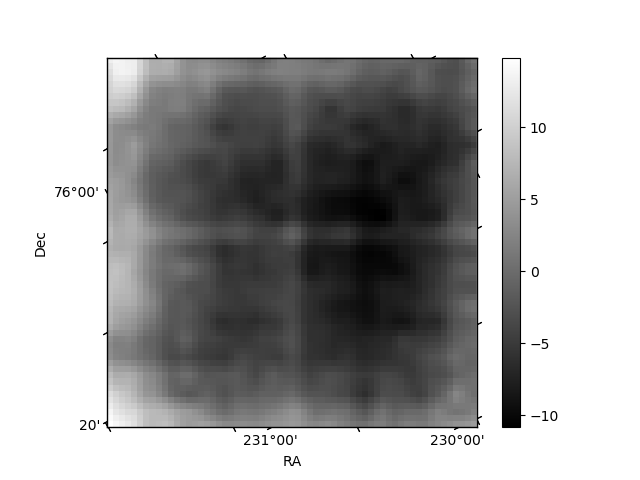
Quadrant B |
|---|---|---|---|
| Quadrant D | 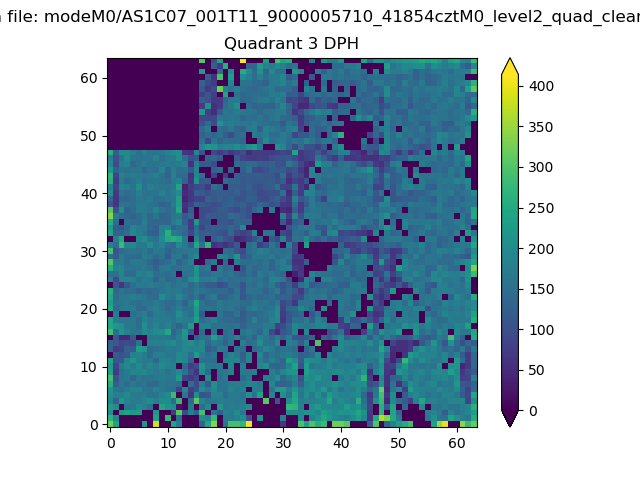 |
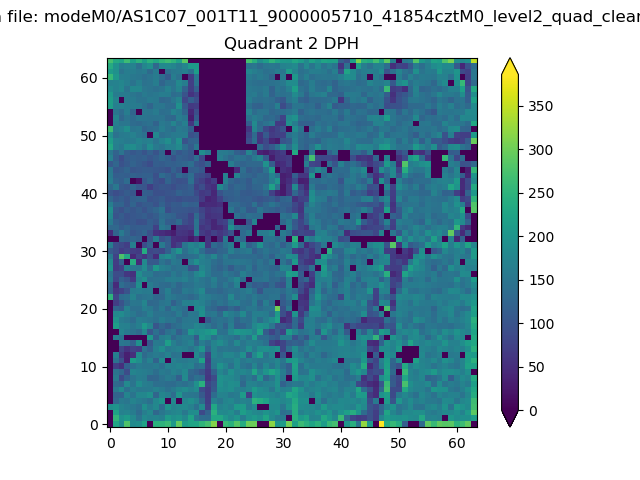 |
Quadrant C |
| Plot type | Count rate plots | Images |
|---|---|---|
| Comparison with Poisson distribution Blue bars denote a histogram of data divided into 1 sec bins. Red curve is a Poisson curve with rate = median count rate of data. |
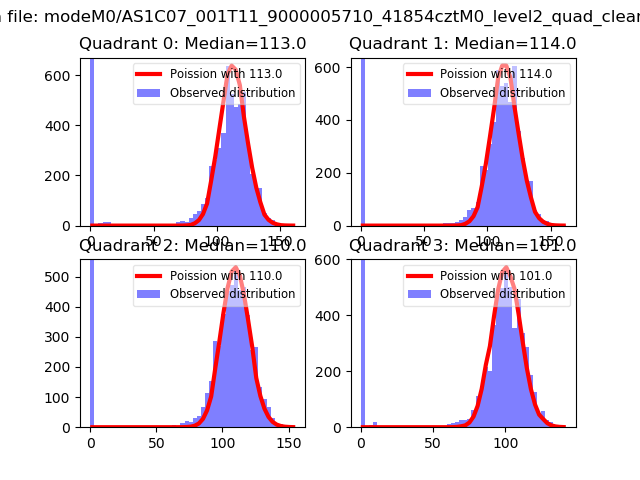 |
 |
| Quadrant-wise count rates Data is divided into 100 sec bins |
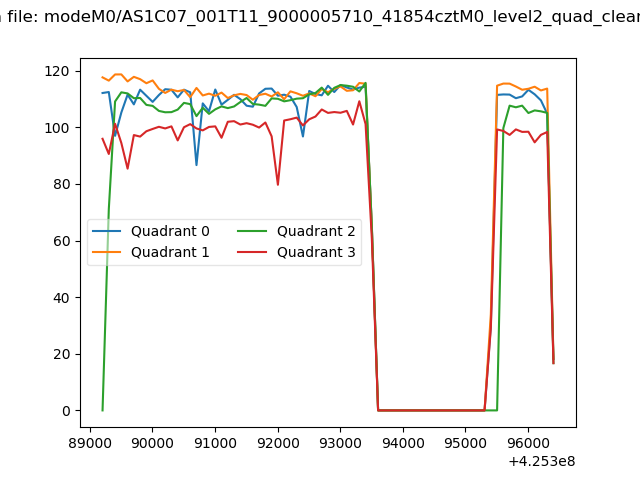 |
|
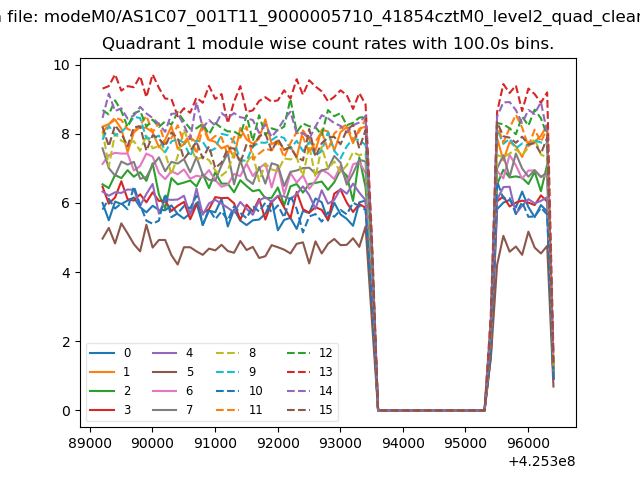
| Module-wise count rates for Quadrant A Data is divided into 100 sec bins |
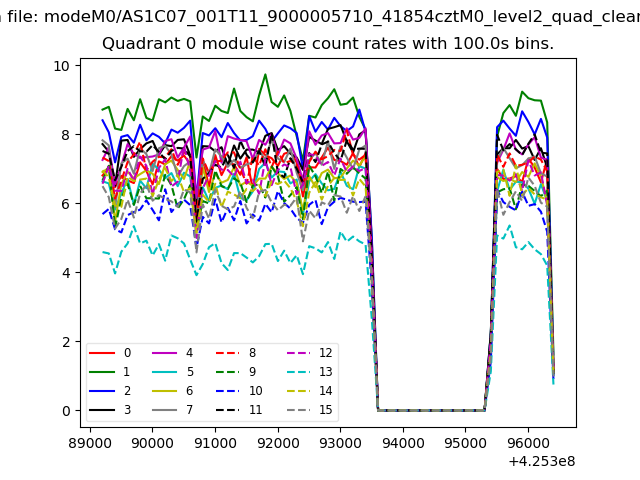 |
 |
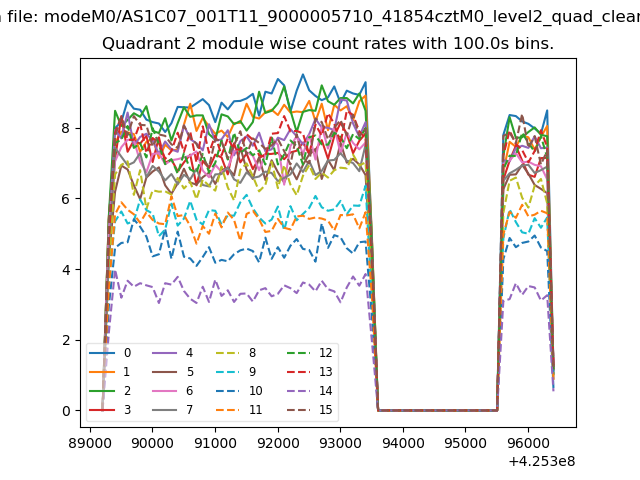
| Module-wise count rates for Quadrant B Data is divided into 100 sec bins |
 |
 |
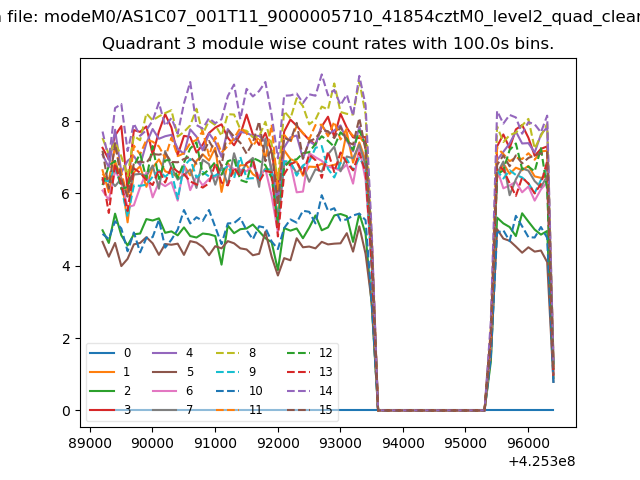
| Module-wise count rates for Quadrant C Data is divided into 100 sec bins |
 |
 |
| Module-wise count rates for Quadrant D Data is divided into 100 sec bins |
 |
 |
| Parameter | Plot |
|---|---|
| CZT HV Monitor | 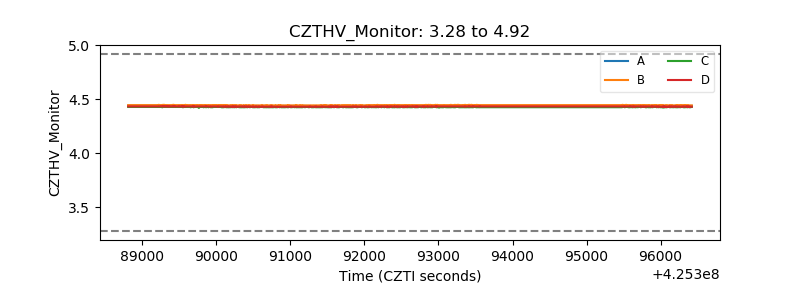 |
| D_VDD | 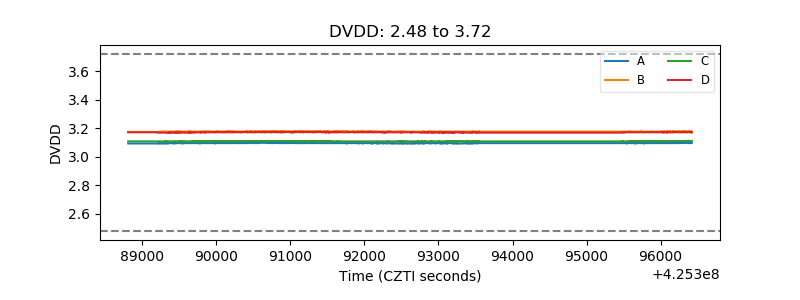 |
| Temperature 1 |  |
| Veto HV Monitor | 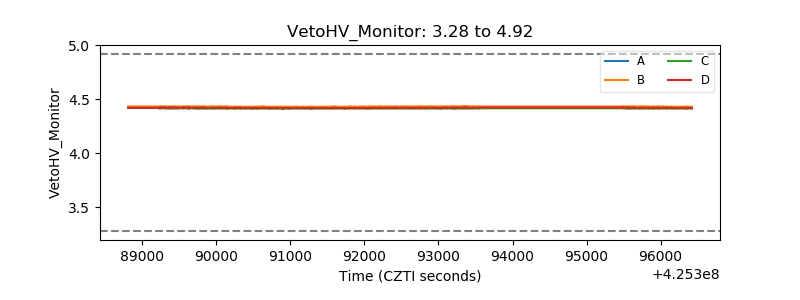 |
| Veto LLD | 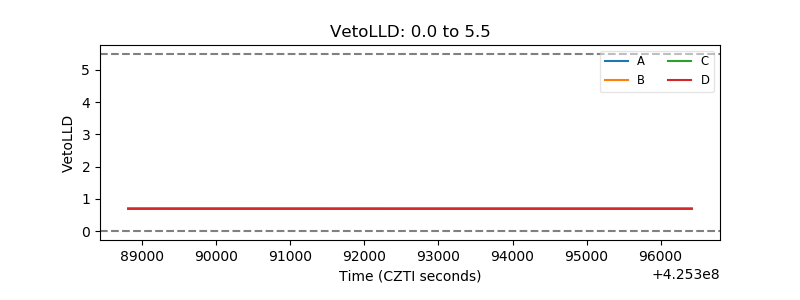 |
| Alpha Counter | 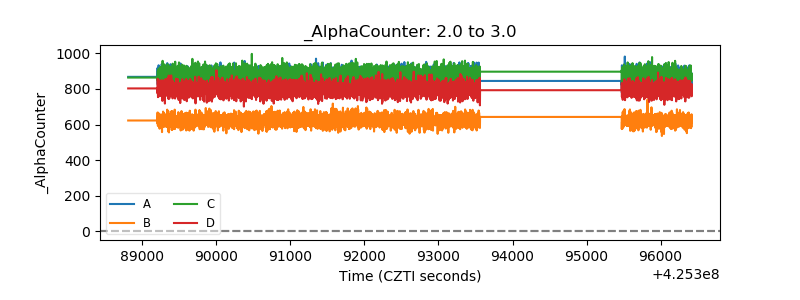 |
| _CPM_Rate | 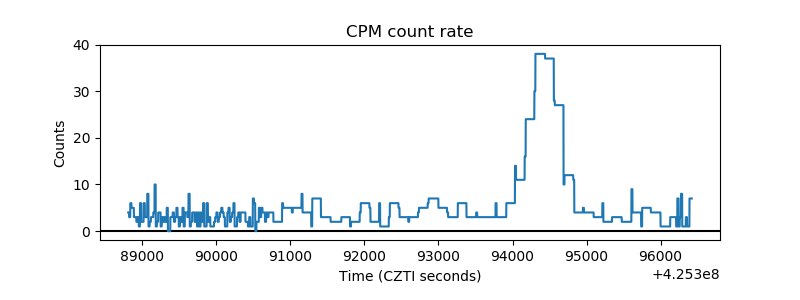 |
| CZT Counter | 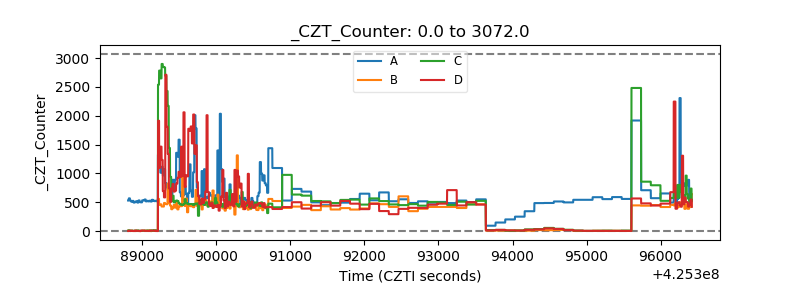 |
| +2.5 Volts monitor |  |
| +5 Volts monitor | 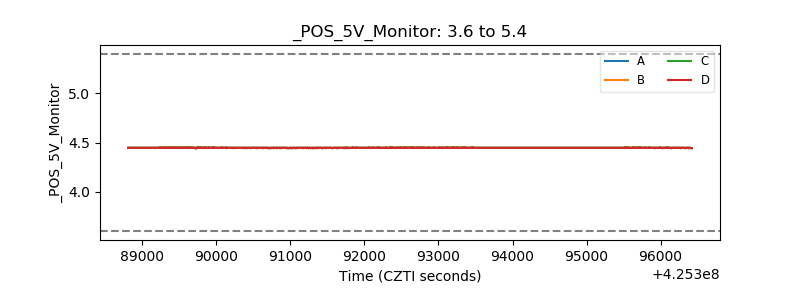 |
| _ROLL_ROT | 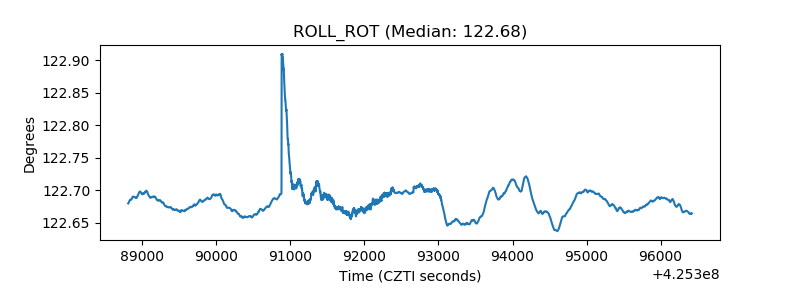 |
| _Roll_DEC | 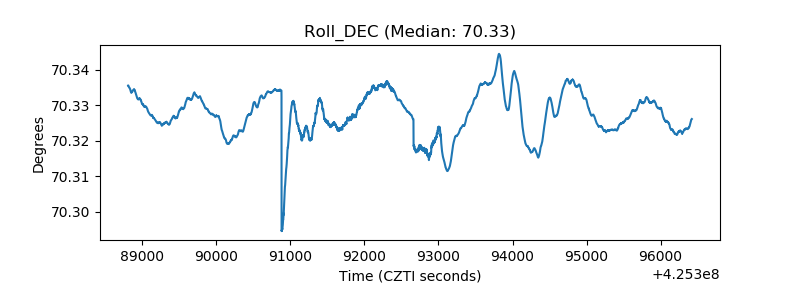 |
| _Roll_RA | 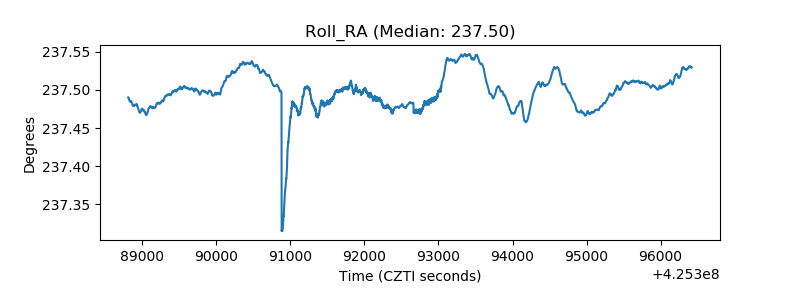 |
| Veto Counter | 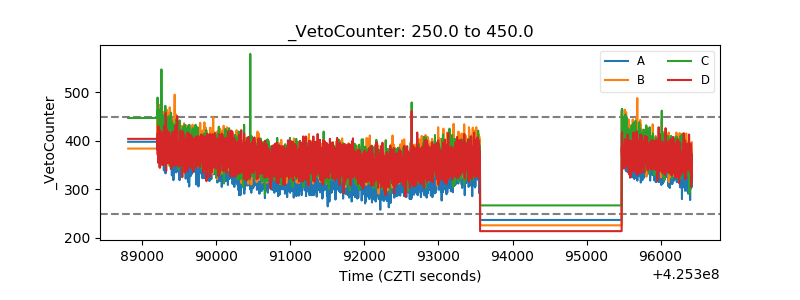 |