| Param | Original file | Final file |
|---|---|---|
| Filename | modeM0/AS1C07_001T11_9000005710_41855cztM0_level2.fits | modeM0/AS1C07_001T11_9000005710_41855cztM0_level2_quad_clean.evt |
| Size (bytes) | 364,573,440 | 90,417,600 |
| Size | 347.7 MB | 86.2 MB |
| Events in quadrant A | 3,635,365 | 601,875 |
| Events in quadrant B | 2,587,133 | 621,052 |
| Events in quadrant C | 3,682,322 | 575,416 |
| Events in quadrant D | 3,154,966 | 547,899 |
| Mode SS | |||
|---|---|---|---|
| Quadrant | BADHDUFLAG | Total packets | Discarded packets |
| A | 0 | 114 | 0 |
| B | 0 | 114 | 0 |
| C | 0 | 114 | 0 |
| D | 0 | 114 | 0 |
| Mode M0 | |||
|---|---|---|---|
| Quadrant | BADHDUFLAG | Total packets | Discarded packets |
| A | 0 | 14339 | 8 |
| B | 0 | 11785 | 2 |
| C | 0 | 14424 | 2 |
| D | 0 | 13465 | 2 |
| Mode M9 | |||
|---|---|---|---|
| Quadrant | BADHDUFLAG | Total packets | Discarded packets |
| A | 0 | 21 | 0 |
| B | 0 | 21 | 0 |
| C | 0 | 22 | 0 |
| D | 0 | 22 | 0 |
| Quadrant | Total seconds | Saturated seconds | Saturation percentage |
|---|---|---|---|
| A | 5593 | 157 | 2.807080% |
| B | 5594 | 26 | 0.464784% |
| C | 5594 | 273 | 4.880229% |
| D | 5594 | 144 | 2.574187% |
Noise dominated data is calculated using 1-second bins in cleaned event files. If a bin has >2000 counts, and if more than 50% of those come from <1% of pixels, then it is considered to be noise-dominated and hence unusable.
| Quadrant | # 1 sec bins | Bins with >0 counts | Bins with >2000 counts | High rate bins dominated by noise | Noise dominated (total time) | Noise dominated (detector-on time) | Marked lightcurve |
|---|---|---|---|---|---|---|---|
| A | 7176 | 5595 | 135 | 135 | 1.88% | 2.41% | 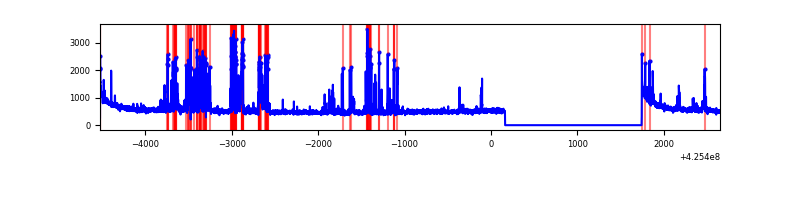 |
| B | 7176 | 5595 | 8 | 8 | 0.11% | 0.14% | 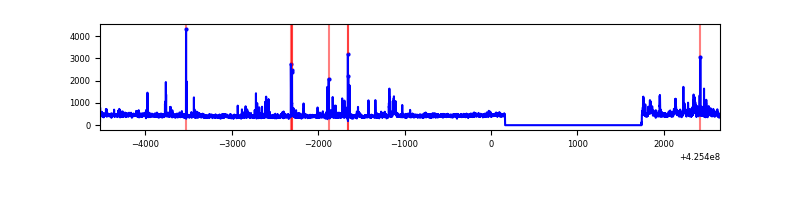 |
| C | 7176 | 5595 | 272 | 272 | 3.79% | 4.86% | 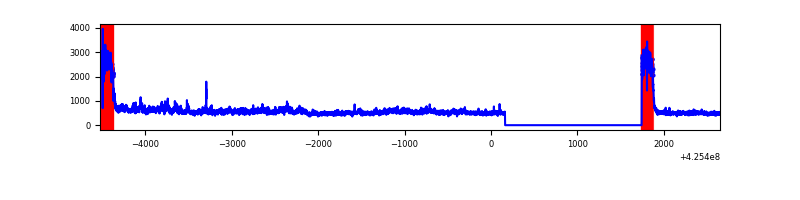 |
| D | 7176 | 5595 | 114 | 114 | 1.59% | 2.04% | 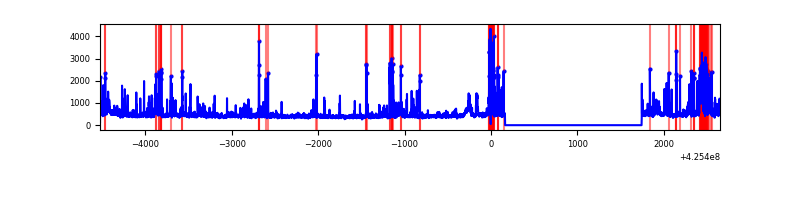 |
Top three noisy pixels from each quadrant. If the there are fewer than three noisy pixels in the level2.evt file, extra rows are filled as -1
| Pixel properties | Quadrant properties | ||||||
|---|---|---|---|---|---|---|---|
| Quadrant | DetID | PixID | Counts | Sigma | Mean | Median | Sigma |
| A | 14 | 24 | 728023 | 5981.65 | 589 | 574 | 121.6 |
| A | 10 | 83 | 606849 | 4985.26 | 589 | 574 | 121.6 |
| A | 2 | 79 | 20592 | 164.6 | 589 | 574 | 121.6 |
| B | 3 | 112 | 95949 | 852.66 | 590 | 575 | 111.9 |
| B | 0 | 229 | 34272 | 301.26 | 590 | 575 | 111.9 |
| B | 0 | 156 | 33069 | 290.5 | 590 | 575 | 111.9 |
| C | 0 | 10 | 1262140 | 9558.03 | 563 | 567 | 132.0 |
| C | 15 | 214 | 218535 | 1651.39 | 563 | 567 | 132.0 |
| C | 15 | 111 | 4579 | 30.4 | 563 | 567 | 132.0 |
| D | 13 | 249 | 534129 | 3754.83 | 581 | 566 | 142.1 |
| D | 2 | 249 | 109256 | 764.88 | 581 | 566 | 142.1 |
| D | 5 | 222 | 75913 | 530.24 | 581 | 566 | 142.1 |
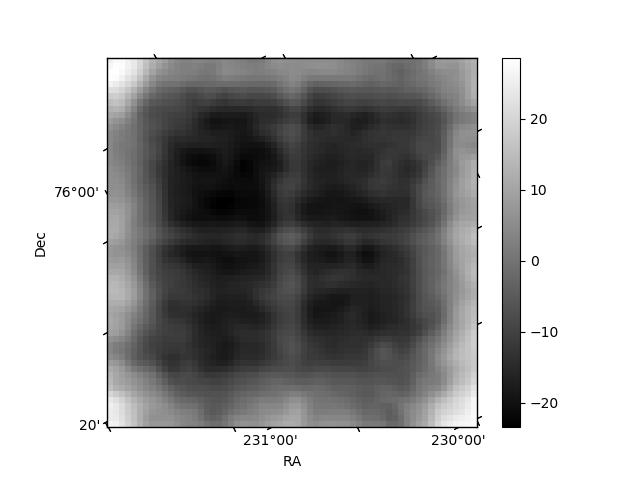
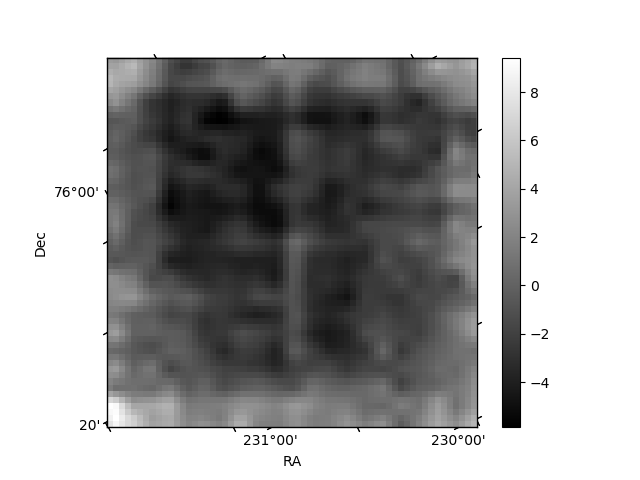
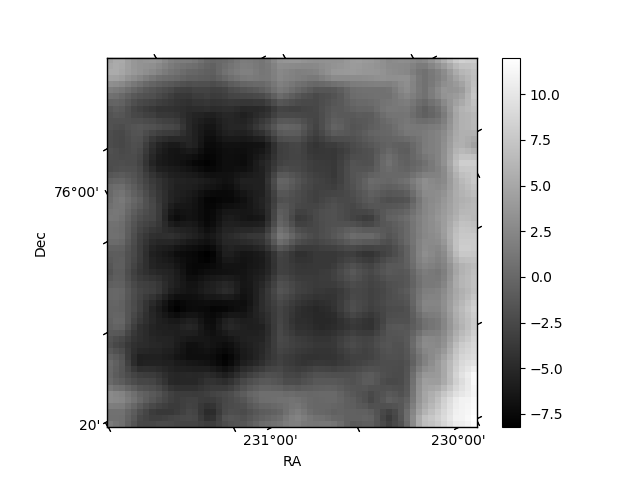
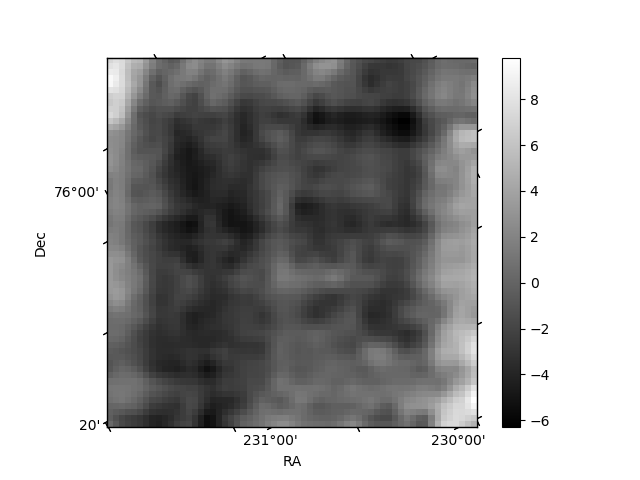
Histogram calculated using DETX and DETY for each event in the final _common_clean file
| Quadrant A | 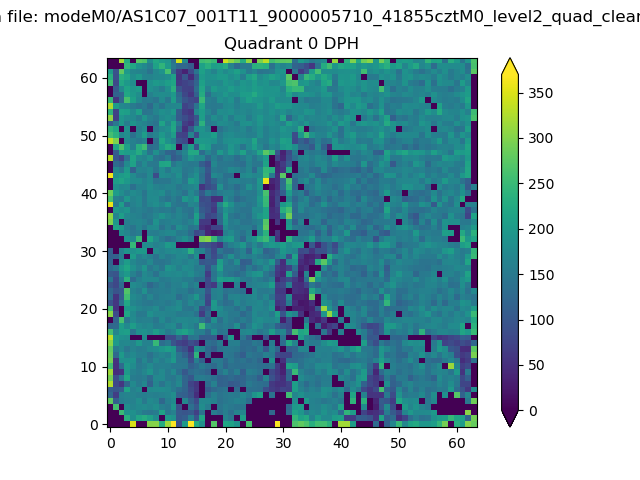 |
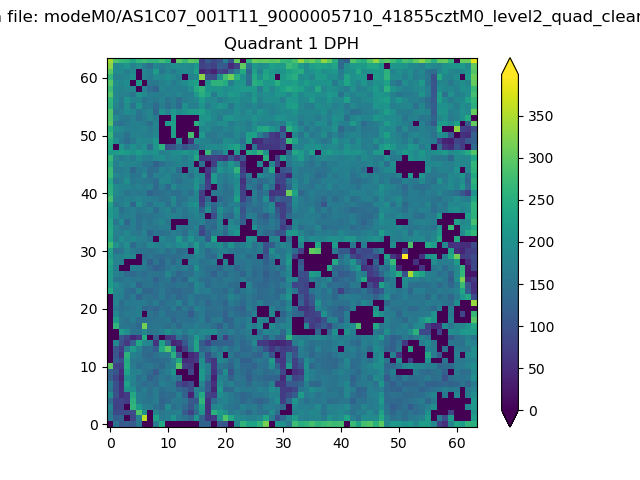 |
Quadrant B |
|---|---|---|---|
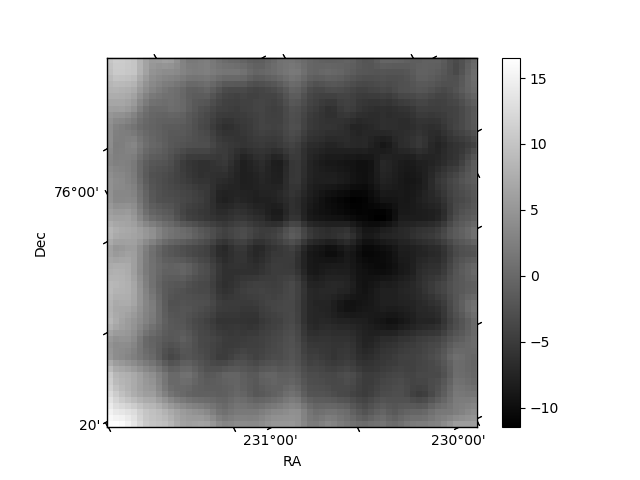
| Quadrant D | 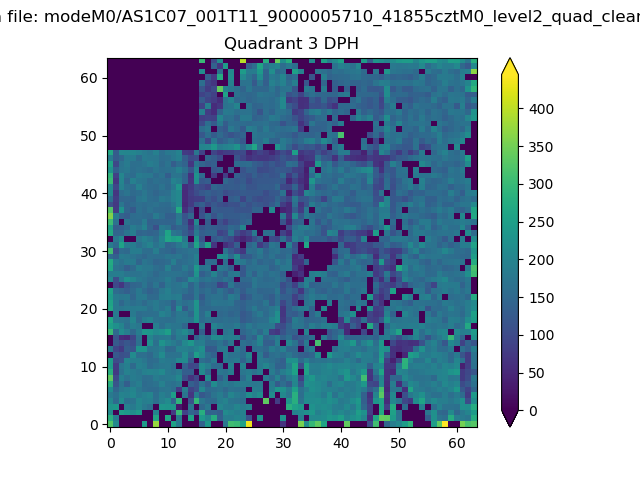 |
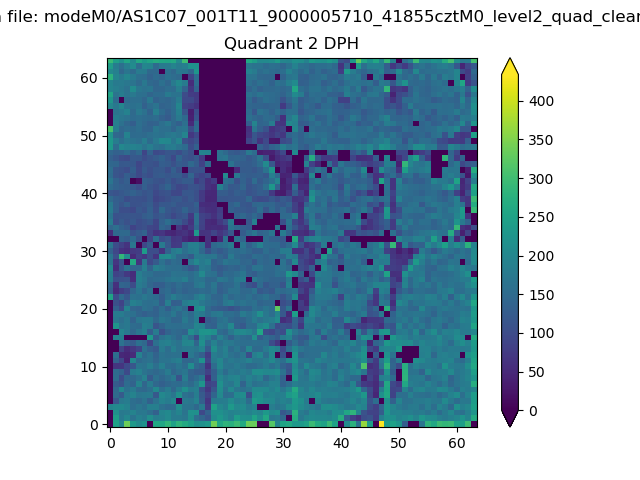 |
Quadrant C |
| Plot type | Count rate plots | Images |
|---|---|---|
| Comparison with Poisson distribution Blue bars denote a histogram of data divided into 1 sec bins. Red curve is a Poisson curve with rate = median count rate of data. |
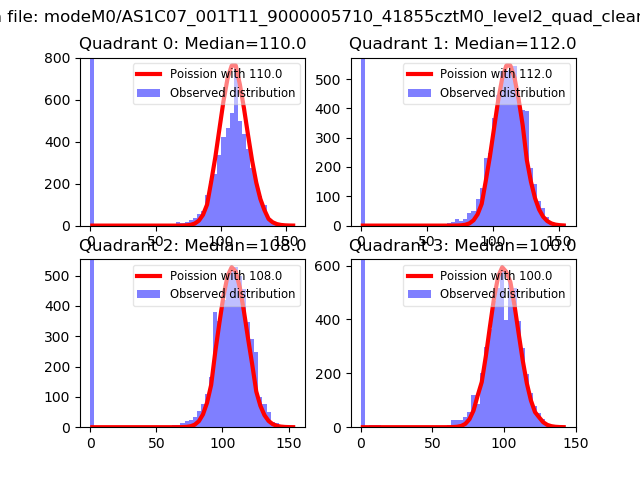 |
 |
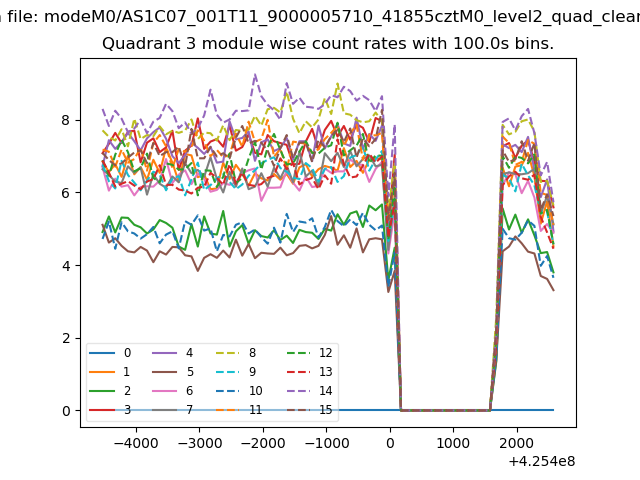
| Quadrant-wise count rates Data is divided into 100 sec bins |
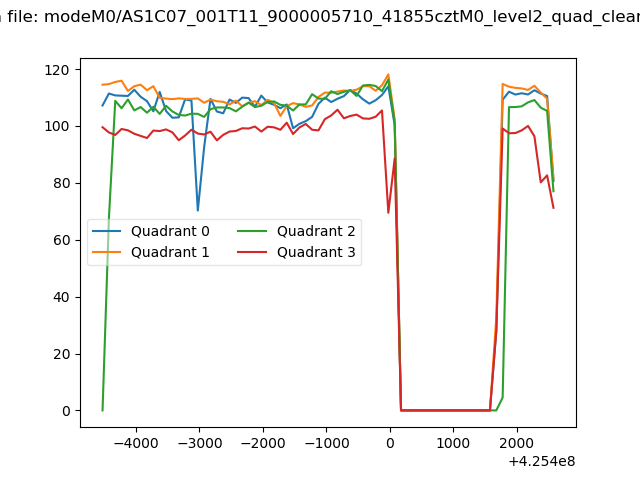 |
|
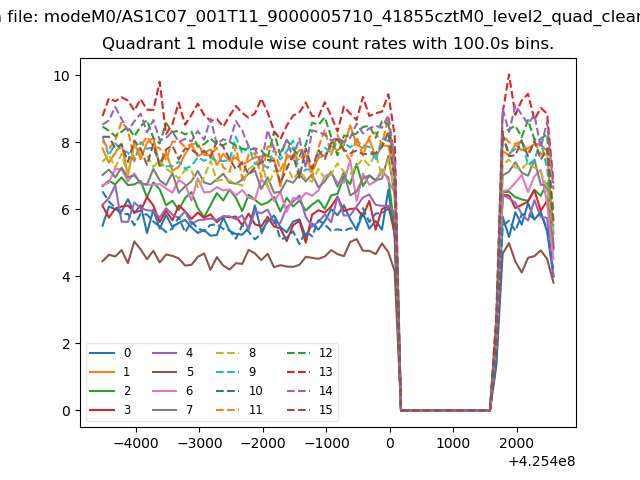
| Module-wise count rates for Quadrant A Data is divided into 100 sec bins |
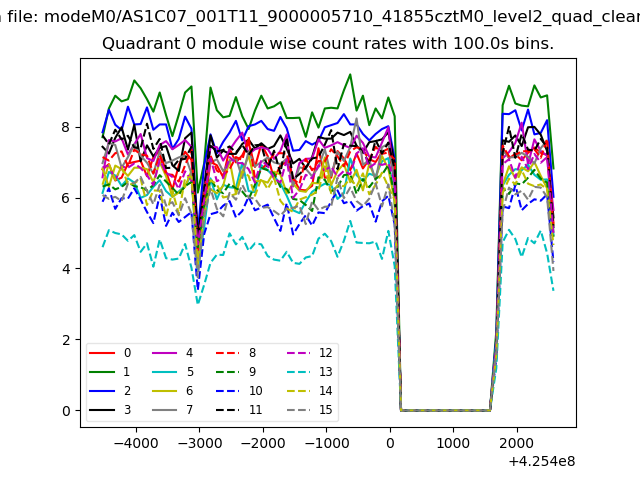 |
 |
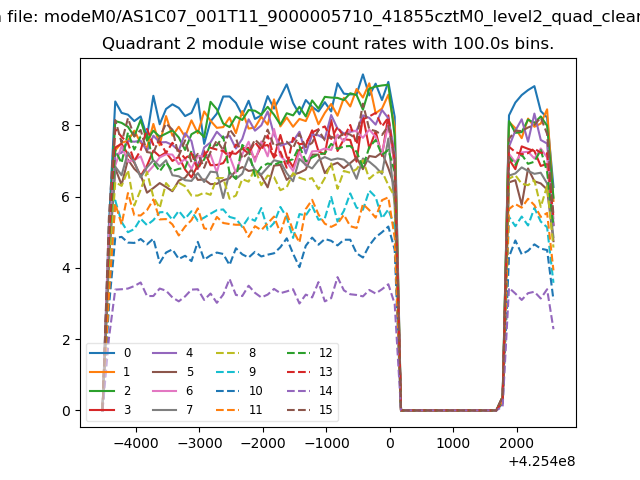
| Module-wise count rates for Quadrant B Data is divided into 100 sec bins |
 |
 |
| Module-wise count rates for Quadrant C Data is divided into 100 sec bins |
 |
 |
| Module-wise count rates for Quadrant D Data is divided into 100 sec bins |
 |
 |
| Parameter | Plot |
|---|---|
| CZT HV Monitor | 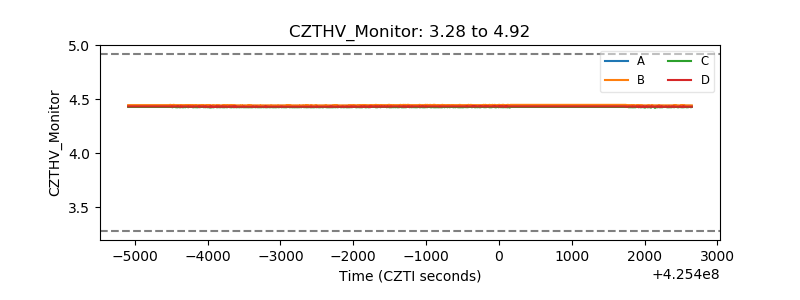 |
| D_VDD | 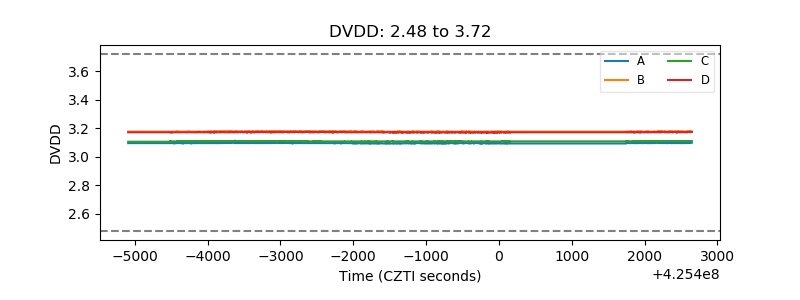 |
| Temperature 1 | 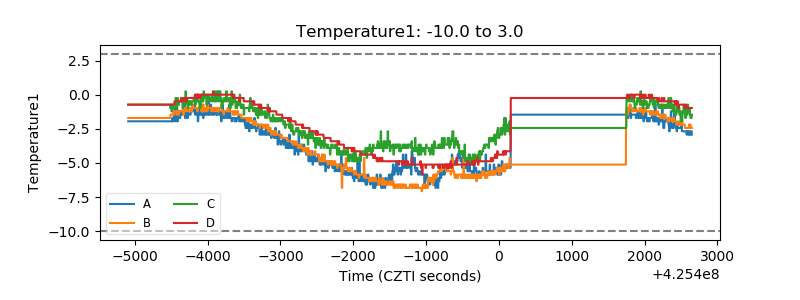 |
| Veto HV Monitor | 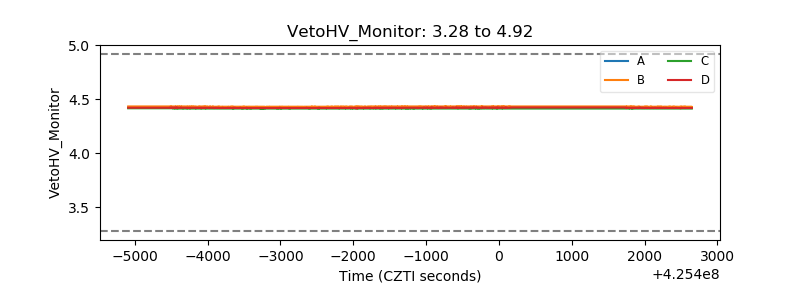 |
| Veto LLD | 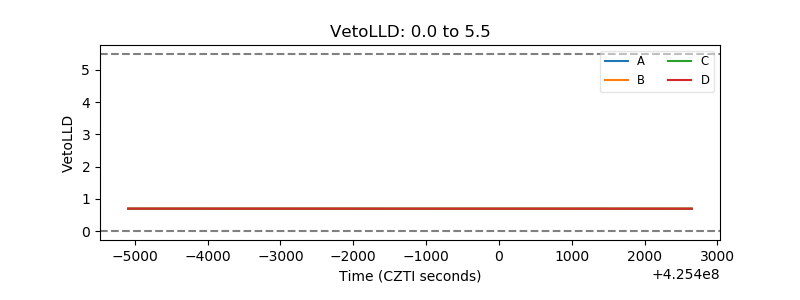 |
| Alpha Counter | 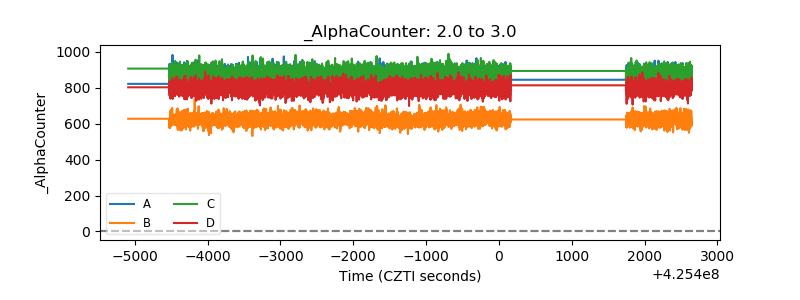 |
| _CPM_Rate | 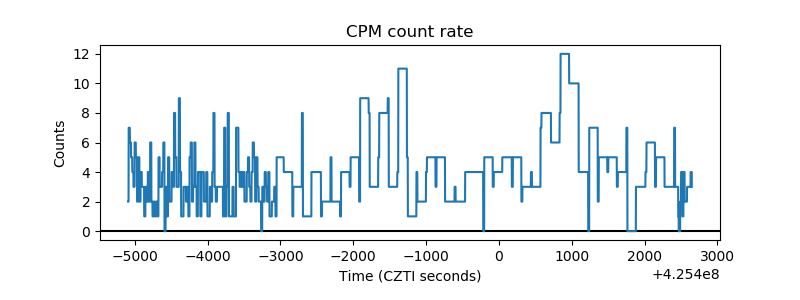 |
| CZT Counter | 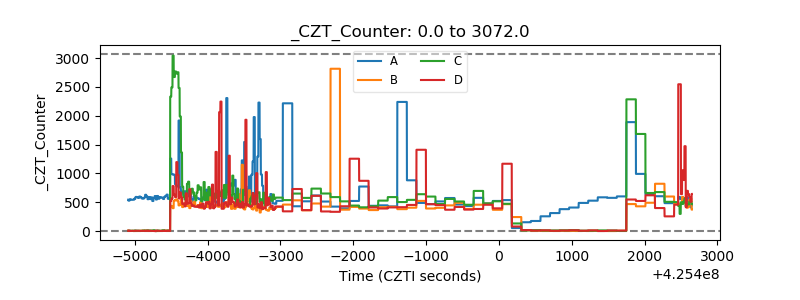 |
| +2.5 Volts monitor | 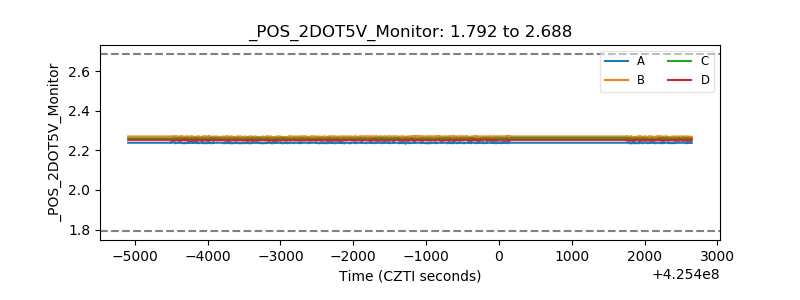 |
| +5 Volts monitor | 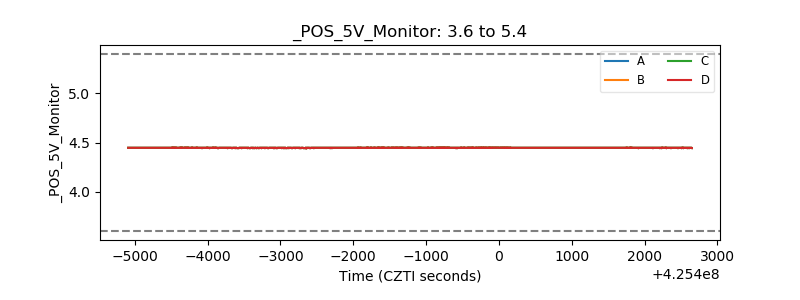 |
| _ROLL_ROT | 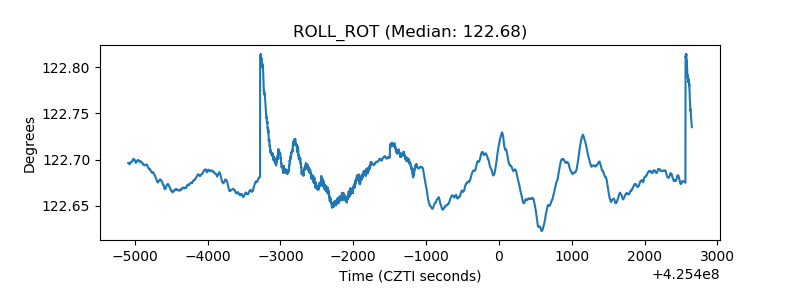 |
| _Roll_DEC | 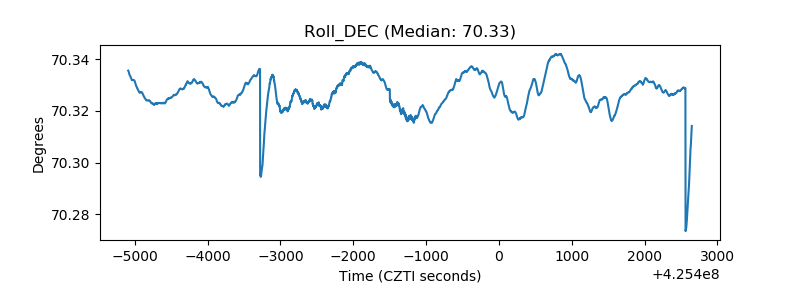 |
| _Roll_RA | 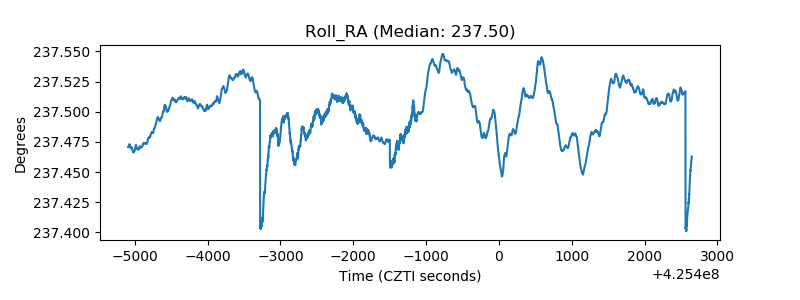 |
| Veto Counter | 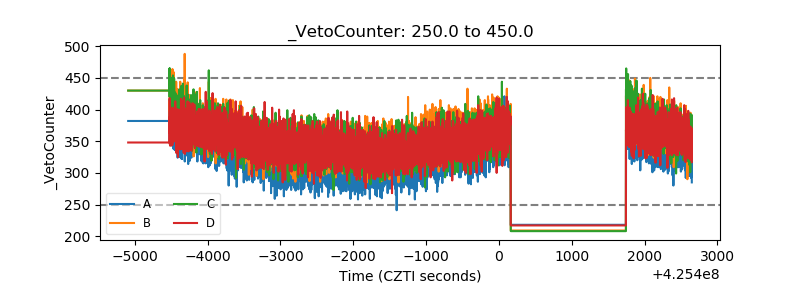 |