| Param | Original file | Final file |
|---|---|---|
| Filename | modeM0/AS1C07_001T11_9000005710_41856cztM0_level2.fits | modeM0/AS1C07_001T11_9000005710_41856cztM0_level2_quad_clean.evt |
| Size (bytes) | 389,329,920 | 91,684,800 |
| Size | 371.3 MB | 87.4 MB |
| Events in quadrant A | 3,257,697 | 622,842 |
| Events in quadrant B | 2,788,122 | 631,266 |
| Events in quadrant C | 3,109,204 | 603,075 |
| Events in quadrant D | 4,811,078 | 518,055 |
| Mode SS | |||
|---|---|---|---|
| Quadrant | BADHDUFLAG | Total packets | Discarded packets |
| A | 0 | 118 | 0 |
| B | 0 | 118 | 0 |
| C | 0 | 118 | 0 |
| D | 0 | 118 | 0 |
| Mode M0 | |||
|---|---|---|---|
| Quadrant | BADHDUFLAG | Total packets | Discarded packets |
| A | 0 | 13292 | 1 |
| B | 0 | 12372 | 1 |
| C | 0 | 12610 | 1 |
| D | 0 | 18422 | 2 |
| Mode M9 | |||
|---|---|---|---|
| Quadrant | BADHDUFLAG | Total packets | Discarded packets |
| A | 0 | 13 | 0 |
| B | 0 | 13 | 0 |
| C | 0 | 13 | 0 |
| D | 0 | 13 | 0 |
| Quadrant | Total seconds | Saturated seconds | Saturation percentage |
|---|---|---|---|
| A | 5727 | 51 | 0.890519% |
| B | 5727 | 32 | 0.558757% |
| C | 5727 | 135 | 2.357255% |
| D | 5726 | 658 | 11.491443% |
Noise dominated data is calculated using 1-second bins in cleaned event files. If a bin has >2000 counts, and if more than 50% of those come from <1% of pixels, then it is considered to be noise-dominated and hence unusable.
| Quadrant | # 1 sec bins | Bins with >0 counts | Bins with >2000 counts | High rate bins dominated by noise | Noise dominated (total time) | Noise dominated (detector-on time) | Marked lightcurve |
|---|---|---|---|---|---|---|---|
| A | 7068 | 5728 | 30 | 30 | 0.42% | 0.52% | 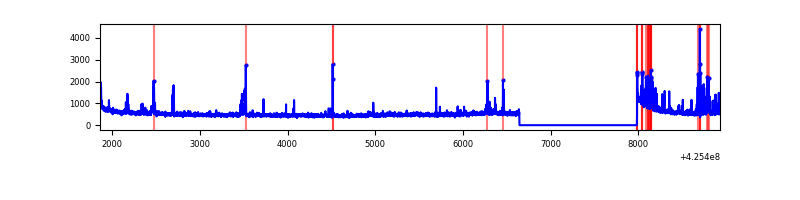 |
| B | 7068 | 5728 | 16 | 16 | 0.23% | 0.28% | 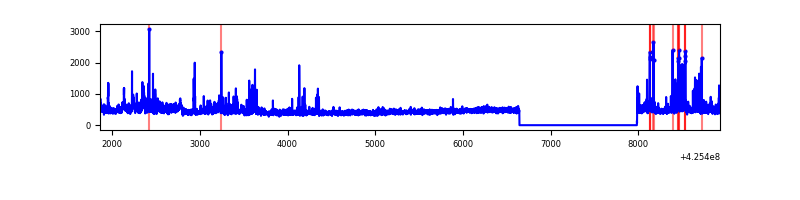 |
| C | 7068 | 5728 | 128 | 128 | 1.81% | 2.23% | 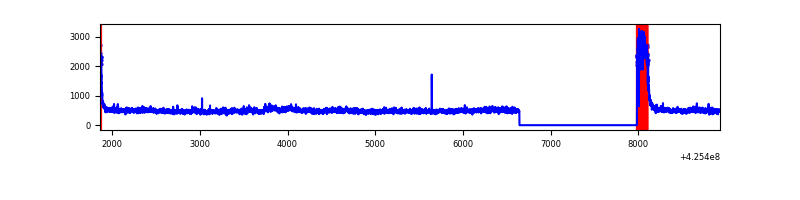 |
| D | 7067 | 5727 | 592 | 592 | 8.38% | 10.34% | 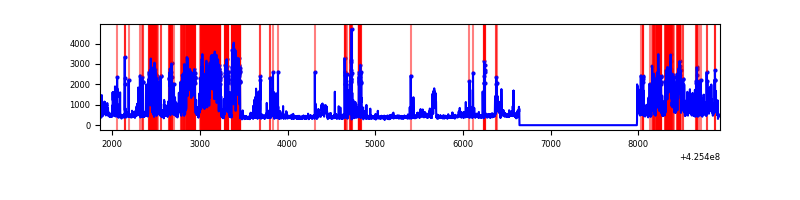 |
Top three noisy pixels from each quadrant. If the there are fewer than three noisy pixels in the level2.evt file, extra rows are filled as -1
| Pixel properties | Quadrant properties | ||||||
|---|---|---|---|---|---|---|---|
| Quadrant | DetID | PixID | Counts | Sigma | Mean | Median | Sigma |
| A | 10 | 83 | 551191 | 4376.76 | 608 | 593 | 125.8 |
| A | 14 | 24 | 340528 | 2702.18 | 608 | 593 | 125.8 |
| A | 2 | 79 | 8518 | 62.99 | 608 | 593 | 125.8 |
| B | 0 | 156 | 80902 | 690.77 | 604 | 589 | 116.3 |
| B | 5 | 32 | 69092 | 589.19 | 604 | 589 | 116.3 |
| B | 0 | 245 | 60542 | 515.65 | 604 | 589 | 116.3 |
| C | 0 | 10 | 577572 | 4172.66 | 589 | 592 | 138.3 |
| C | 15 | 214 | 226957 | 1637.05 | 589 | 592 | 138.3 |
| C | 13 | 61 | 4073 | 25.17 | 589 | 592 | 138.3 |
| D | 13 | 249 | 1615857 | 11560.07 | 571 | 555 | 139.7 |
| D | 2 | 249 | 657440 | 4701.06 | 571 | 555 | 139.7 |
| D | 5 | 222 | 99503 | 708.13 | 571 | 555 | 139.7 |
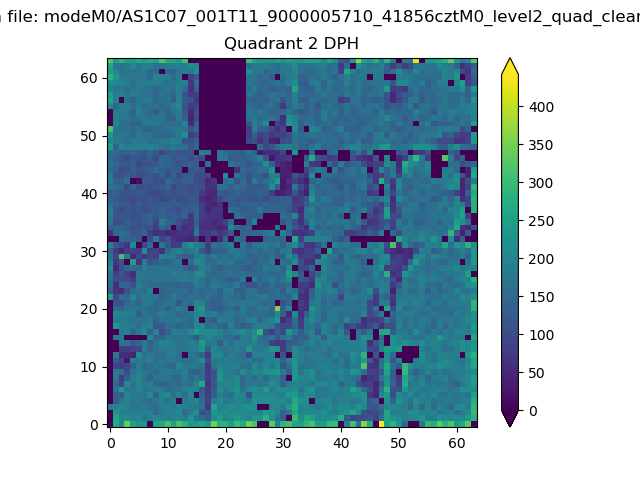
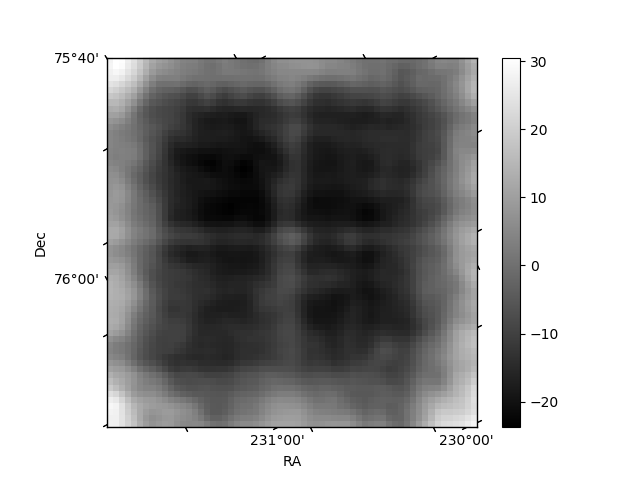
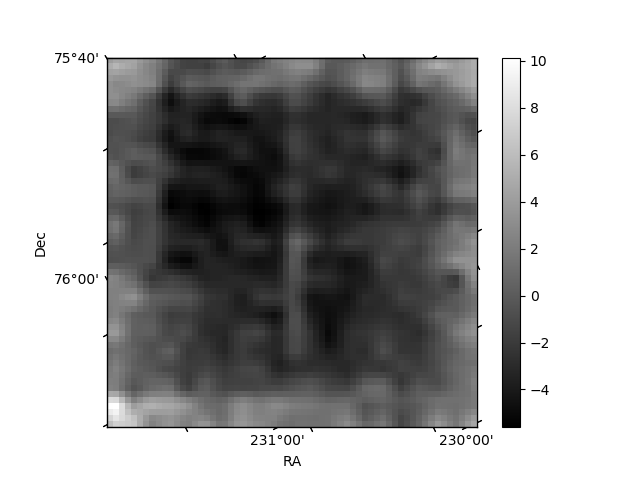
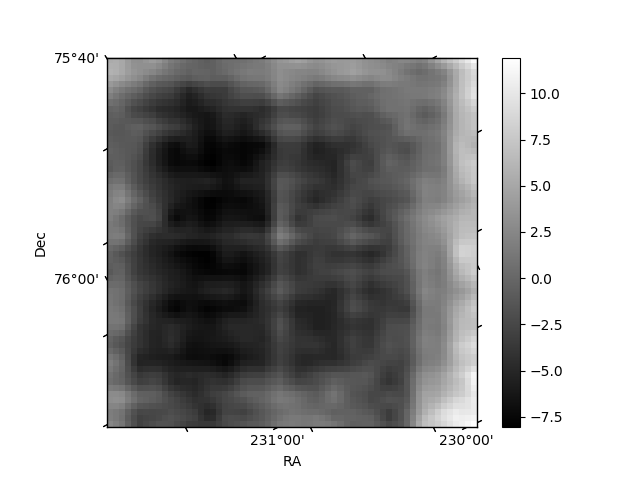
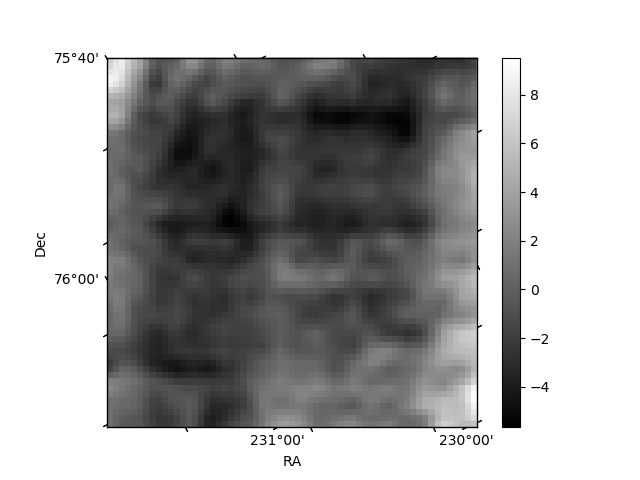
Histogram calculated using DETX and DETY for each event in the final _common_clean file
| Quadrant A | 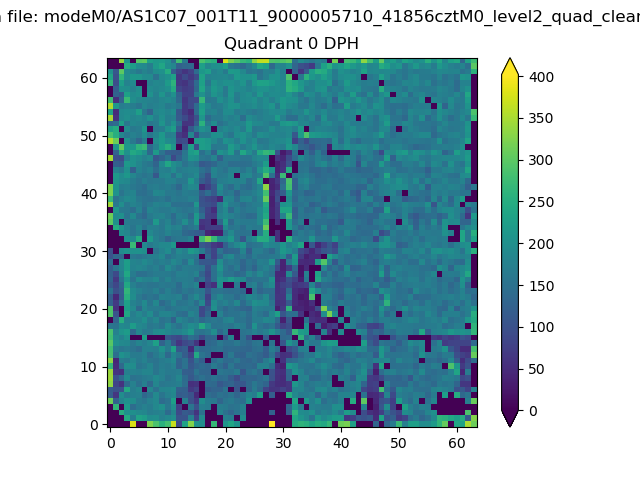 |
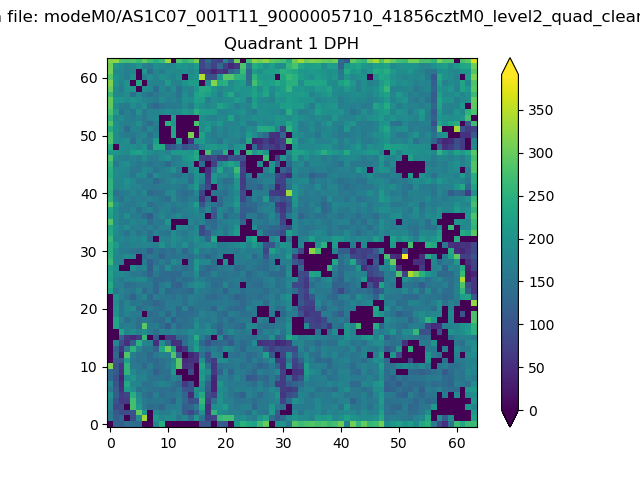 |
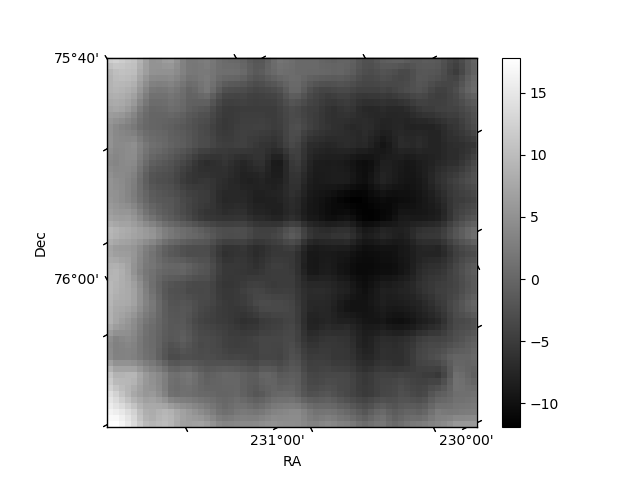
Quadrant B |
|---|---|---|---|
| Quadrant D | 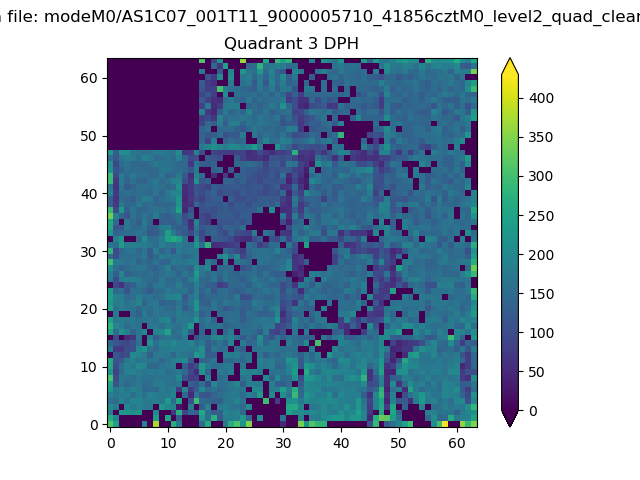 |
 |
Quadrant C |
| Plot type | Count rate plots | Images |
|---|---|---|
| Comparison with Poisson distribution Blue bars denote a histogram of data divided into 1 sec bins. Red curve is a Poisson curve with rate = median count rate of data. |
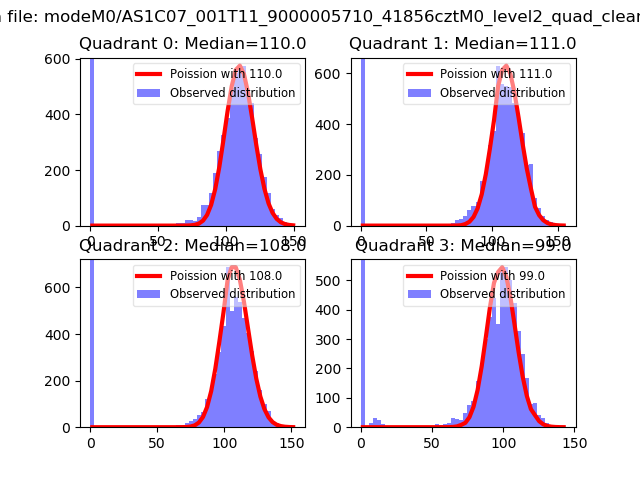 |
 |
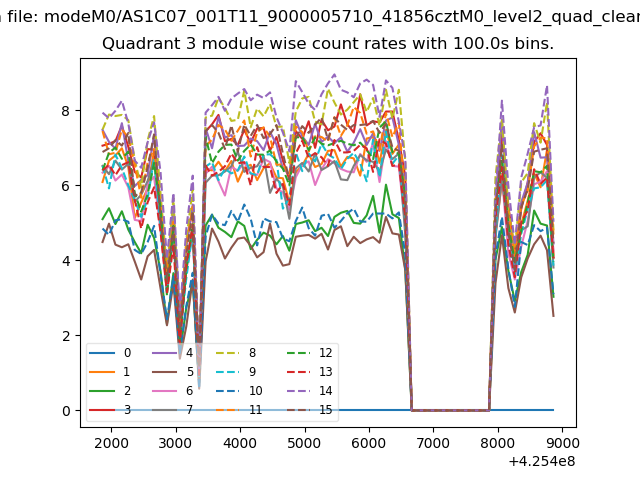
| Quadrant-wise count rates Data is divided into 100 sec bins |
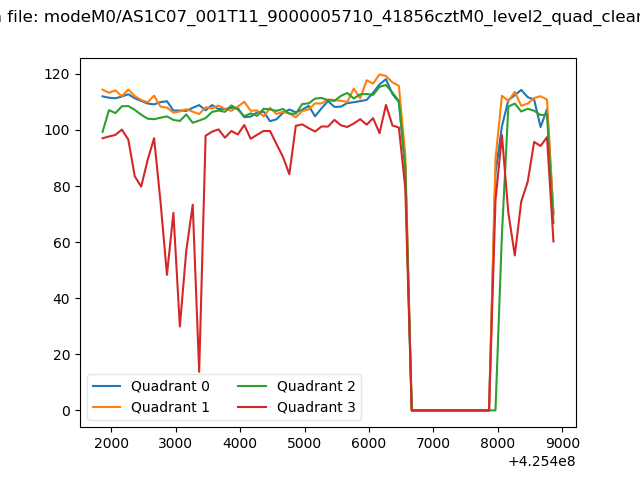 |
|
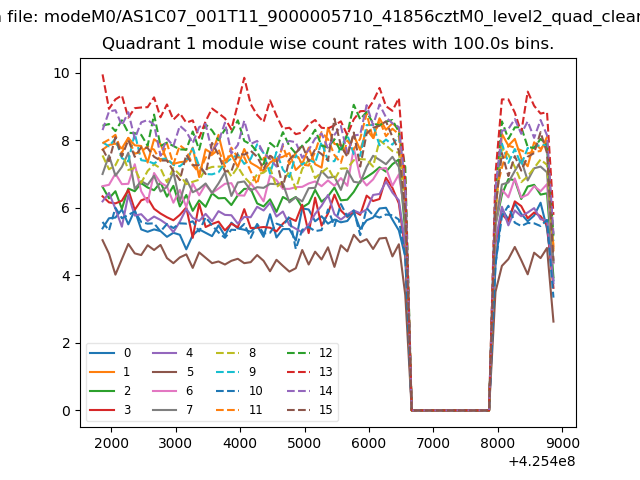
| Module-wise count rates for Quadrant A Data is divided into 100 sec bins |
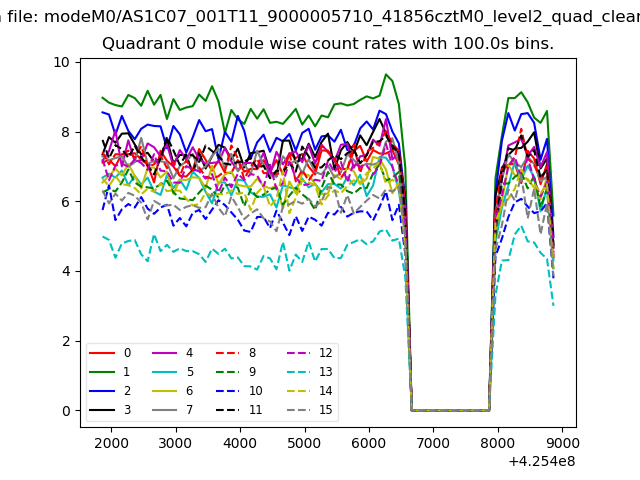 |
 |
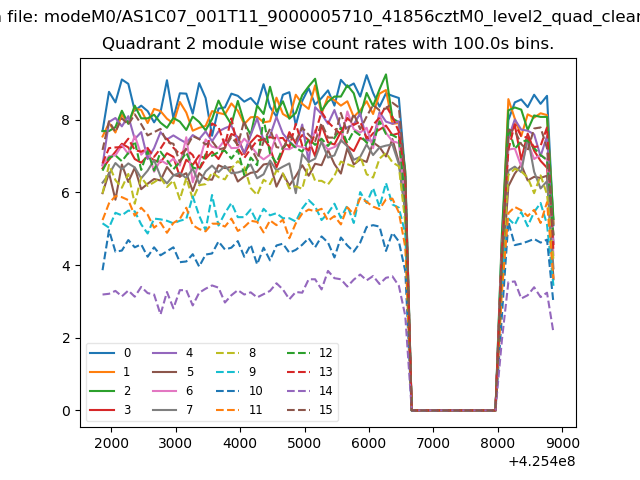
| Module-wise count rates for Quadrant B Data is divided into 100 sec bins |
 |
 |
| Module-wise count rates for Quadrant C Data is divided into 100 sec bins |
 |
 |
| Module-wise count rates for Quadrant D Data is divided into 100 sec bins |
 |
 |
| Parameter | Plot |
|---|---|
| CZT HV Monitor | 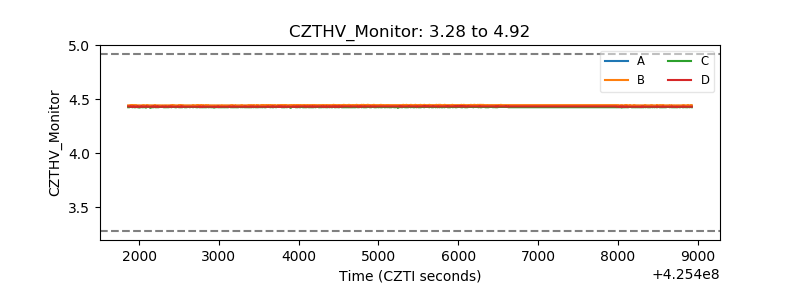 |
| D_VDD | 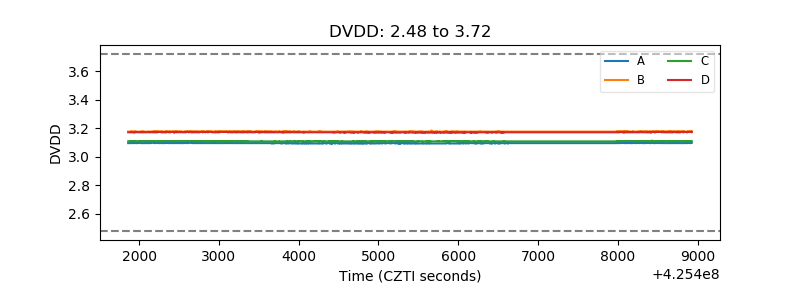 |
| Temperature 1 | 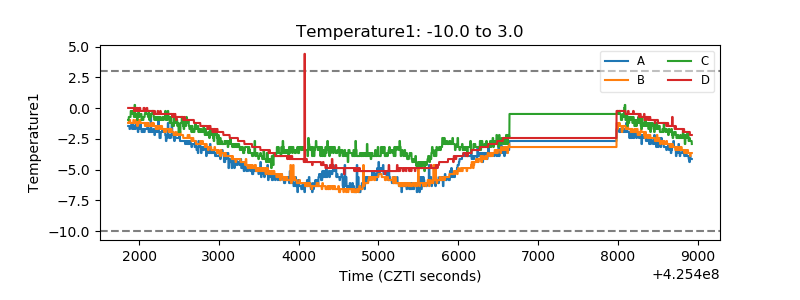 |
| Veto HV Monitor | 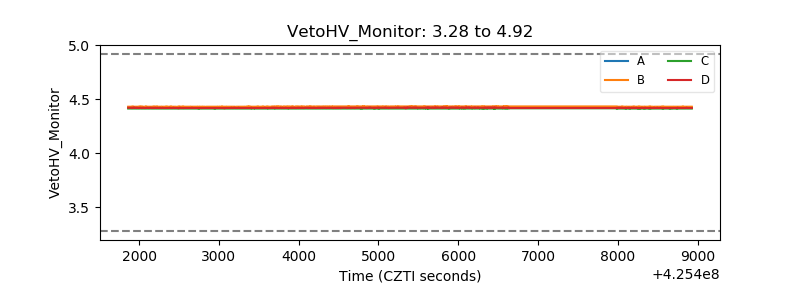 |
| Veto LLD | 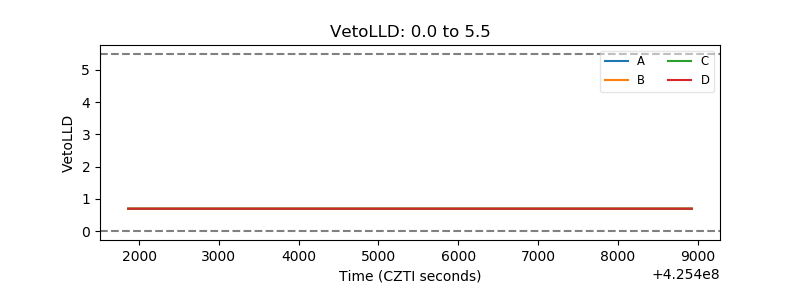 |
| Alpha Counter | 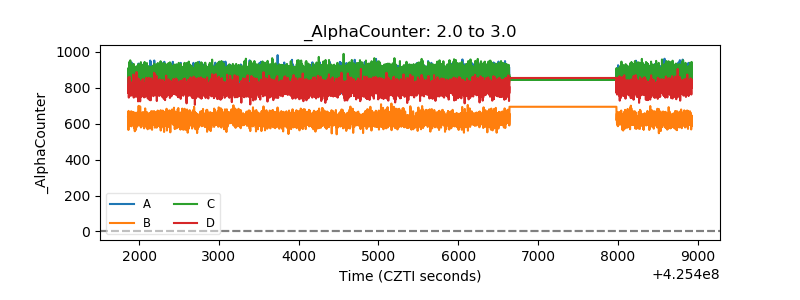 |
| _CPM_Rate | 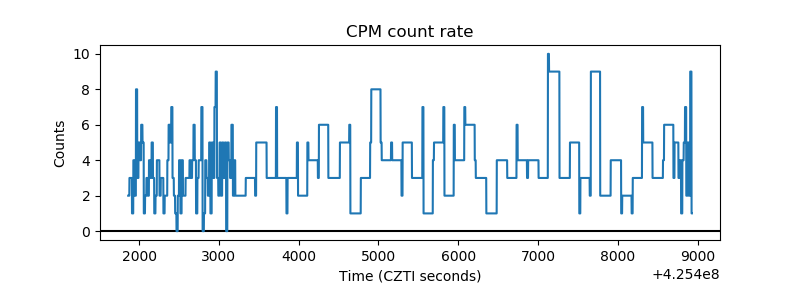 |
| CZT Counter | 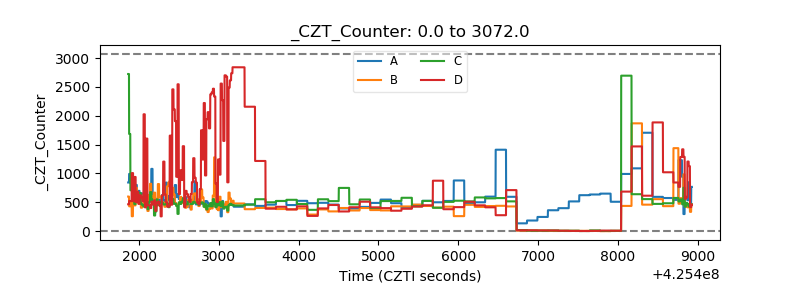 |
| +2.5 Volts monitor | 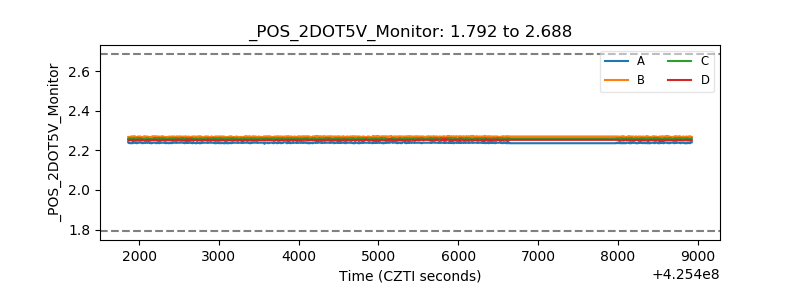 |
| +5 Volts monitor | 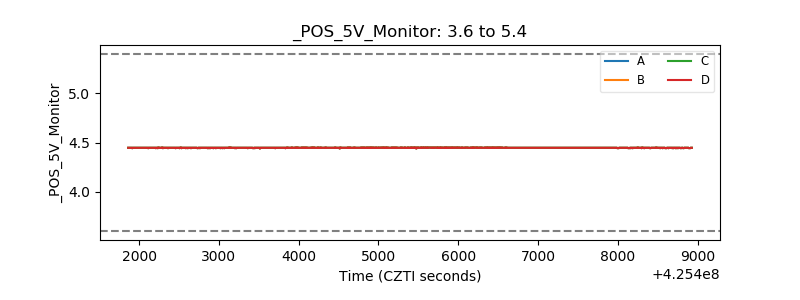 |
| _ROLL_ROT | 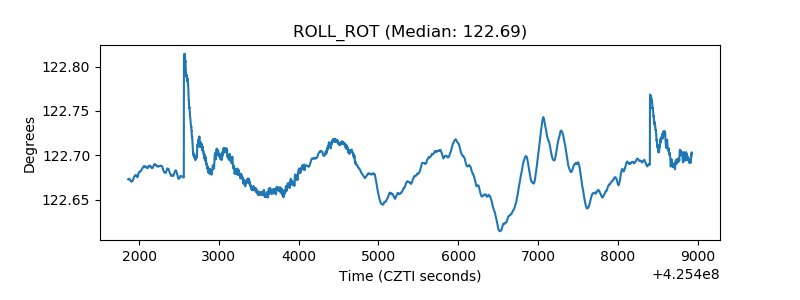 |
| _Roll_DEC |  |
| _Roll_RA | 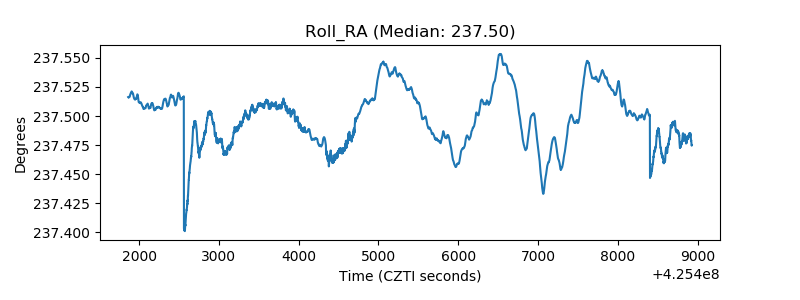 |
| Veto Counter | 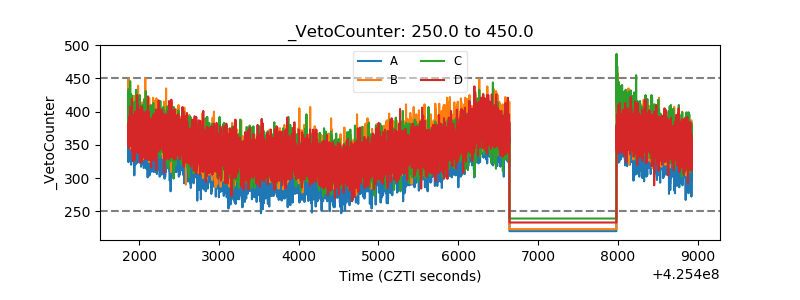 |