| Param | Original file | Final file |
|---|---|---|
| Filename | modeM0/AS1C07_001T11_9000005710_41857cztM0_level2.fits | modeM0/AS1C07_001T11_9000005710_41857cztM0_level2_quad_clean.evt |
| Size (bytes) | 385,931,520 | 94,498,560 |
| Size | 368.1 MB | 90.1 MB |
| Events in quadrant A | 4,099,351 | 629,696 |
| Events in quadrant B | 2,757,381 | 642,849 |
| Events in quadrant C | 3,284,062 | 606,709 |
| Events in quadrant D | 3,687,062 | 570,694 |
| Mode SS | |||
|---|---|---|---|
| Quadrant | BADHDUFLAG | Total packets | Discarded packets |
| A | 0 | 120 | 0 |
| B | 0 | 120 | 0 |
| C | 0 | 120 | 0 |
| D | 0 | 120 | 0 |
| Mode M0 | |||
|---|---|---|---|
| Quadrant | BADHDUFLAG | Total packets | Discarded packets |
| A | 0 | 16014 | 3 |
| B | 0 | 12470 | 2 |
| C | 0 | 13588 | 2 |
| D | 0 | 15203 | 2 |
| Mode M9 | |||
|---|---|---|---|
| Quadrant | BADHDUFLAG | Total packets | Discarded packets |
| A | 0 | 13 | 0 |
| B | 0 | 13 | 0 |
| C | 0 | 13 | 0 |
| D | 0 | 14 | 0 |
| Quadrant | Total seconds | Saturated seconds | Saturation percentage |
|---|---|---|---|
| A | 5884 | 192 | 3.263086% |
| B | 5884 | 36 | 0.611829% |
| C | 5884 | 243 | 4.129844% |
| D | 5884 | 230 | 3.908906% |
Noise dominated data is calculated using 1-second bins in cleaned event files. If a bin has >2000 counts, and if more than 50% of those come from <1% of pixels, then it is considered to be noise-dominated and hence unusable.
| Quadrant | # 1 sec bins | Bins with >0 counts | Bins with >2000 counts | High rate bins dominated by noise | Noise dominated (total time) | Noise dominated (detector-on time) | Marked lightcurve |
|---|---|---|---|---|---|---|---|
| A | 7167 | 5885 | 139 | 139 | 1.94% | 2.36% | 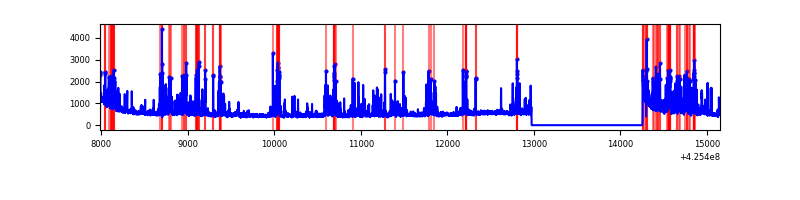 |
| B | 7167 | 5885 | 21 | 21 | 0.29% | 0.36% | 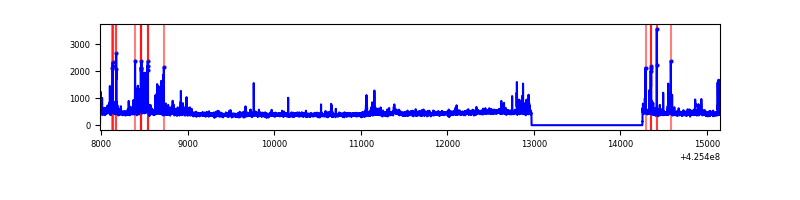 |
| C | 7167 | 5885 | 234 | 234 | 3.26% | 3.98% | 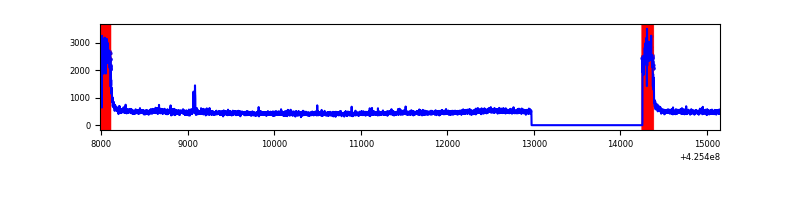 |
| D | 7167 | 5885 | 199 | 199 | 2.78% | 3.38% | 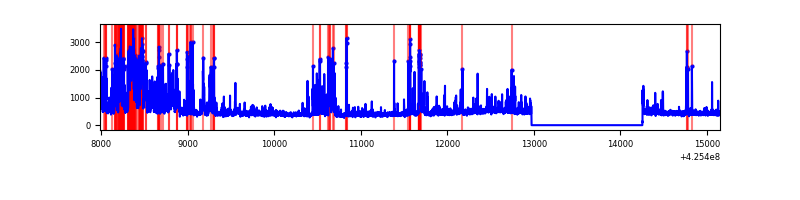 |
Top three noisy pixels from each quadrant. If the there are fewer than three noisy pixels in the level2.evt file, extra rows are filled as -1
| Pixel properties | Quadrant properties | ||||||
|---|---|---|---|---|---|---|---|
| Quadrant | DetID | PixID | Counts | Sigma | Mean | Median | Sigma |
| A | 14 | 24 | 1074642 | 8493.61 | 621 | 609 | 126.5 |
| A | 10 | 83 | 602266 | 4757.99 | 621 | 609 | 126.5 |
| A | 2 | 79 | 9915 | 73.59 | 621 | 609 | 126.5 |
| B | 4 | 81 | 69983 | 577.02 | 623 | 603 | 120.2 |
| B | 5 | 32 | 64629 | 532.49 | 623 | 603 | 120.2 |
| B | 0 | 183 | 40606 | 332.7 | 623 | 603 | 120.2 |
| C | 0 | 10 | 702539 | 5015.34 | 598 | 602 | 140.0 |
| C | 15 | 214 | 228177 | 1626.02 | 598 | 602 | 140.0 |
| C | 15 | 111 | 12930 | 88.08 | 598 | 602 | 140.0 |
| D | 13 | 249 | 601520 | 4030.45 | 611 | 593 | 149.1 |
| D | 2 | 249 | 460849 | 3086.96 | 611 | 593 | 149.1 |
| D | 5 | 222 | 120191 | 802.15 | 611 | 593 | 149.1 |
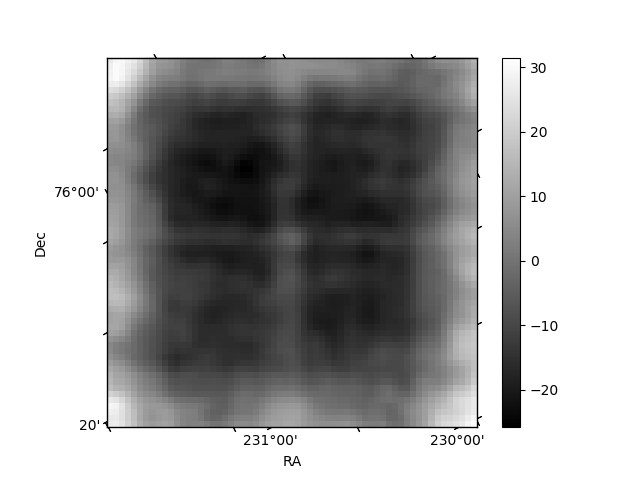
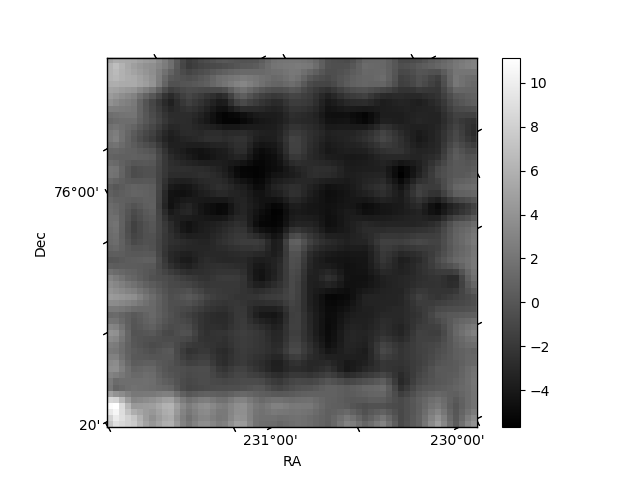
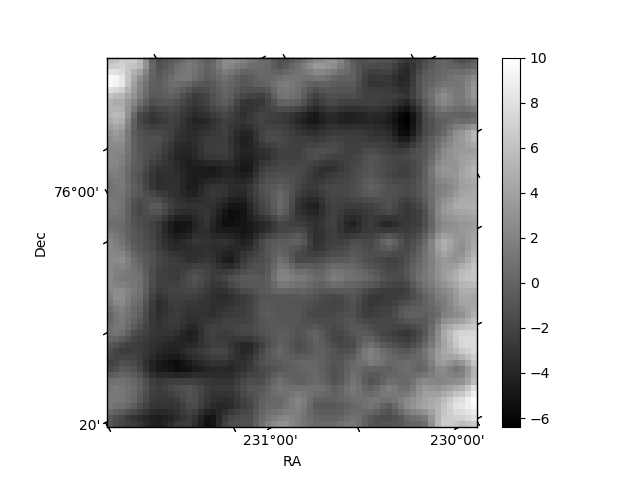
Histogram calculated using DETX and DETY for each event in the final _common_clean file
| Quadrant A | 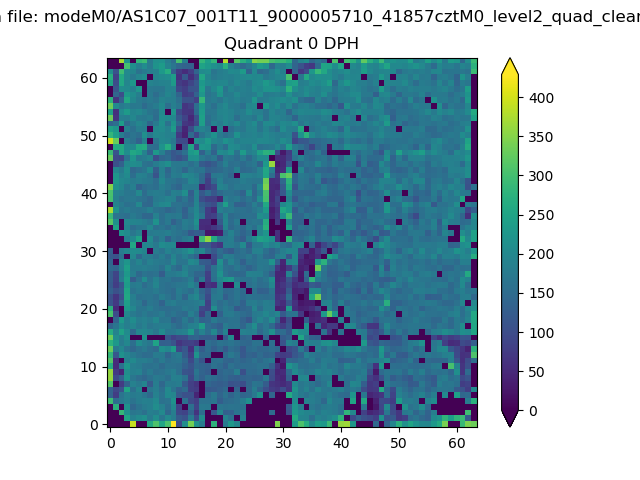 |
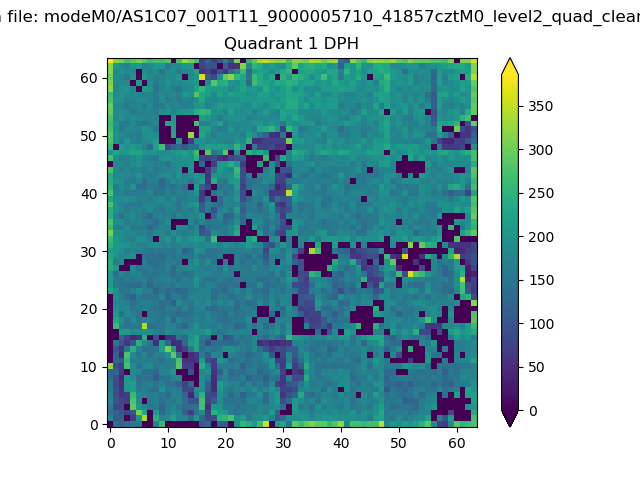 |
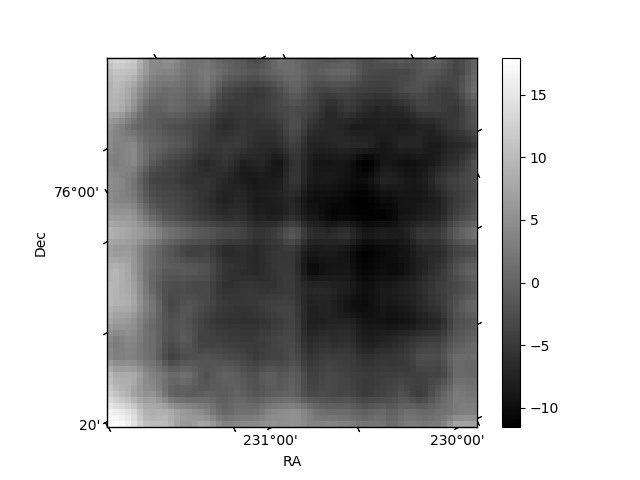
Quadrant B |
|---|---|---|---|
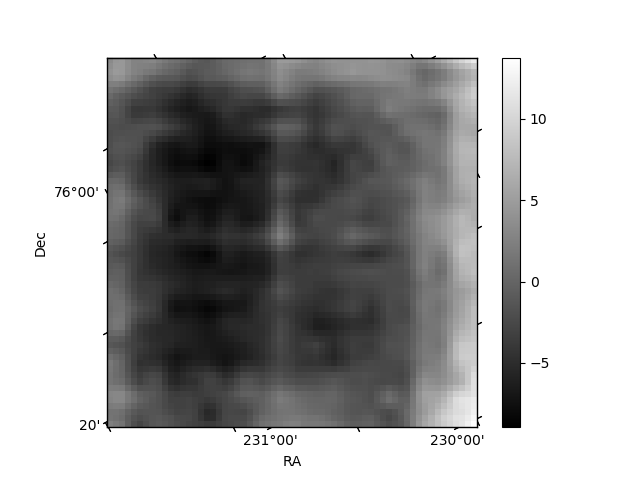
| Quadrant D | 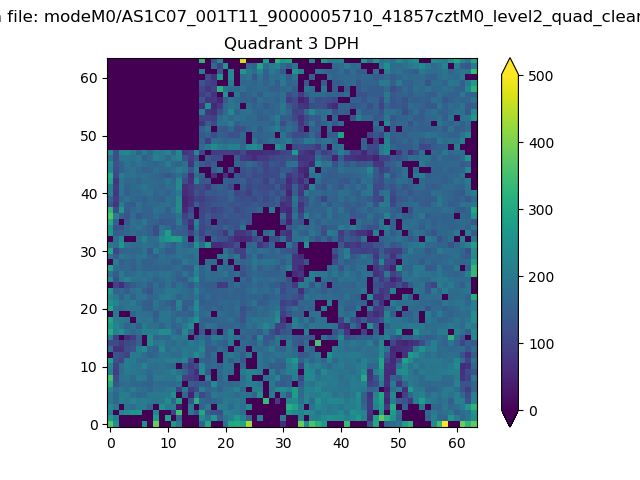 |
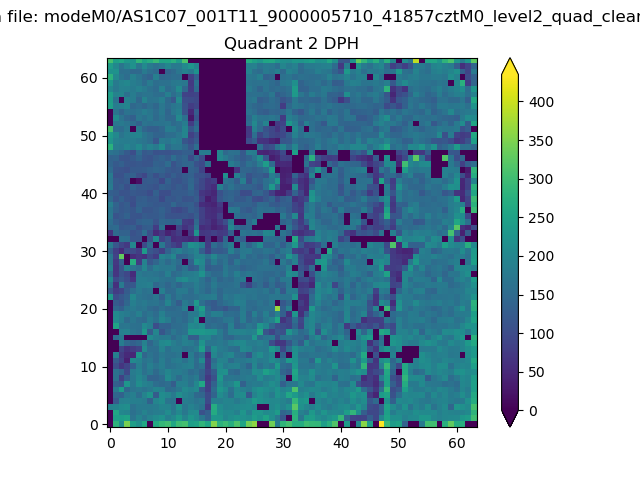 |
Quadrant C |
| Plot type | Count rate plots | Images |
|---|---|---|
| Comparison with Poisson distribution Blue bars denote a histogram of data divided into 1 sec bins. Red curve is a Poisson curve with rate = median count rate of data. |
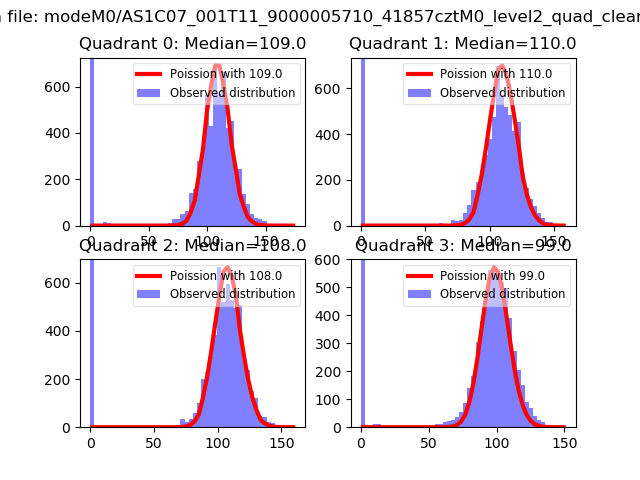 |
 |
| Quadrant-wise count rates Data is divided into 100 sec bins |
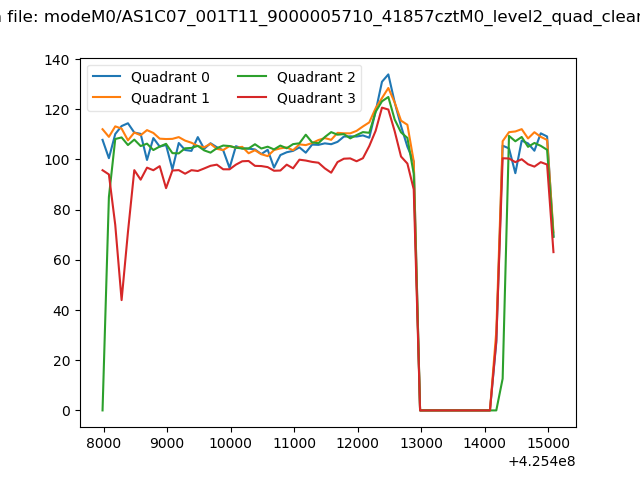 |
|
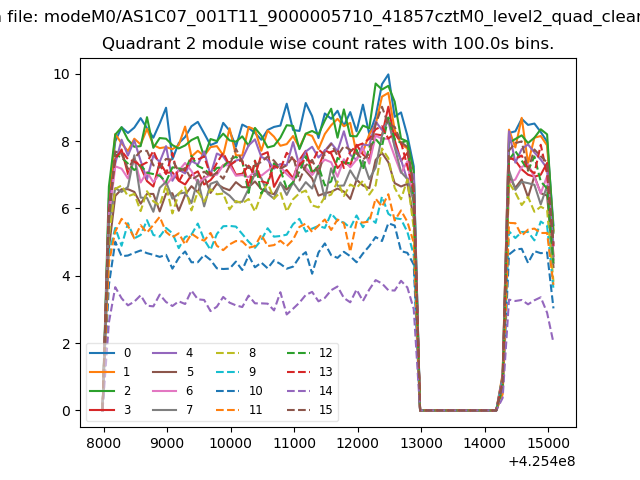
| Module-wise count rates for Quadrant A Data is divided into 100 sec bins |
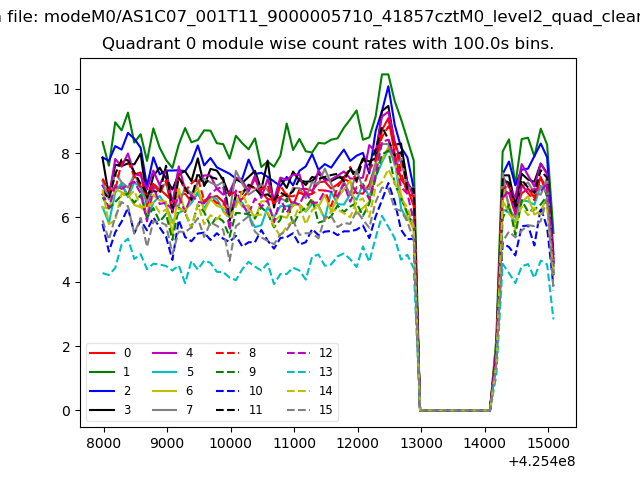 |
 |
| Module-wise count rates for Quadrant B Data is divided into 100 sec bins |
 |
 |
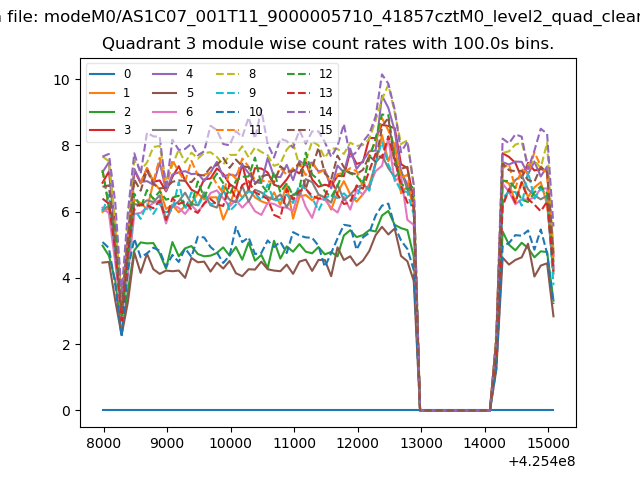
| Module-wise count rates for Quadrant C Data is divided into 100 sec bins |
 |
 |
| Module-wise count rates for Quadrant D Data is divided into 100 sec bins |
 |
 |
| Parameter | Plot |
|---|---|
| CZT HV Monitor | 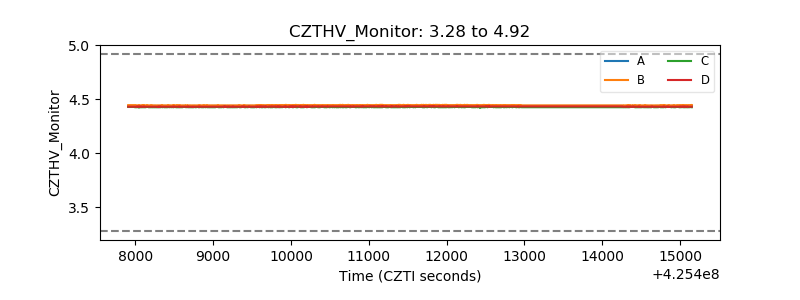 |
| D_VDD | 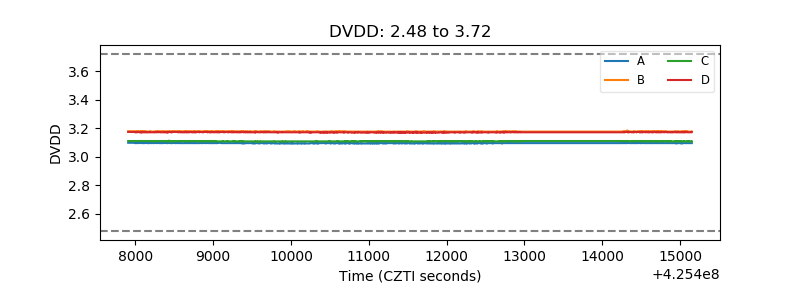 |
| Temperature 1 | 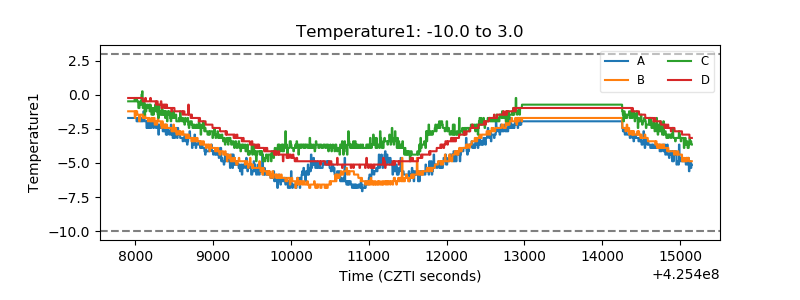 |
| Veto HV Monitor | 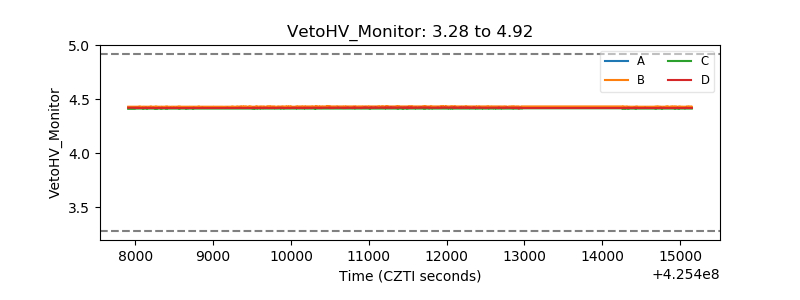 |
| Veto LLD | 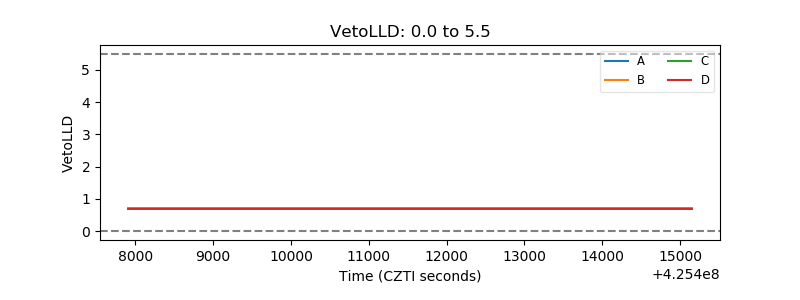 |
| Alpha Counter | 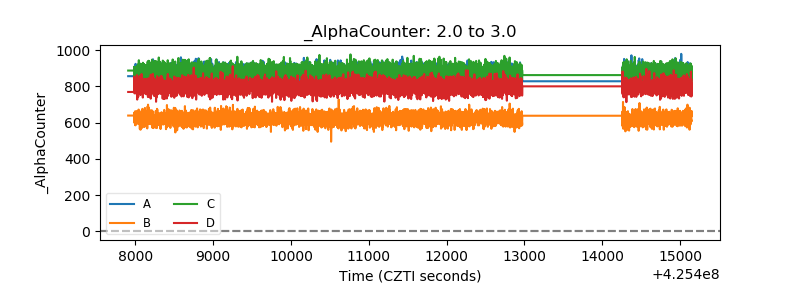 |
| _CPM_Rate | 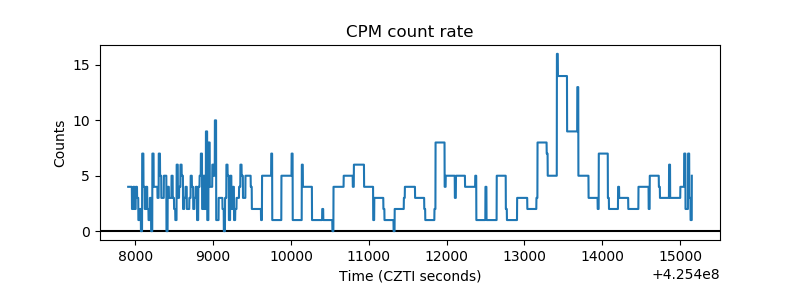 |
| CZT Counter | 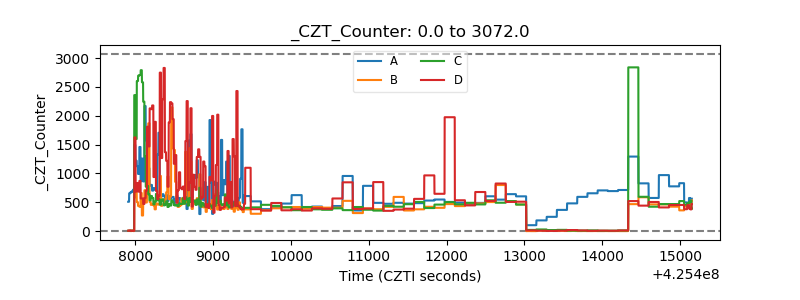 |
| +2.5 Volts monitor | 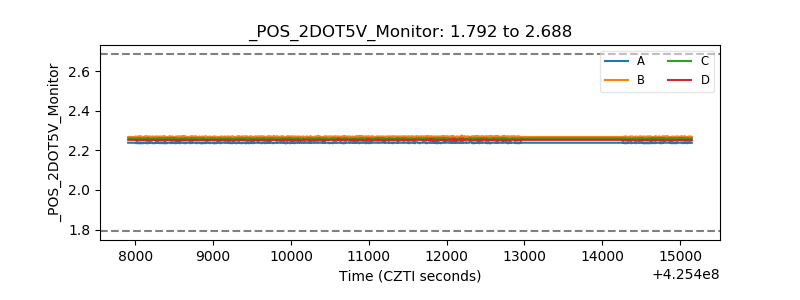 |
| +5 Volts monitor | 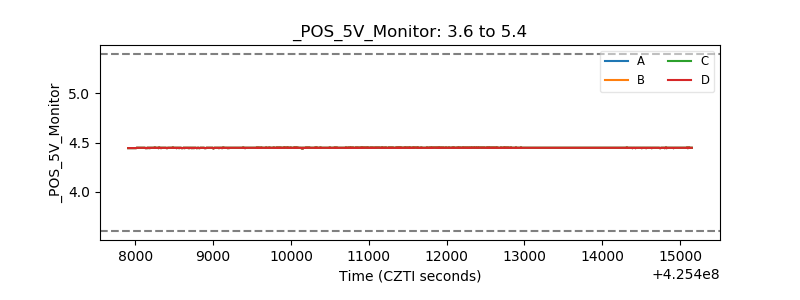 |
| _ROLL_ROT | 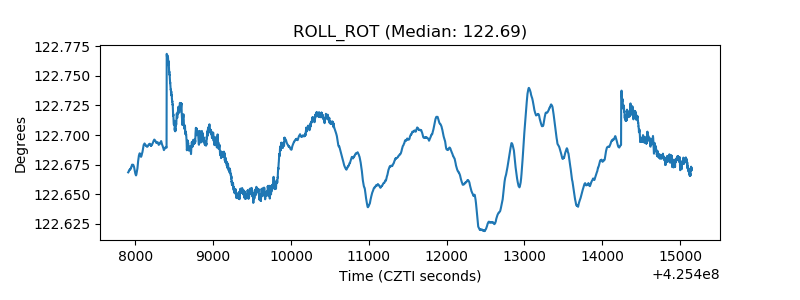 |
| _Roll_DEC | 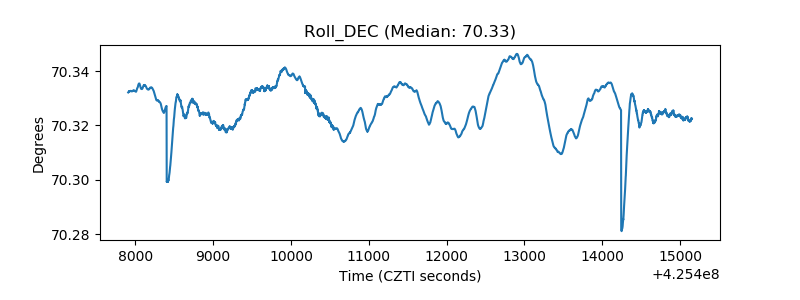 |
| _Roll_RA | 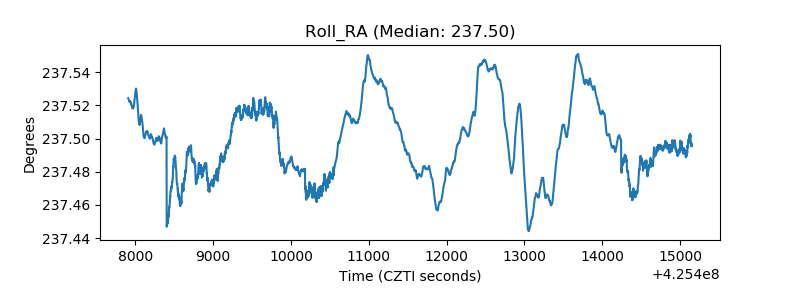 |
| Veto Counter | 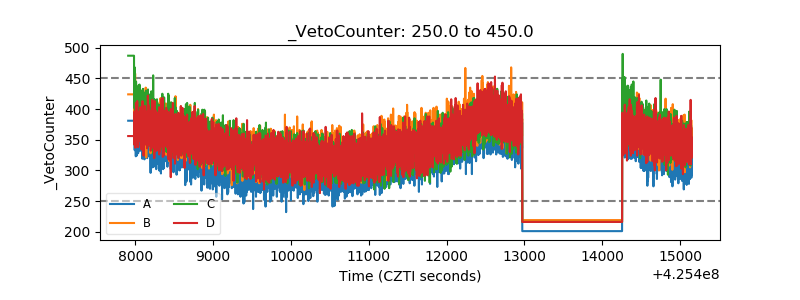 |