| Param | Original file | Final file |
|---|---|---|
| Filename | modeM0/AS1C07_001T11_9000005710_41859cztM0_level2.fits | modeM0/AS1C07_001T11_9000005710_41859cztM0_level2_quad_clean.evt |
| Size (bytes) | 716,261,760 | 167,837,760 |
| Size | 683.1 MB | 160.1 MB |
| Events in quadrant A | 8,240,326 | 1,100,700 |
| Events in quadrant B | 4,695,150 | 1,149,042 |
| Events in quadrant C | 5,692,820 | 1,100,338 |
| Events in quadrant D | 7,057,455 | 992,521 |
| Mode SS | |||
|---|---|---|---|
| Quadrant | BADHDUFLAG | Total packets | Discarded packets |
| A | 0 | 216 | 0 |
| B | 0 | 216 | 0 |
| C | 0 | 216 | 0 |
| D | 0 | 216 | 0 |
| Mode M0 | |||
|---|---|---|---|
| Quadrant | BADHDUFLAG | Total packets | Discarded packets |
| A | 0 | 31765 | 3 |
| B | 0 | 21930 | 3 |
| C | 0 | 24009 | 3 |
| D | 0 | 28866 | 4 |
| Mode M9 | |||
|---|---|---|---|
| Quadrant | BADHDUFLAG | Total packets | Discarded packets |
| A | 0 | 32 | 0 |
| B | 0 | 32 | 0 |
| C | 0 | 33 | 0 |
| D | 0 | 33 | 0 |
| Quadrant | Total seconds | Saturated seconds | Saturation percentage |
|---|---|---|---|
| A | 10676 | 470 | 4.402398% |
| B | 10676 | 31 | 0.290371% |
| C | 10676 | 353 | 3.306482% |
| D | 10675 | 651 | 6.098361% |
Noise dominated data is calculated using 1-second bins in cleaned event files. If a bin has >2000 counts, and if more than 50% of those come from <1% of pixels, then it is considered to be noise-dominated and hence unusable.
| Quadrant | # 1 sec bins | Bins with >0 counts | Bins with >2000 counts | High rate bins dominated by noise | Noise dominated (total time) | Noise dominated (detector-on time) | Marked lightcurve |
|---|---|---|---|---|---|---|---|
| A | 13452 | 10678 | 326 | 326 | 2.42% | 3.05% | 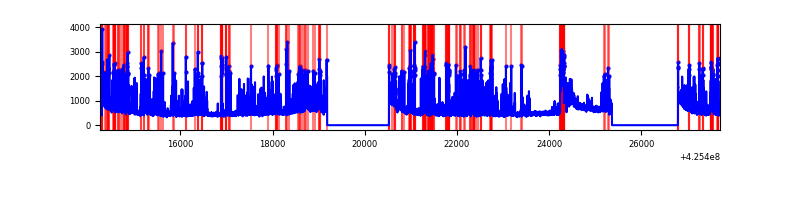 |
| B | 13452 | 10678 | 14 | 14 | 0.10% | 0.13% | 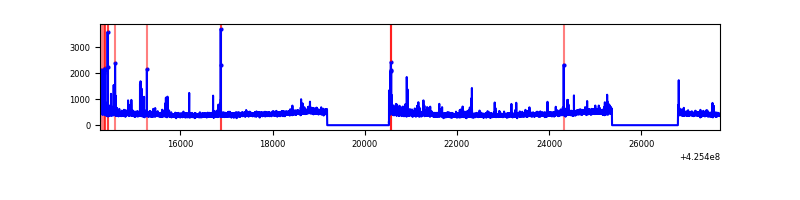 |
| C | 13452 | 10678 | 338 | 338 | 2.51% | 3.17% | 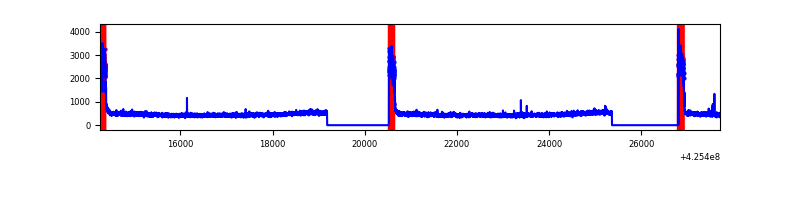 |
| D | 13451 | 10677 | 546 | 546 | 4.06% | 5.11% | 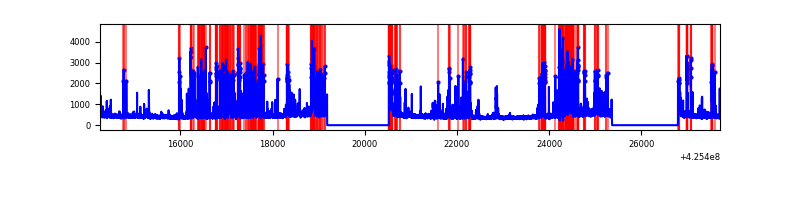 |
Top three noisy pixels from each quadrant. If the there are fewer than three noisy pixels in the level2.evt file, extra rows are filled as -1
| Pixel properties | Quadrant properties | ||||||
|---|---|---|---|---|---|---|---|
| Quadrant | DetID | PixID | Counts | Sigma | Mean | Median | Sigma |
| A | 14 | 24 | 2786843 | 12223.46 | 1115 | 1092 | 227.9 |
| A | 10 | 83 | 983819 | 4312.06 | 1115 | 1092 | 227.9 |
| A | 2 | 79 | 153511 | 668.79 | 1115 | 1092 | 227.9 |
| B | 0 | 245 | 89834 | 415.84 | 1123 | 1090 | 213.4 |
| B | 15 | 85 | 39386 | 179.45 | 1123 | 1090 | 213.4 |
| B | 5 | 32 | 36179 | 164.42 | 1123 | 1090 | 213.4 |
| C | 0 | 10 | 1032355 | 4096.87 | 1085 | 1090 | 251.7 |
| C | 15 | 214 | 414821 | 1643.61 | 1085 | 1090 | 251.7 |
| C | 15 | 111 | 10250 | 36.39 | 1085 | 1090 | 251.7 |
| D | 13 | 249 | 1711173 | 6459.85 | 1084 | 1052 | 264.7 |
| D | 2 | 249 | 459016 | 1729.92 | 1084 | 1052 | 264.7 |
| D | 12 | 218 | 295486 | 1112.2 | 1084 | 1052 | 264.7 |
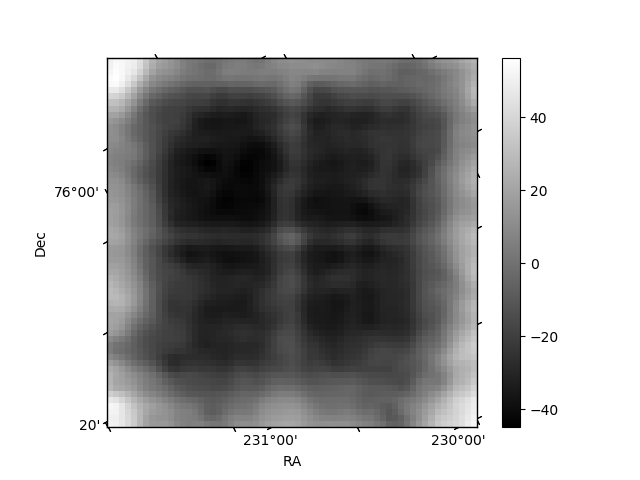
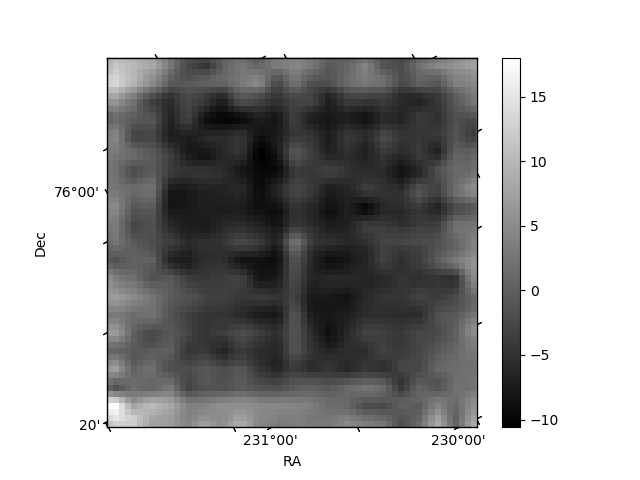
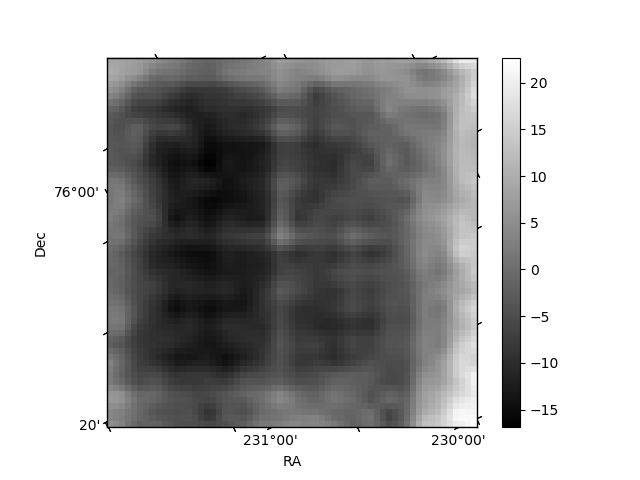
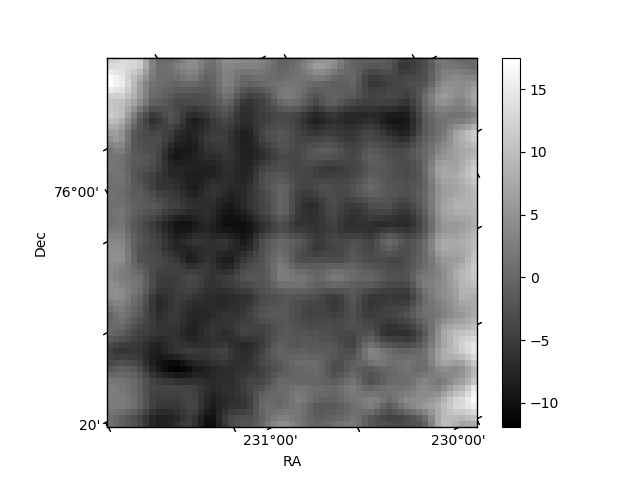
Histogram calculated using DETX and DETY for each event in the final _common_clean file
| Quadrant A | 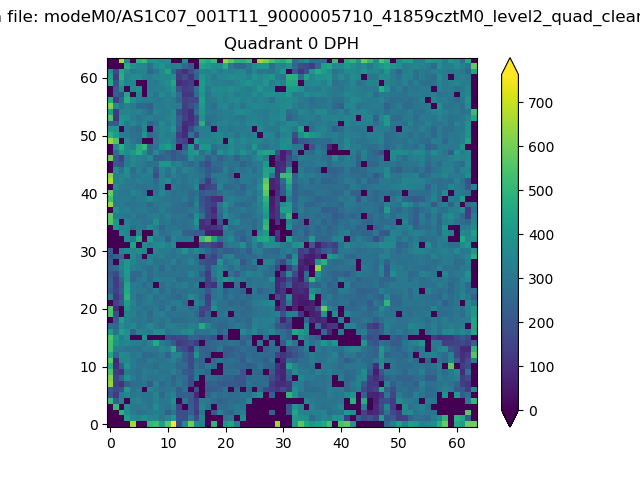 |
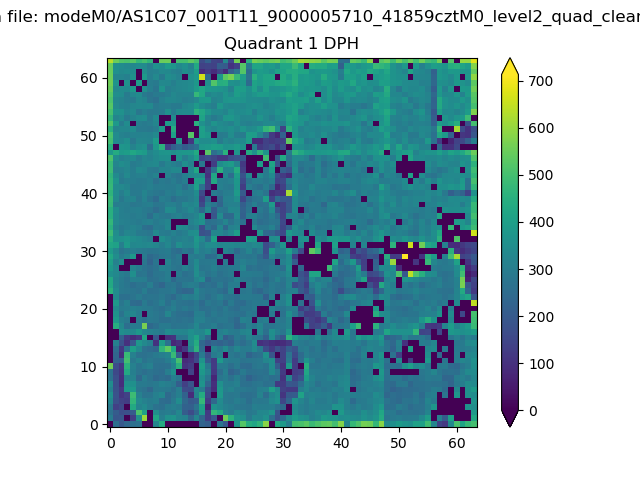 |
Quadrant B |
|---|---|---|---|
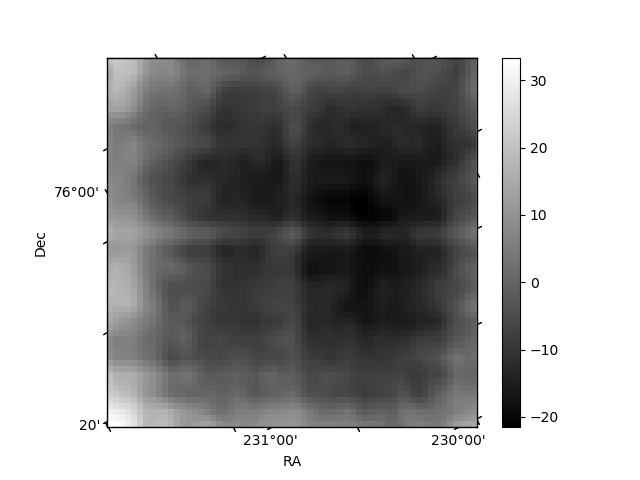
| Quadrant D | 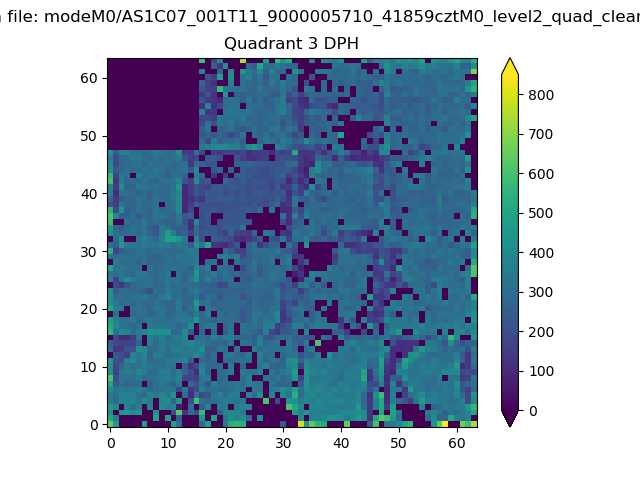 |
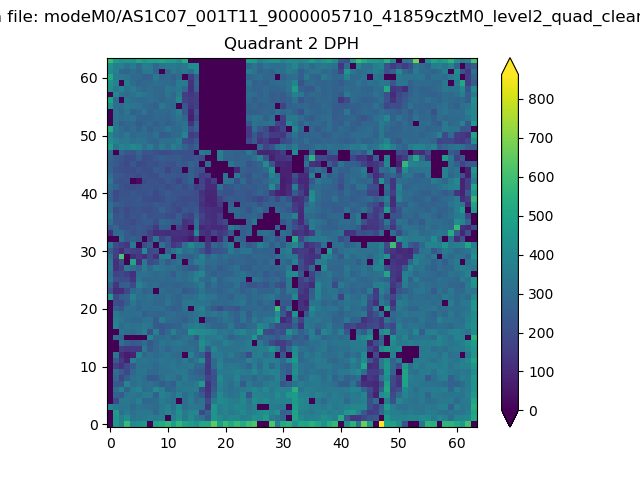 |
Quadrant C |
| Plot type | Count rate plots | Images |
|---|---|---|
| Comparison with Poisson distribution Blue bars denote a histogram of data divided into 1 sec bins. Red curve is a Poisson curve with rate = median count rate of data. |
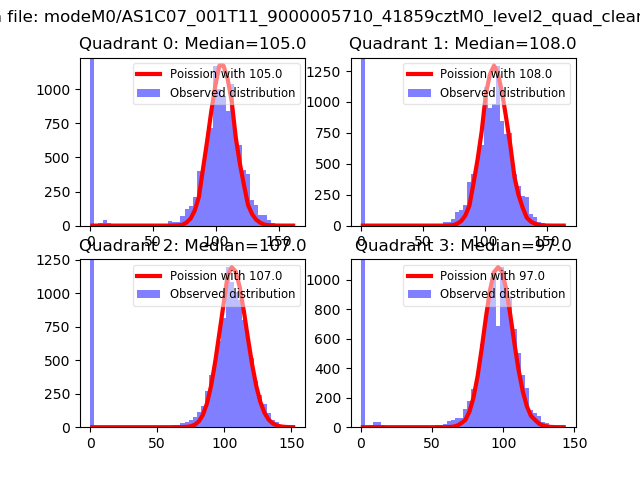 |
 |
| Quadrant-wise count rates Data is divided into 100 sec bins |
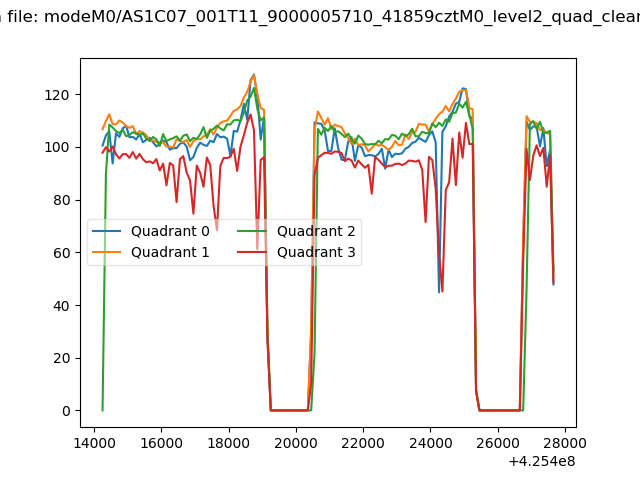 |
|
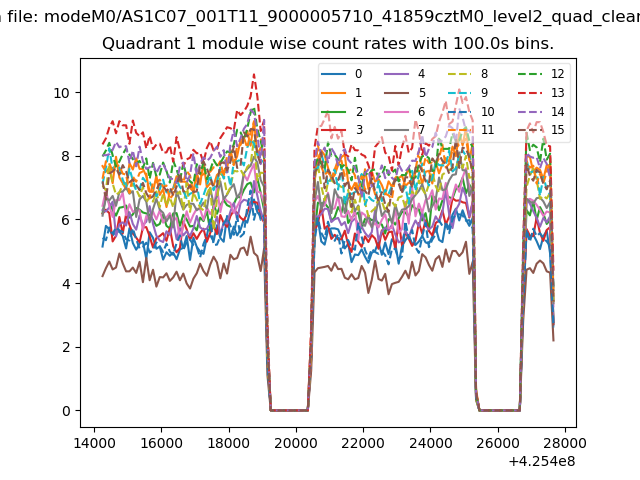
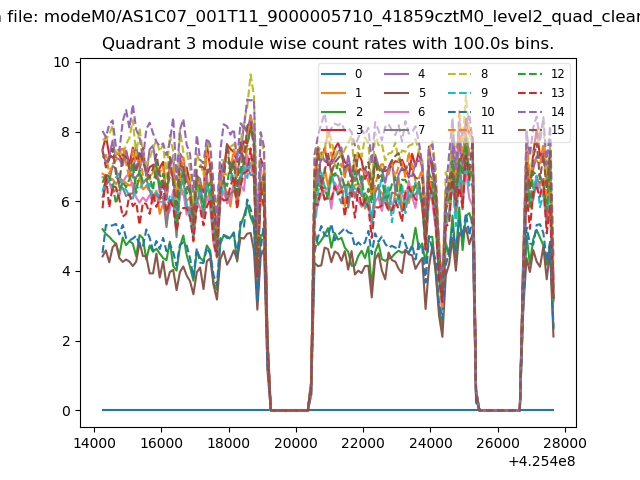
| Module-wise count rates for Quadrant A Data is divided into 100 sec bins |
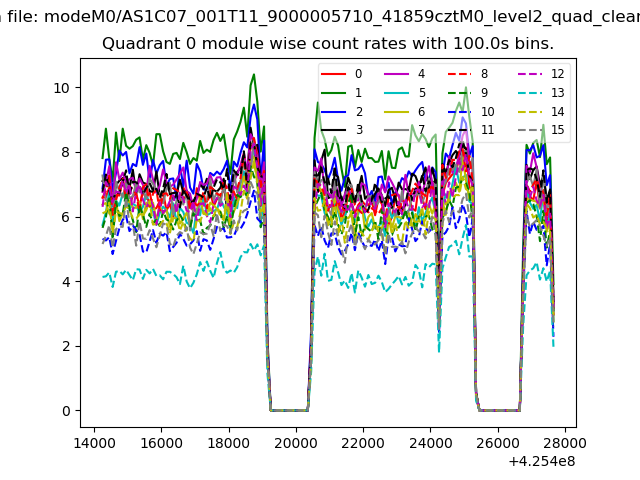 |
 |
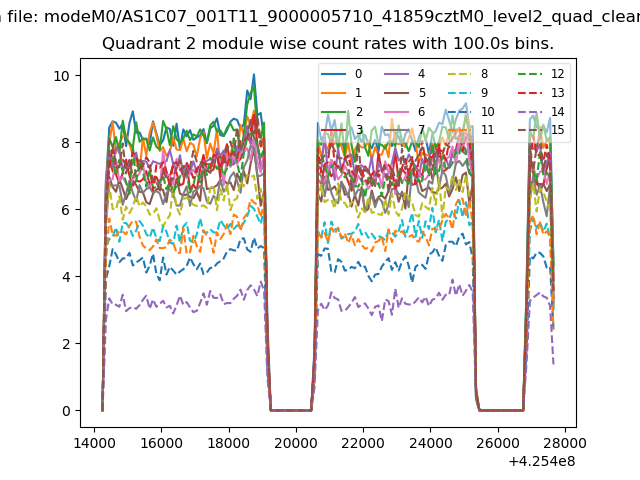
| Module-wise count rates for Quadrant B Data is divided into 100 sec bins |
 |
 |
| Module-wise count rates for Quadrant C Data is divided into 100 sec bins |
 |
 |
| Module-wise count rates for Quadrant D Data is divided into 100 sec bins |
 |
 |
| Parameter | Plot |
|---|---|
| CZT HV Monitor | 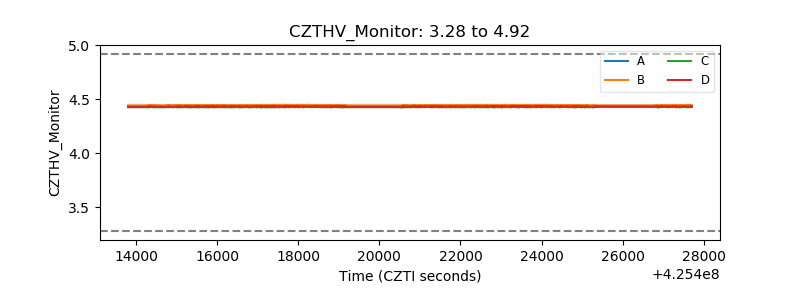 |
| D_VDD | 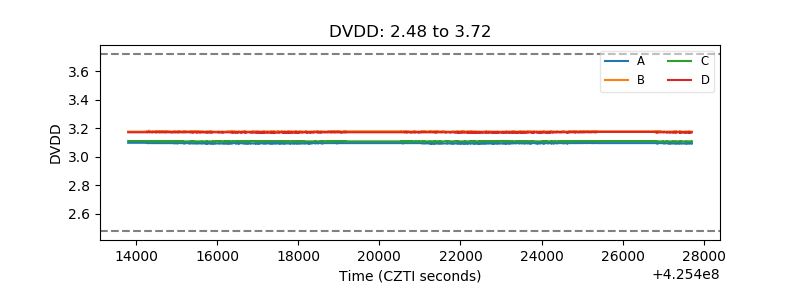 |
| Temperature 1 | 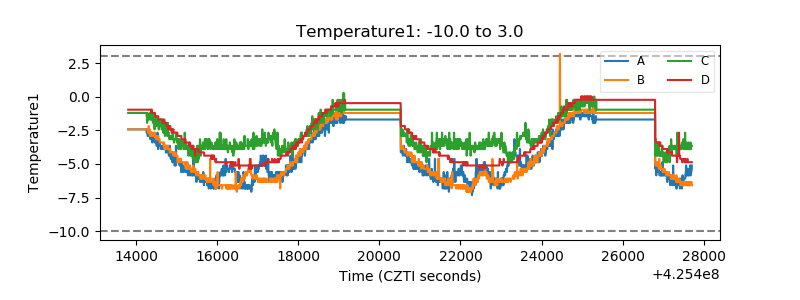 |
| Veto HV Monitor | 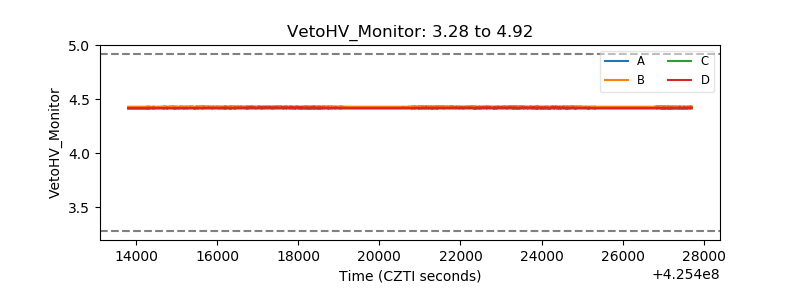 |
| Veto LLD | 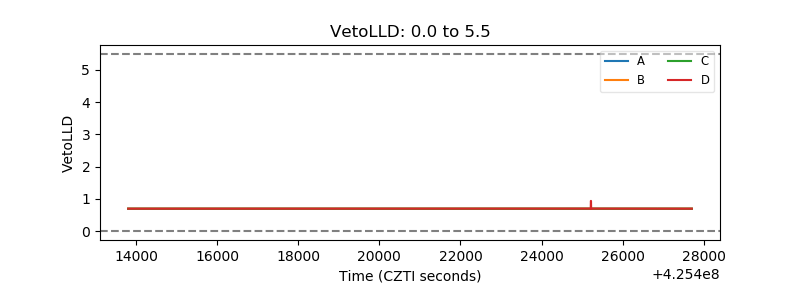 |
| Alpha Counter | 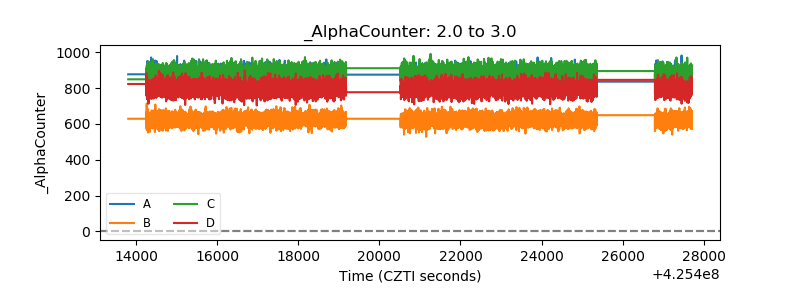 |
| _CPM_Rate | 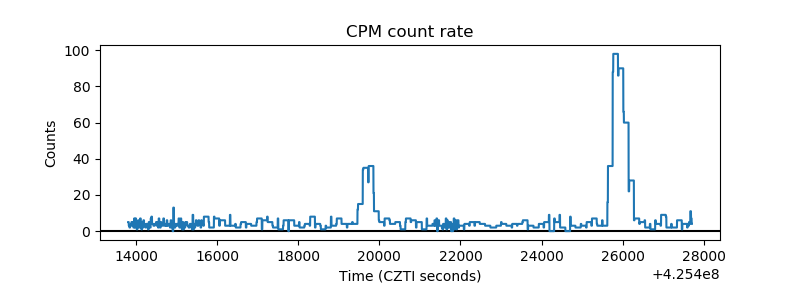 |
| CZT Counter | 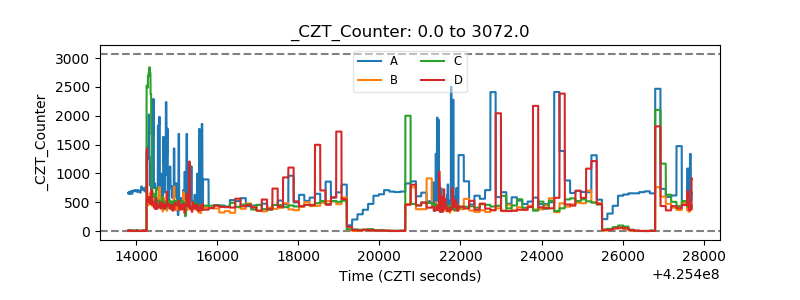 |
| +2.5 Volts monitor | 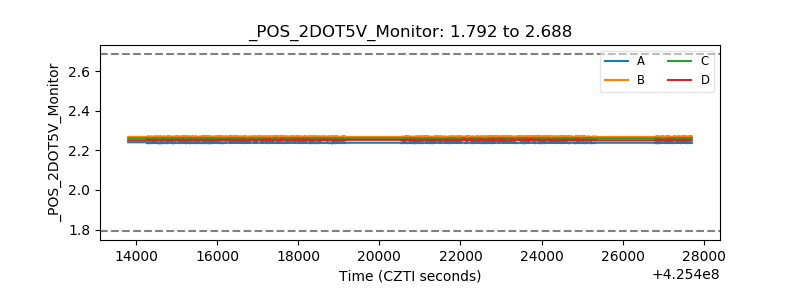 |
| +5 Volts monitor | 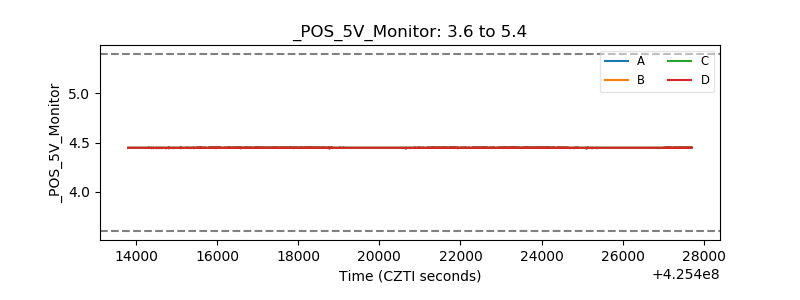 |
| _ROLL_ROT |  |
| _Roll_DEC | 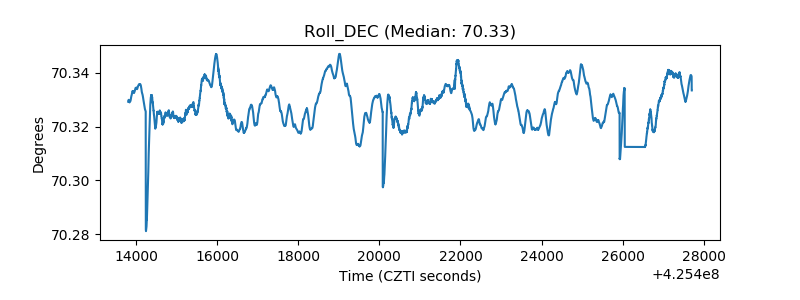 |
| _Roll_RA | 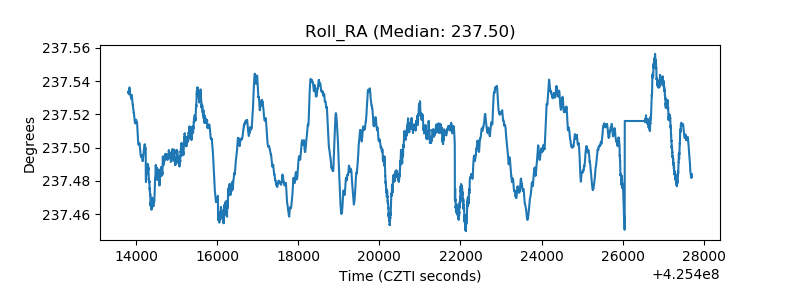 |
| Veto Counter | 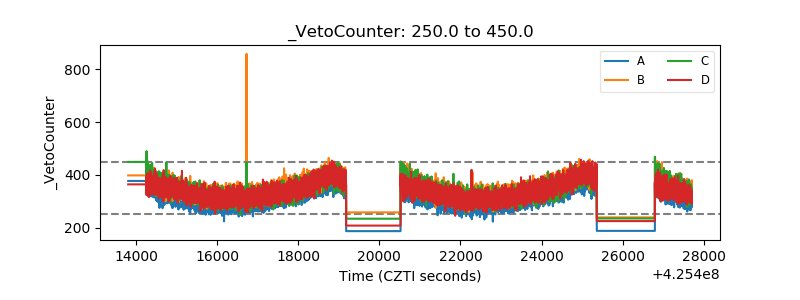 |