| Param | Original file | Final file |
|---|---|---|
| Filename | modeM0/AS1C07_001T11_9000005710_41860cztM0_level2.fits | modeM0/AS1C07_001T11_9000005710_41860cztM0_level2_quad_clean.evt |
| Size (bytes) | 409,040,640 | 88,548,480 |
| Size | 390.1 MB | 84.4 MB |
| Events in quadrant A | 4,889,039 | 571,869 |
| Events in quadrant B | 2,461,799 | 614,108 |
| Events in quadrant C | 3,271,169 | 579,657 |
| Events in quadrant D | 4,076,987 | 517,316 |
| Mode SS | |||
|---|---|---|---|
| Quadrant | BADHDUFLAG | Total packets | Discarded packets |
| A | 0 | 118 | 0 |
| B | 0 | 118 | 0 |
| C | 0 | 118 | 0 |
| D | 0 | 118 | 0 |
| Mode M0 | |||
|---|---|---|---|
| Quadrant | BADHDUFLAG | Total packets | Discarded packets |
| A | 0 | 18463 | 2 |
| B | 0 | 11623 | 2 |
| C | 0 | 13483 | 2 |
| D | 0 | 16377 | 2 |
| Mode M9 | |||
|---|---|---|---|
| Quadrant | BADHDUFLAG | Total packets | Discarded packets |
| A | 0 | 27 | 0 |
| B | 0 | 27 | 0 |
| C | 0 | 28 | 0 |
| D | 0 | 28 | 0 |
| Quadrant | Total seconds | Saturated seconds | Saturation percentage |
|---|---|---|---|
| A | 5684 | 437 | 7.688248% |
| B | 5684 | 18 | 0.316678% |
| C | 5684 | 257 | 4.521464% |
| D | 5684 | 472 | 8.304011% |
Noise dominated data is calculated using 1-second bins in cleaned event files. If a bin has >2000 counts, and if more than 50% of those come from <1% of pixels, then it is considered to be noise-dominated and hence unusable.
| Quadrant | # 1 sec bins | Bins with >0 counts | Bins with >2000 counts | High rate bins dominated by noise | Noise dominated (total time) | Noise dominated (detector-on time) | Marked lightcurve |
|---|---|---|---|---|---|---|---|
| A | 7236 | 5685 | 275 | 275 | 3.80% | 4.84% | 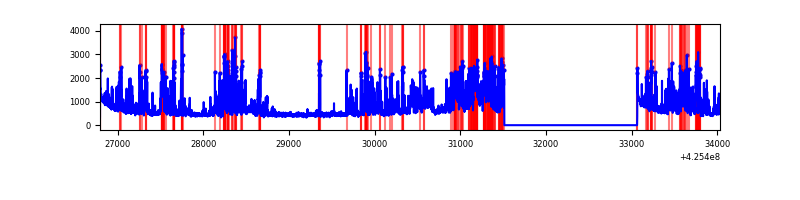 |
| B | 7236 | 5685 | 7 | 7 | 0.10% | 0.12% | 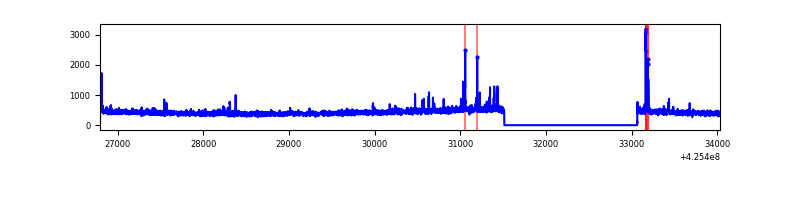 |
| C | 7236 | 5685 | 255 | 255 | 3.52% | 4.49% | 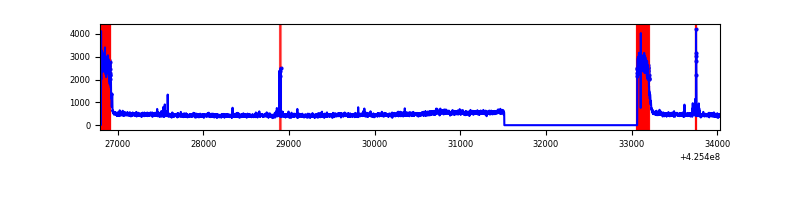 |
| D | 7236 | 5685 | 470 | 470 | 6.50% | 8.27% | 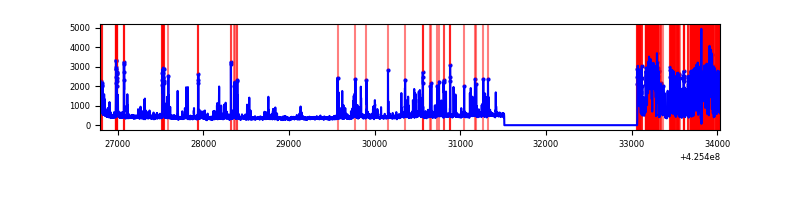 |
Top three noisy pixels from each quadrant. If the there are fewer than three noisy pixels in the level2.evt file, extra rows are filled as -1
| Pixel properties | Quadrant properties | ||||||
|---|---|---|---|---|---|---|---|
| Quadrant | DetID | PixID | Counts | Sigma | Mean | Median | Sigma |
| A | 14 | 24 | 2054801 | 17113.24 | 584 | 571 | 120.0 |
| A | 10 | 83 | 550502 | 4581.33 | 584 | 571 | 120.0 |
| A | 2 | 79 | 19648 | 158.93 | 584 | 571 | 120.0 |
| B | 5 | 255 | 34206 | 291.13 | 595 | 578 | 115.5 |
| B | 0 | 245 | 33901 | 288.49 | 595 | 578 | 115.5 |
| B | 12 | 111 | 14696 | 122.23 | 595 | 578 | 115.5 |
| C | 0 | 10 | 781394 | 5925.42 | 569 | 571 | 131.8 |
| C | 15 | 214 | 223925 | 1694.96 | 569 | 571 | 131.8 |
| C | 15 | 111 | 45122 | 338.08 | 569 | 571 | 131.8 |
| D | 12 | 79 | 1194602 | 8489.89 | 568 | 551 | 140.6 |
| D | 13 | 249 | 330675 | 2347.23 | 568 | 551 | 140.6 |
| D | 2 | 249 | 102712 | 726.38 | 568 | 551 | 140.6 |
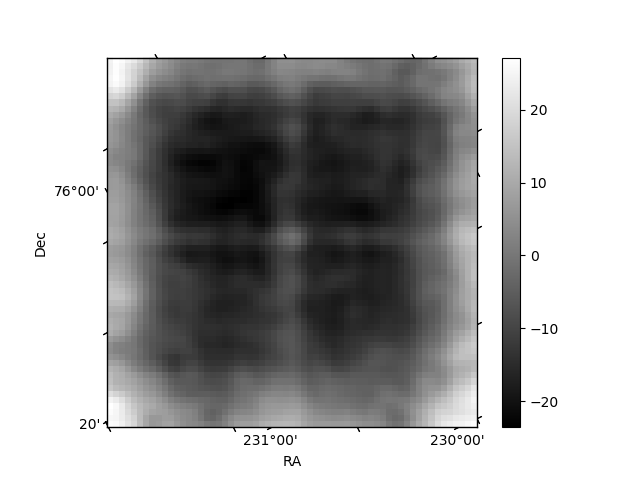
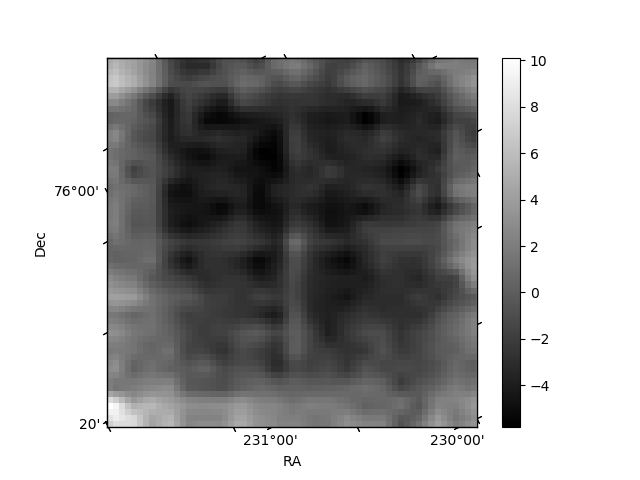
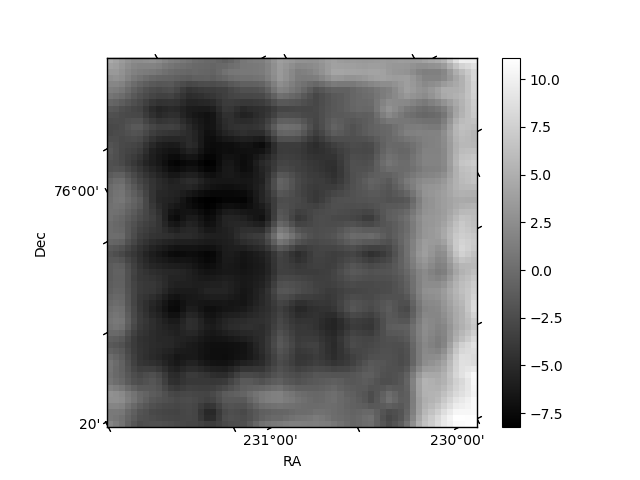
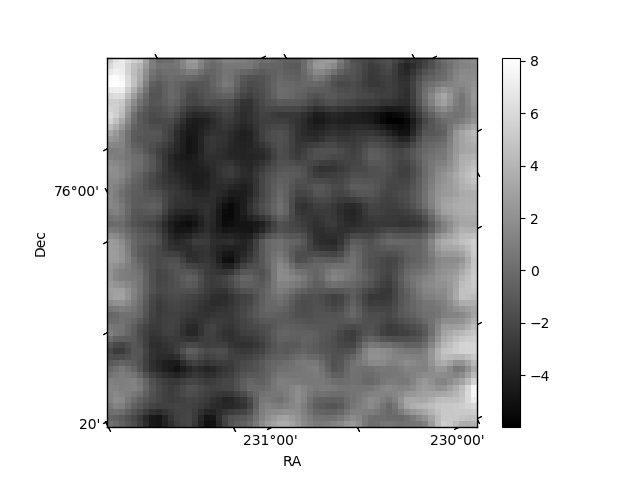
Histogram calculated using DETX and DETY for each event in the final _common_clean file
| Quadrant A | 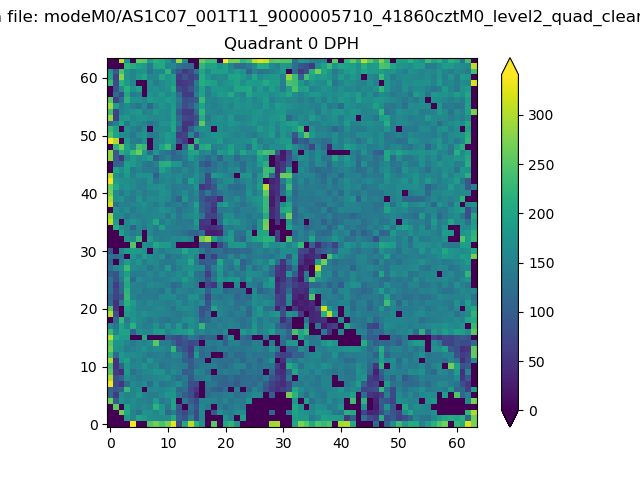 |
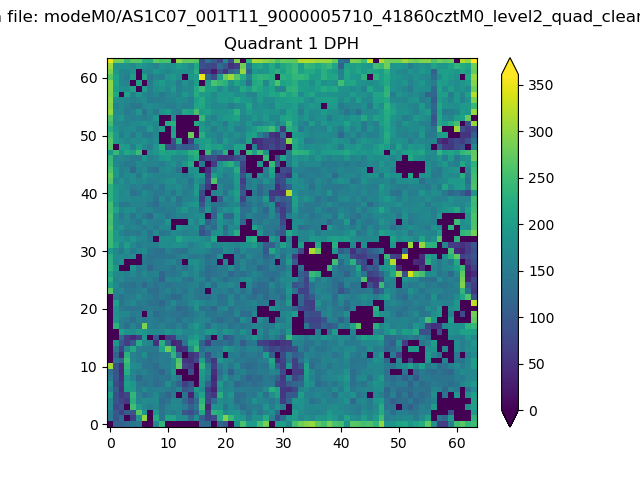 |
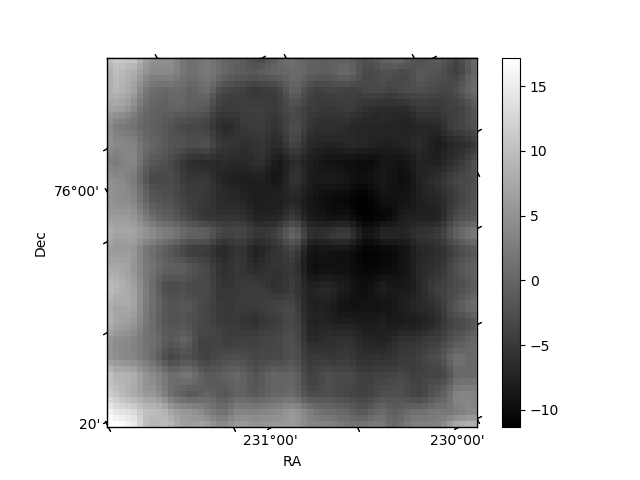
Quadrant B |
|---|---|---|---|
| Quadrant D | 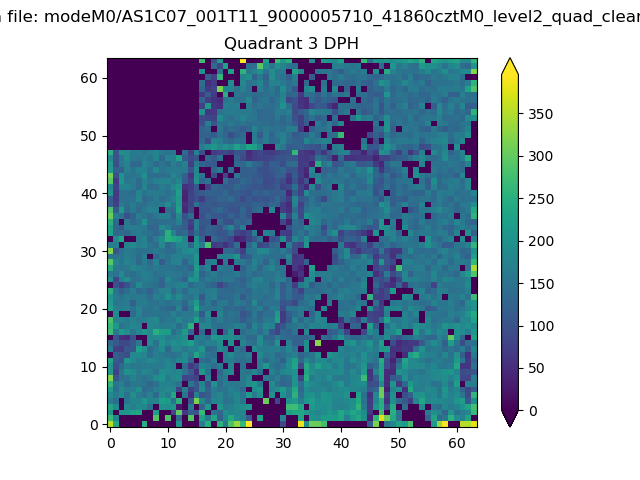 |
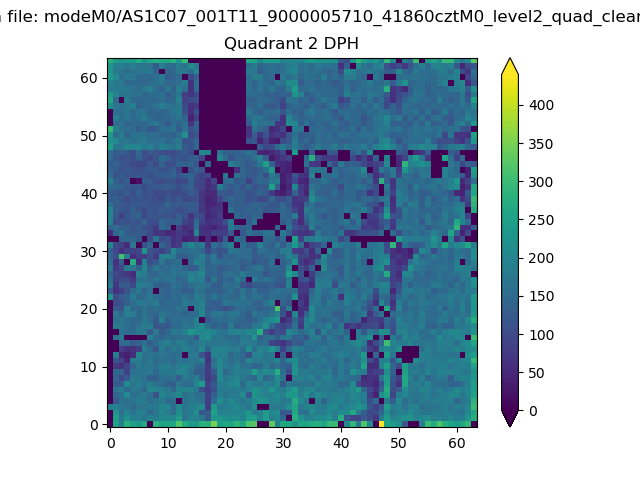 |
Quadrant C |
| Plot type | Count rate plots | Images |
|---|---|---|
| Comparison with Poisson distribution Blue bars denote a histogram of data divided into 1 sec bins. Red curve is a Poisson curve with rate = median count rate of data. |
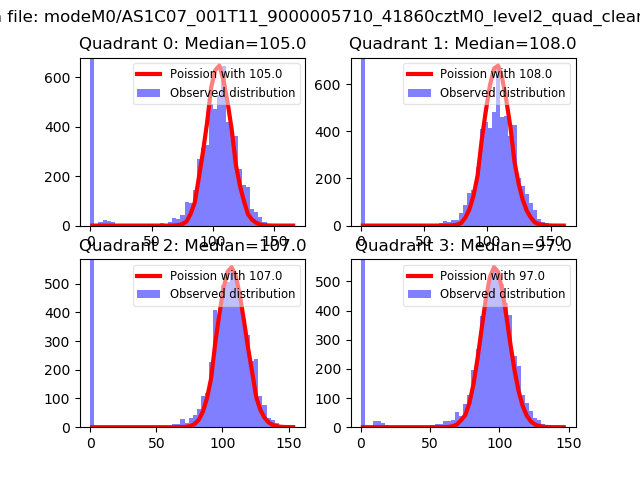 |
 |
| Quadrant-wise count rates Data is divided into 100 sec bins |
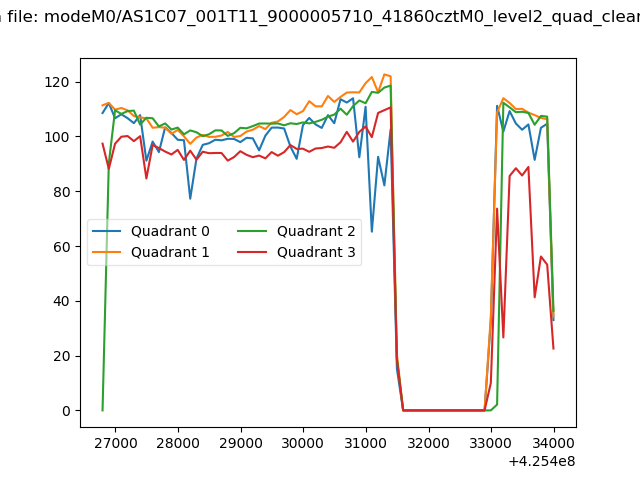 |
|
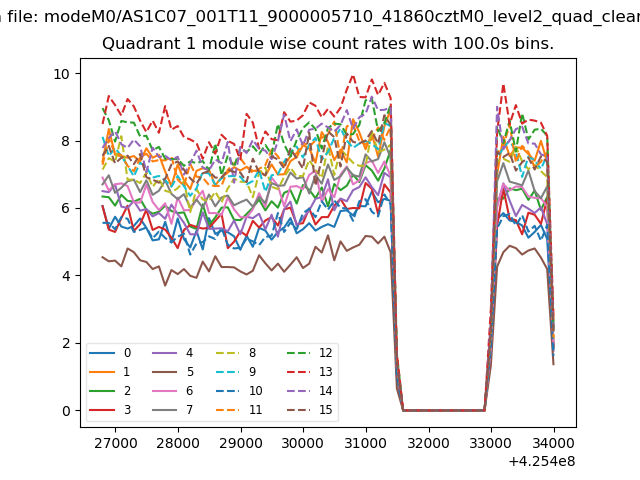
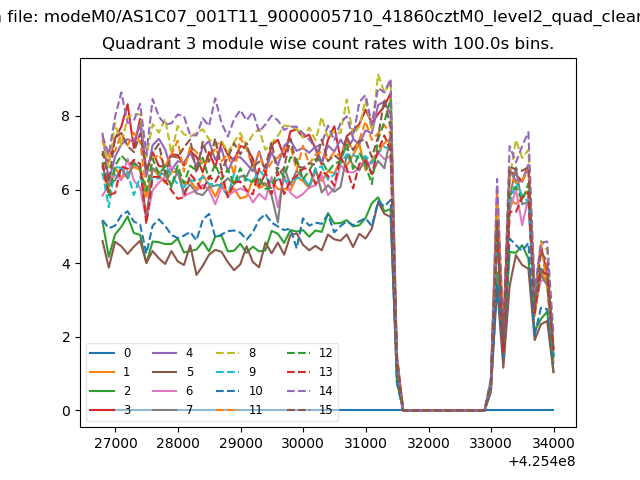
| Module-wise count rates for Quadrant A Data is divided into 100 sec bins |
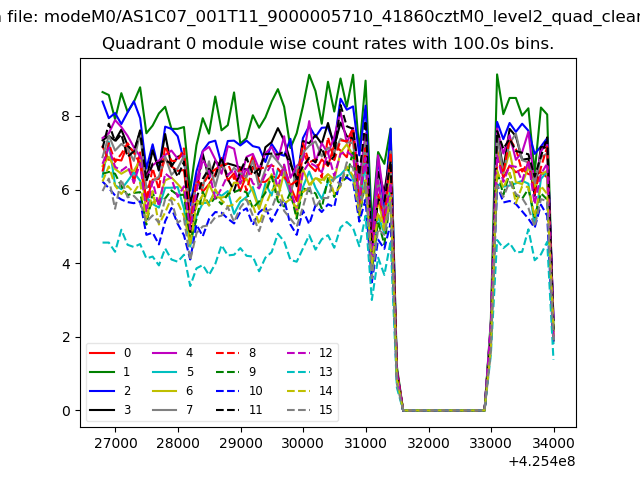 |
 |
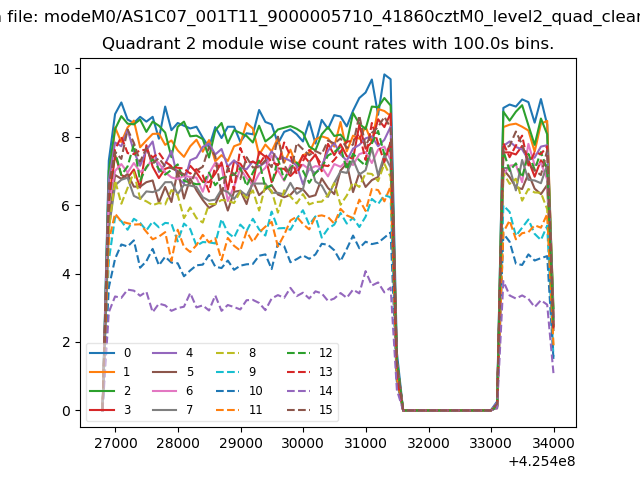
| Module-wise count rates for Quadrant B Data is divided into 100 sec bins |
 |
 |
| Module-wise count rates for Quadrant C Data is divided into 100 sec bins |
 |
 |
| Module-wise count rates for Quadrant D Data is divided into 100 sec bins |
 |
 |
| Parameter | Plot |
|---|---|
| CZT HV Monitor | 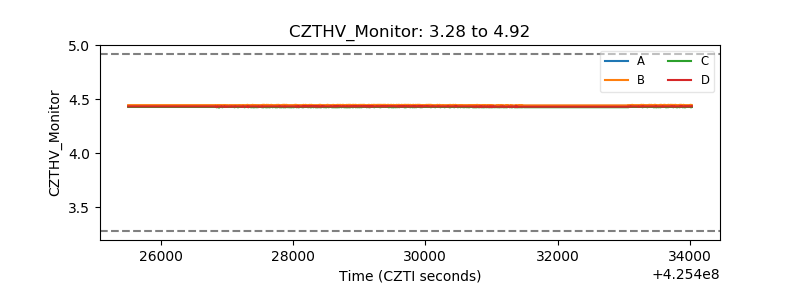 |
| D_VDD | 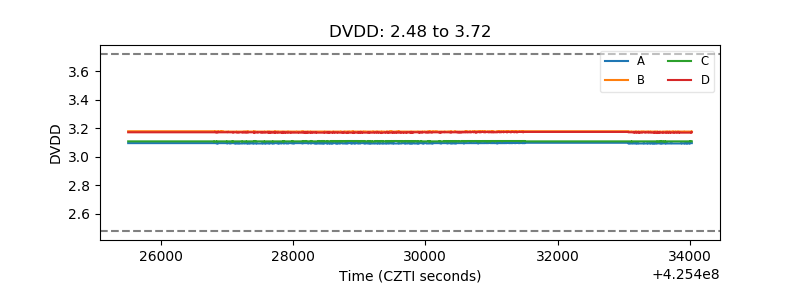 |
| Temperature 1 |  |
| Veto HV Monitor | 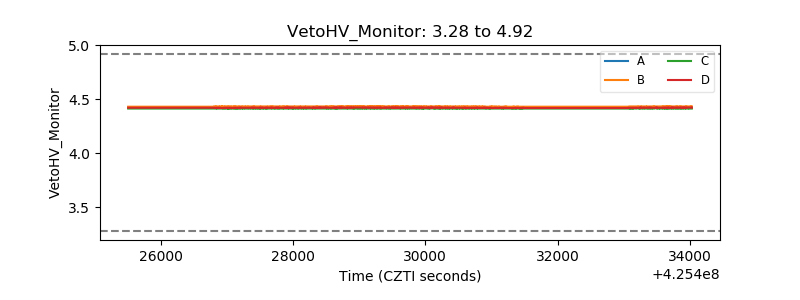 |
| Veto LLD | 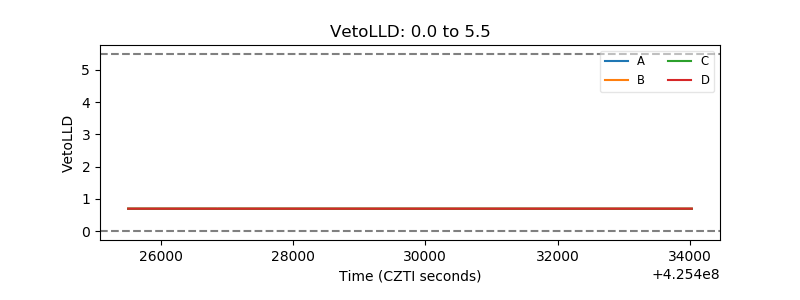 |
| Alpha Counter | 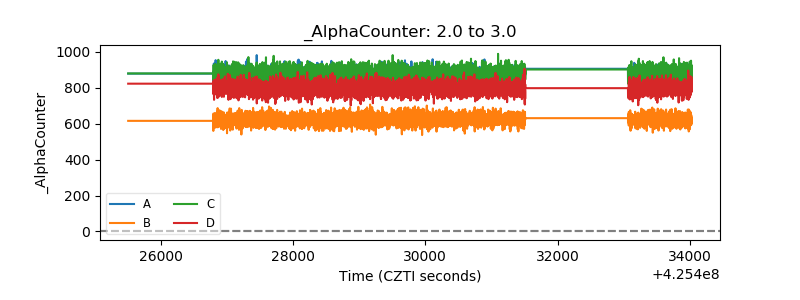 |
| _CPM_Rate | 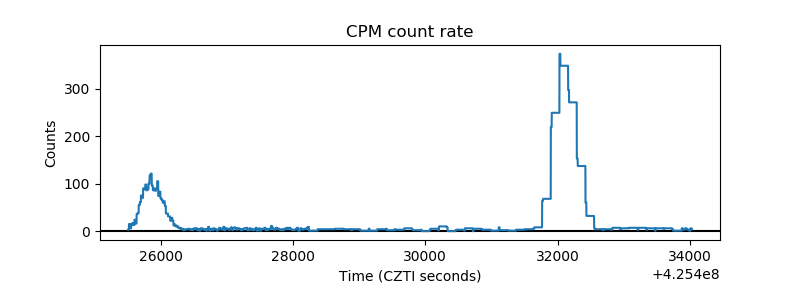 |
| CZT Counter | 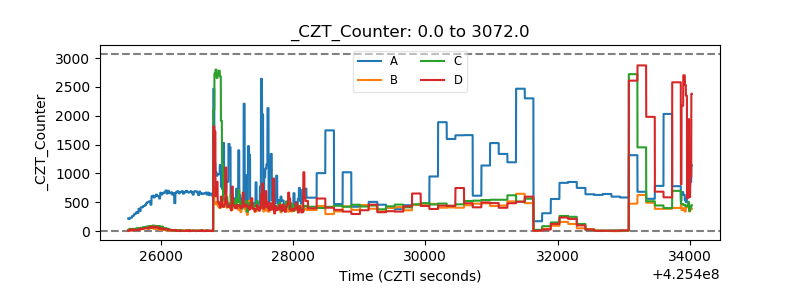 |
| +2.5 Volts monitor | 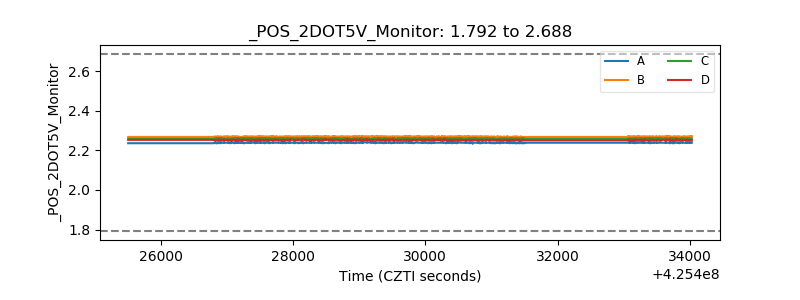 |
| +5 Volts monitor | 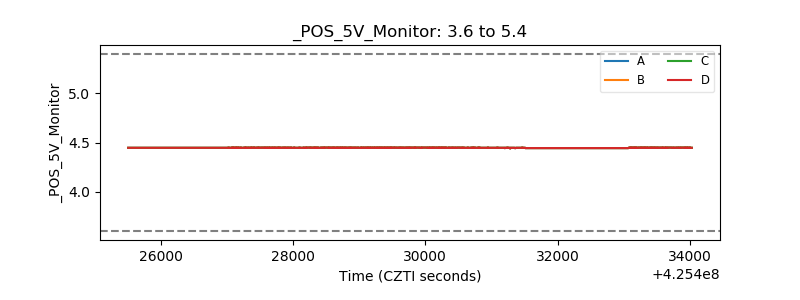 |
| _ROLL_ROT | 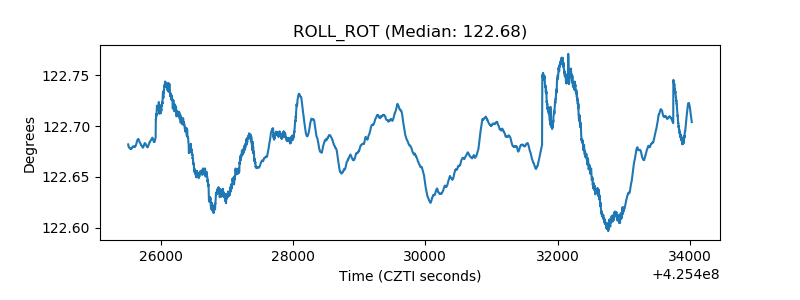 |
| _Roll_DEC | 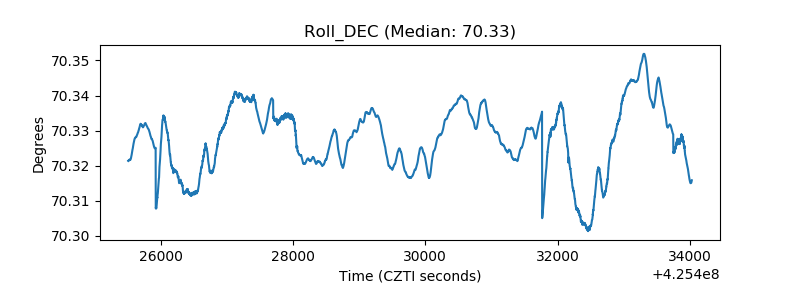 |
| _Roll_RA | 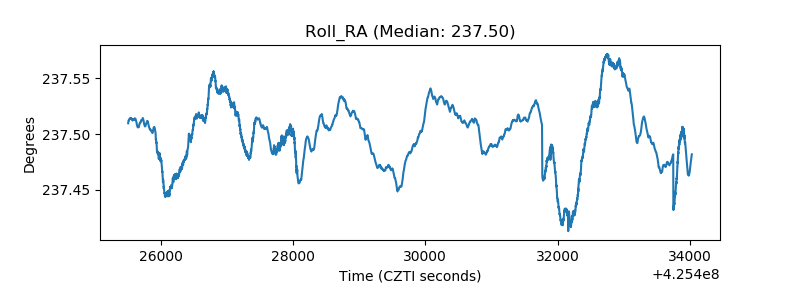 |
| Veto Counter | 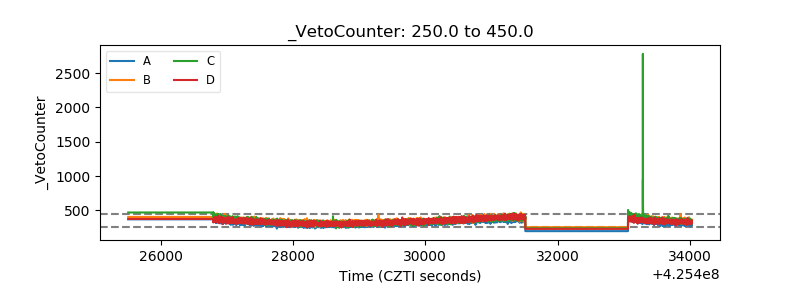 |