| Param | Original file | Final file |
|---|---|---|
| Filename | modeM0/AS1C07_001T11_9000005710_41861cztM0_level2.fits | modeM0/AS1C07_001T11_9000005710_41861cztM0_level2_quad_clean.evt |
| Size (bytes) | 450,406,080 | 85,288,320 |
| Size | 429.5 MB | 81.3 MB |
| Events in quadrant A | 4,353,026 | 563,819 |
| Events in quadrant B | 2,476,533 | 602,038 |
| Events in quadrant C | 3,105,586 | 563,143 |
| Events in quadrant D | 6,309,510 | 467,466 |
| Mode SS | |||
|---|---|---|---|
| Quadrant | BADHDUFLAG | Total packets | Discarded packets |
| A | 0 | 116 | 0 |
| B | 0 | 116 | 0 |
| C | 0 | 116 | 0 |
| D | 0 | 116 | 0 |
| Mode M0 | |||
|---|---|---|---|
| Quadrant | BADHDUFLAG | Total packets | Discarded packets |
| A | 0 | 16660 | 2 |
| B | 0 | 11491 | 2 |
| C | 0 | 12907 | 2 |
| D | 0 | 22563 | 2 |
| Mode M9 | |||
|---|---|---|---|
| Quadrant | BADHDUFLAG | Total packets | Discarded packets |
| A | 0 | 31 | 0 |
| B | 0 | 31 | 0 |
| C | 0 | 31 | 0 |
| D | 0 | 31 | 0 |
| Quadrant | Total seconds | Saturated seconds | Saturation percentage |
|---|---|---|---|
| A | 5506 | 328 | 5.957138% |
| B | 5506 | 24 | 0.435888% |
| C | 5507 | 249 | 4.521518% |
| D | 5507 | 953 | 17.305248% |
Noise dominated data is calculated using 1-second bins in cleaned event files. If a bin has >2000 counts, and if more than 50% of those come from <1% of pixels, then it is considered to be noise-dominated and hence unusable.
| Quadrant | # 1 sec bins | Bins with >0 counts | Bins with >2000 counts | High rate bins dominated by noise | Noise dominated (total time) | Noise dominated (detector-on time) | Marked lightcurve |
|---|---|---|---|---|---|---|---|
| A | 8731 | 5508 | 215 | 215 | 2.46% | 3.90% | 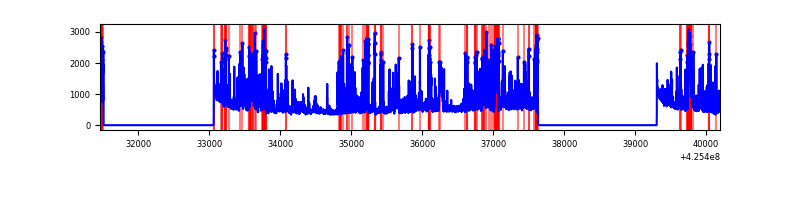 |
| B | 8731 | 5508 | 10 | 10 | 0.11% | 0.18% | 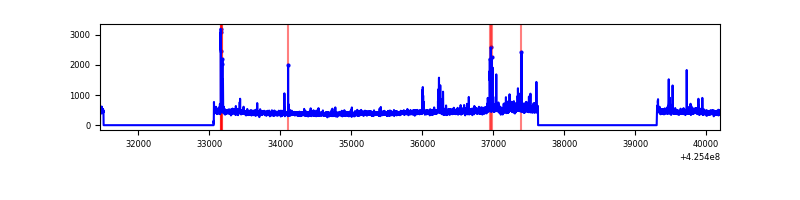 |
| C | 8732 | 5509 | 253 | 253 | 2.90% | 4.59% | 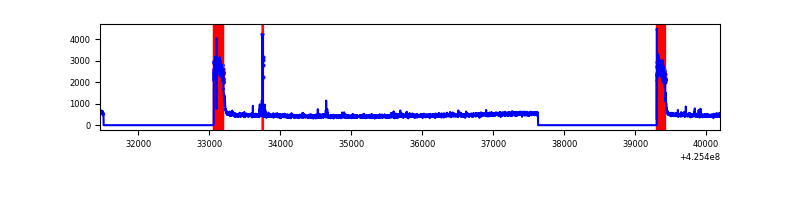 |
| D | 8732 | 5509 | 1010 | 1010 | 11.57% | 18.33% | 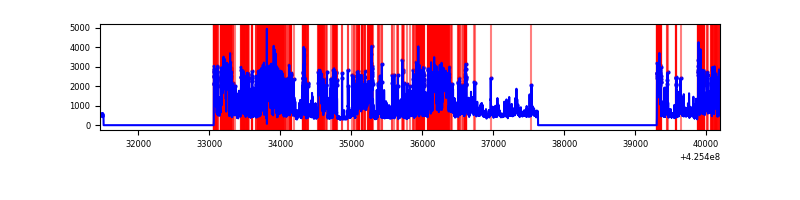 |
Top three noisy pixels from each quadrant. If the there are fewer than three noisy pixels in the level2.evt file, extra rows are filled as -1
| Pixel properties | Quadrant properties | ||||||
|---|---|---|---|---|---|---|---|
| Quadrant | DetID | PixID | Counts | Sigma | Mean | Median | Sigma |
| A | 14 | 24 | 1543955 | 13162.51 | 570 | 558 | 117.3 |
| A | 10 | 83 | 546442 | 4655.45 | 570 | 558 | 117.3 |
| A | 2 | 79 | 52602 | 443.85 | 570 | 558 | 117.3 |
| B | 0 | 245 | 48490 | 421.0 | 581 | 565 | 113.8 |
| B | 5 | 255 | 44399 | 385.06 | 581 | 565 | 113.8 |
| B | 5 | 32 | 36124 | 312.37 | 581 | 565 | 113.8 |
| C | 0 | 10 | 685356 | 5315.27 | 553 | 556 | 128.8 |
| C | 15 | 214 | 218613 | 1692.51 | 553 | 556 | 128.8 |
| C | 15 | 111 | 28654 | 218.09 | 553 | 556 | 128.8 |
| D | 12 | 79 | 2886591 | 22232.74 | 533 | 518 | 129.8 |
| D | 13 | 249 | 626165 | 4819.65 | 533 | 518 | 129.8 |
| D | 12 | 250 | 223698 | 1719.26 | 533 | 518 | 129.8 |
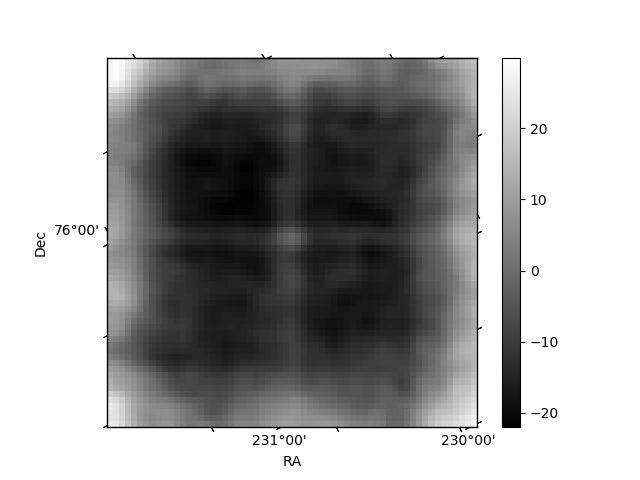
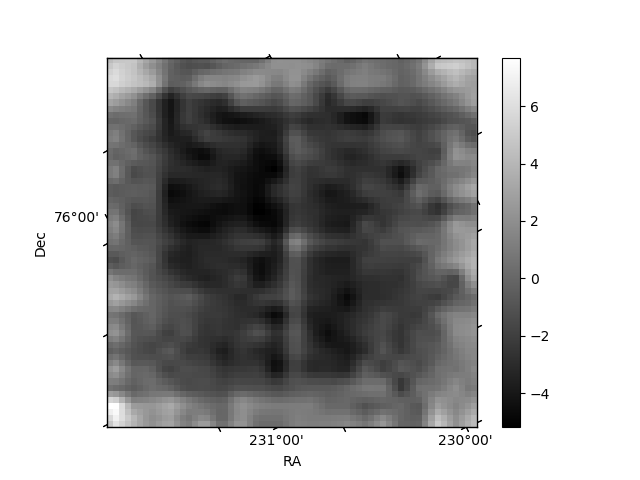
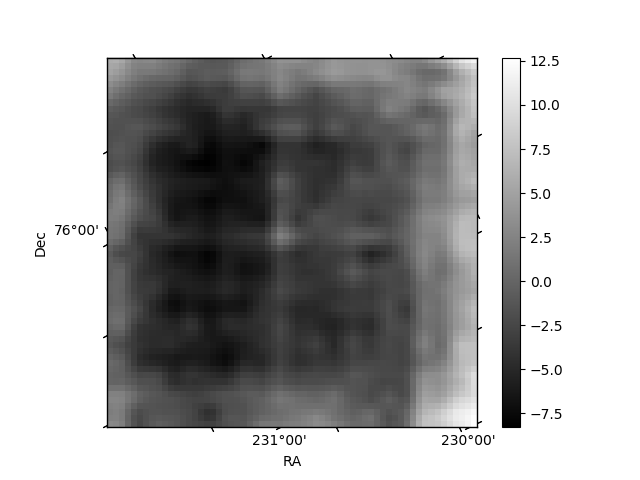
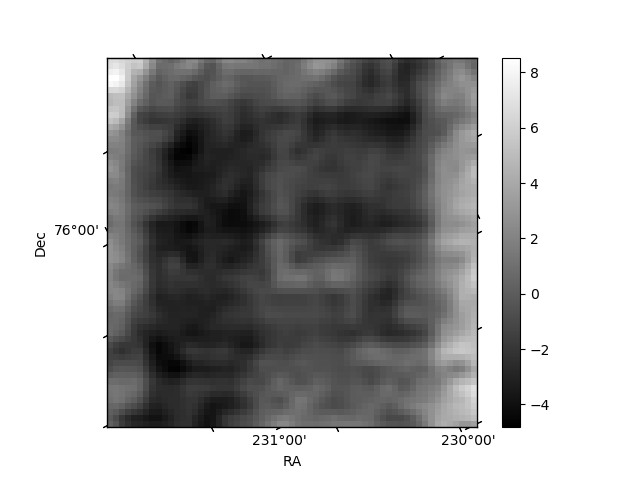
Histogram calculated using DETX and DETY for each event in the final _common_clean file
| Quadrant A | 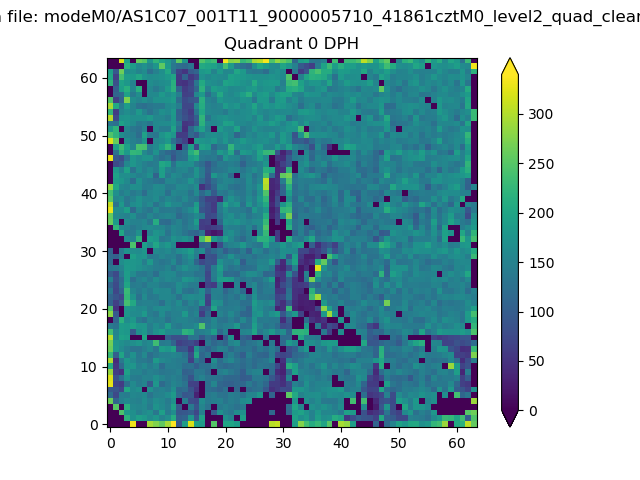 |
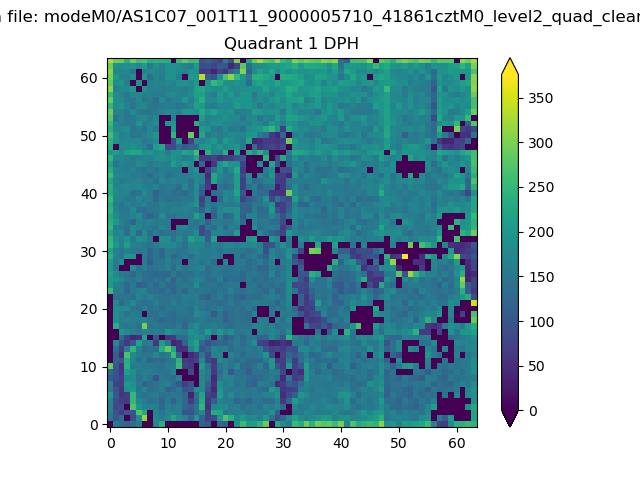 |
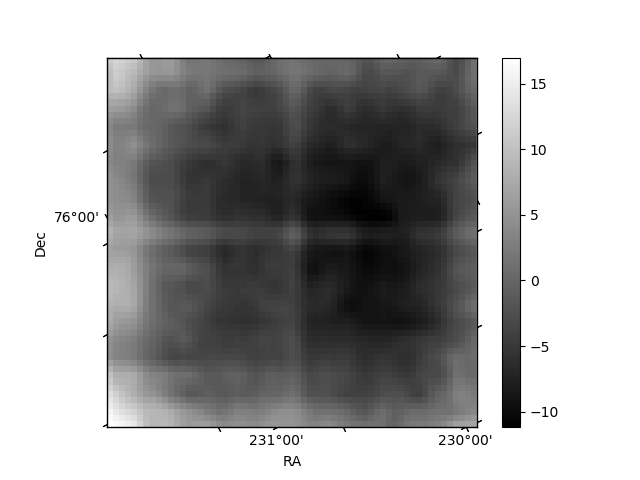
Quadrant B |
|---|---|---|---|
| Quadrant D | 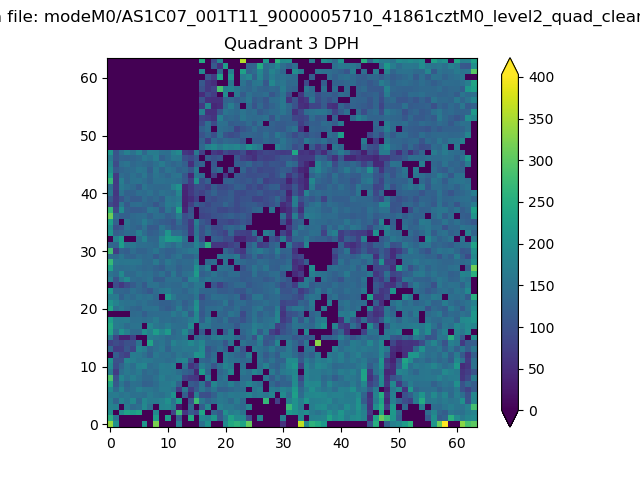 |
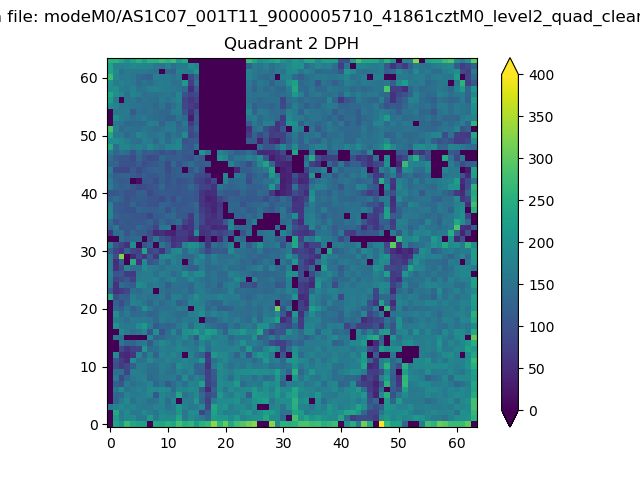 |
Quadrant C |
| Plot type | Count rate plots | Images |
|---|---|---|
| Comparison with Poisson distribution Blue bars denote a histogram of data divided into 1 sec bins. Red curve is a Poisson curve with rate = median count rate of data. |
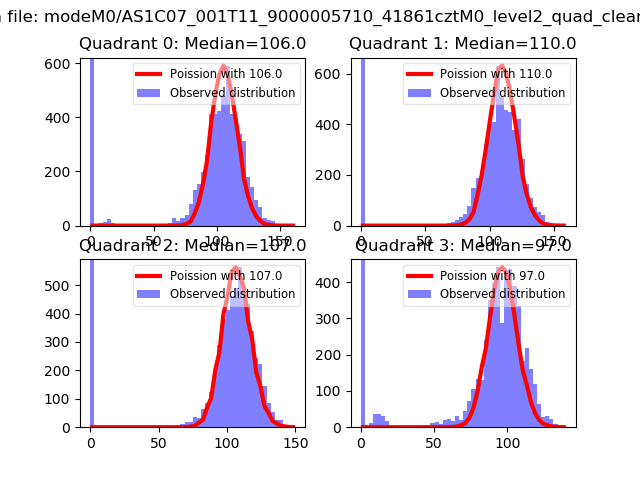 |
 |
| Quadrant-wise count rates Data is divided into 100 sec bins |
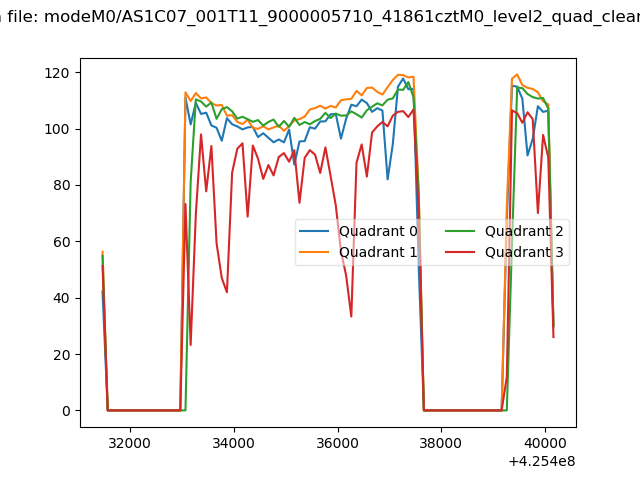 |
|
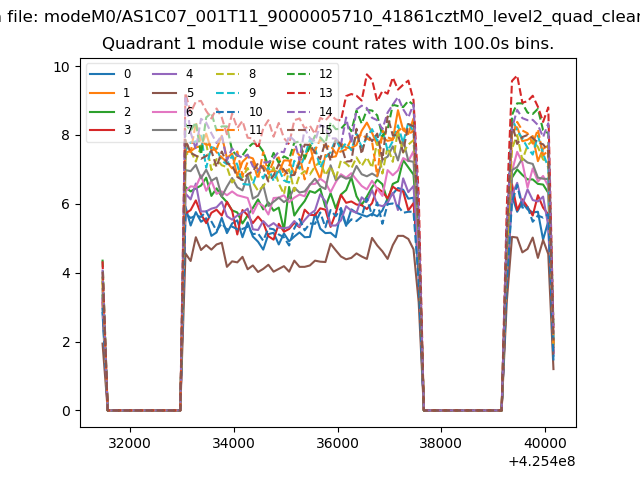
| Module-wise count rates for Quadrant A Data is divided into 100 sec bins |
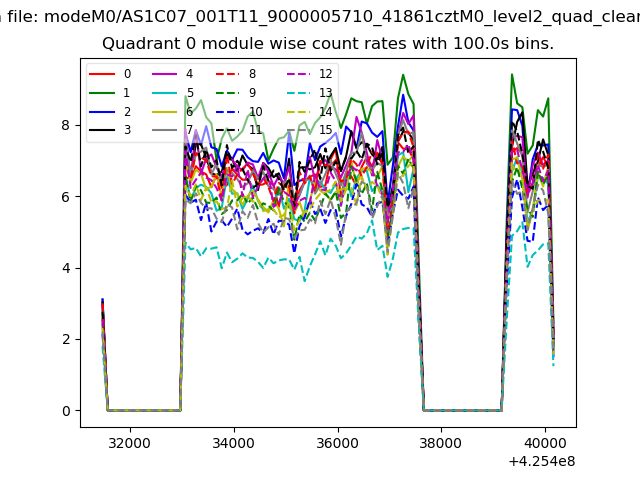 |
 |
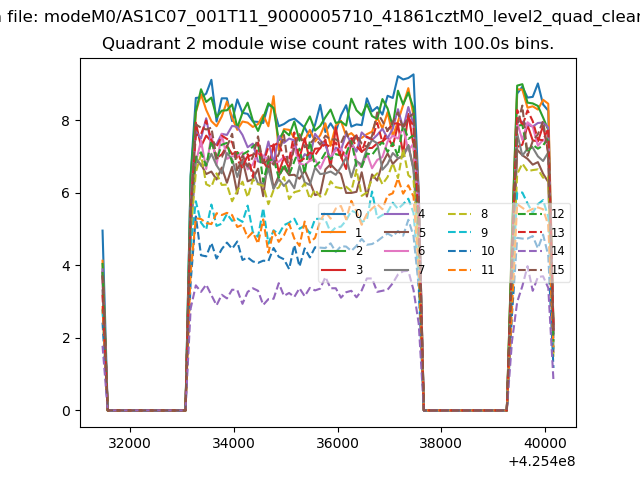
| Module-wise count rates for Quadrant B Data is divided into 100 sec bins |
 |
 |
| Module-wise count rates for Quadrant C Data is divided into 100 sec bins |
 |
 |
| Module-wise count rates for Quadrant D Data is divided into 100 sec bins |
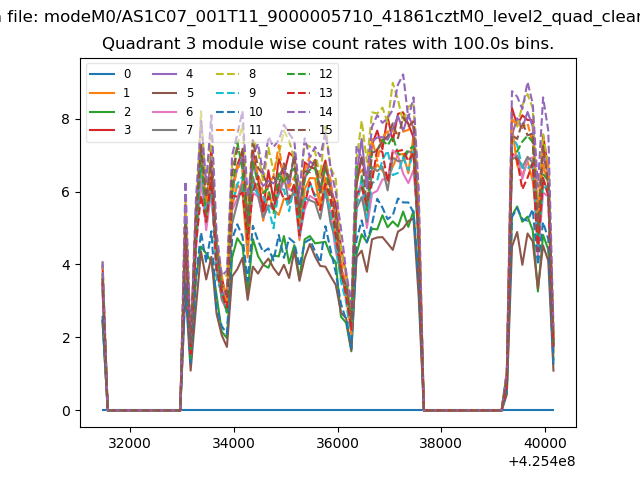 |
 |
| Parameter | Plot |
|---|---|
| CZT HV Monitor | 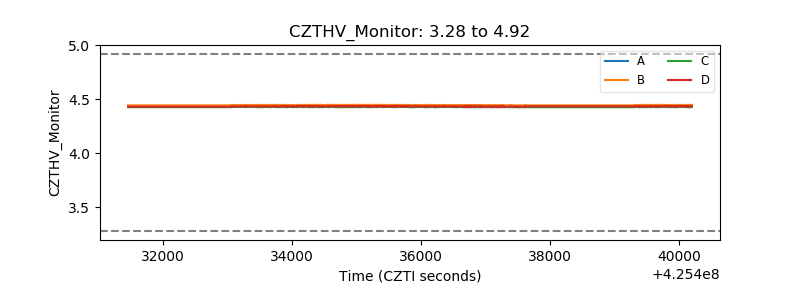 |
| D_VDD | 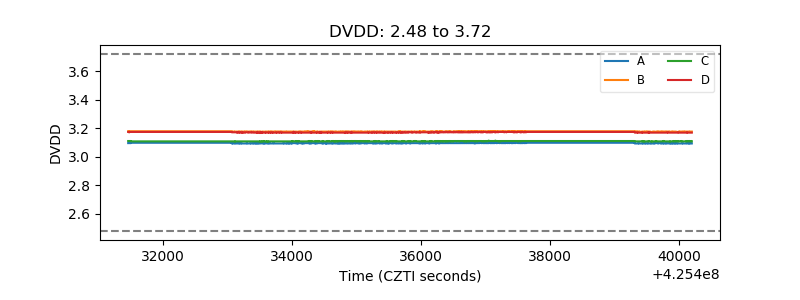 |
| Temperature 1 | 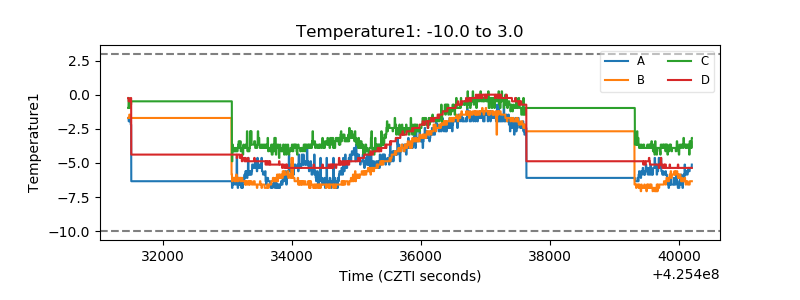 |
| Veto HV Monitor |  |
| Veto LLD | 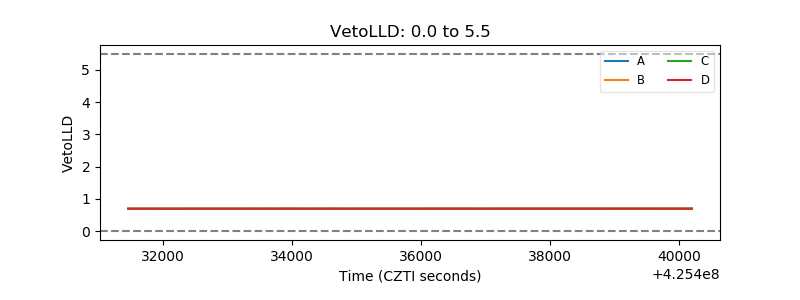 |
| Alpha Counter | 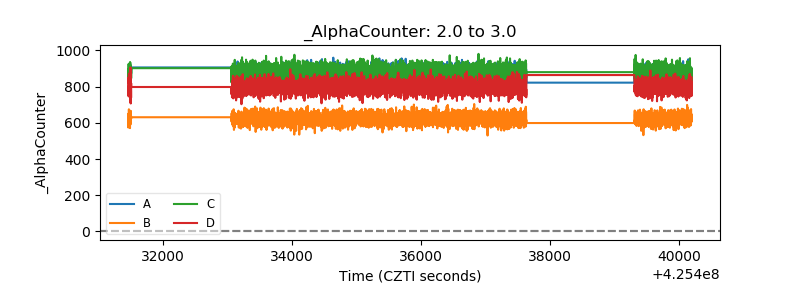 |
| _CPM_Rate | 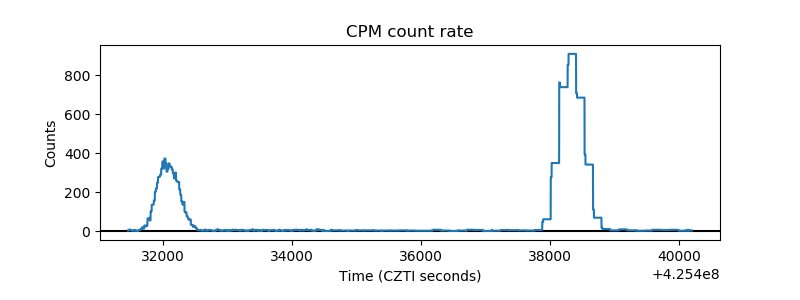 |
| CZT Counter | 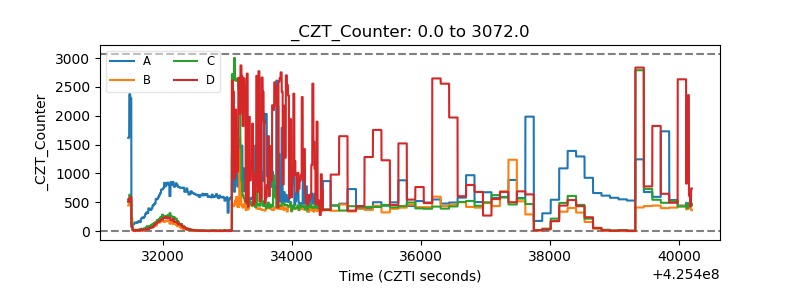 |
| +2.5 Volts monitor | 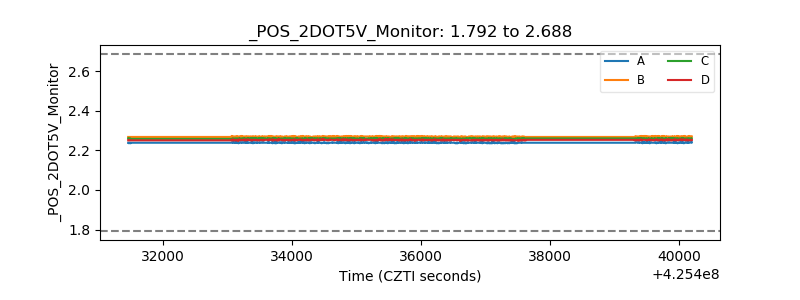 |
| +5 Volts monitor | 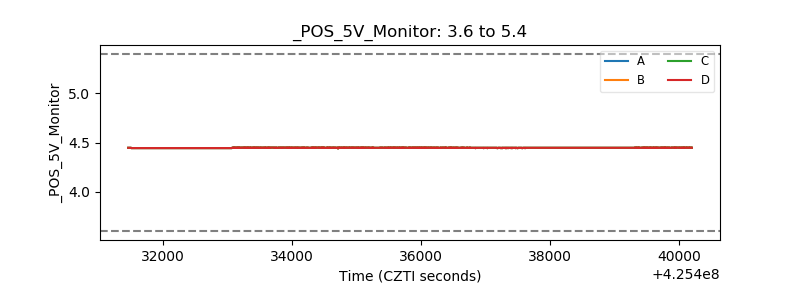 |
| _ROLL_ROT | 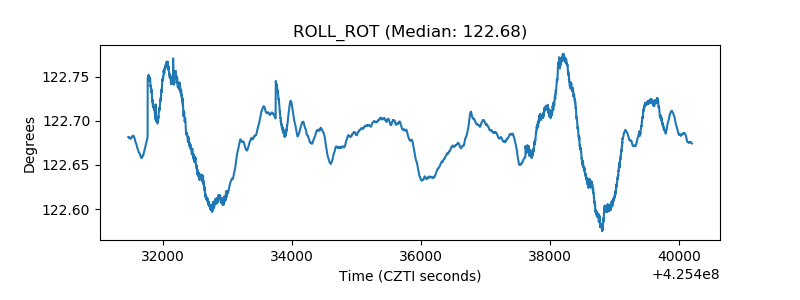 |
| _Roll_DEC | 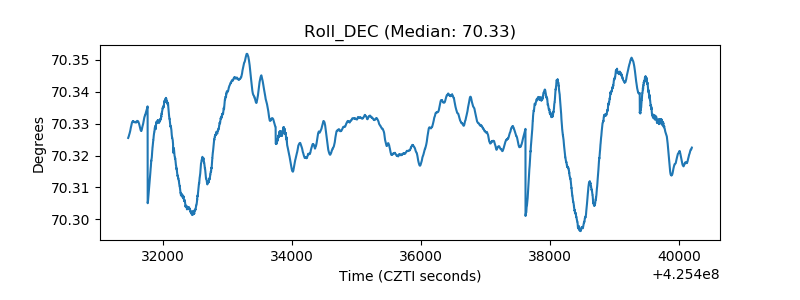 |
| _Roll_RA | 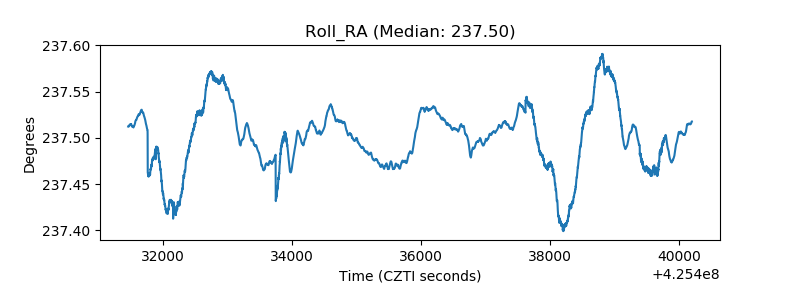 |
| Veto Counter | 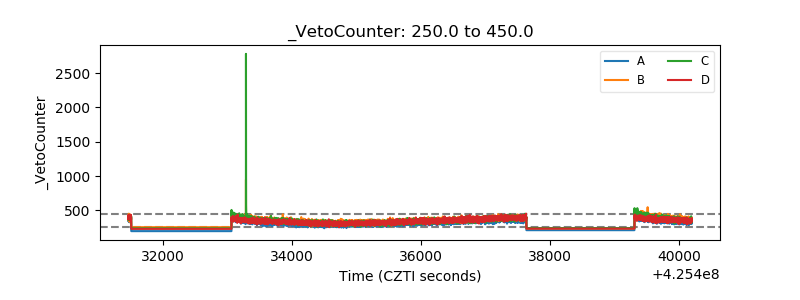 |