| Param | Original file | Final file |
|---|---|---|
| Filename | modeM0/AS1C07_001T11_9000005710_41863cztM0_level2.fits | modeM0/AS1C07_001T11_9000005710_41863cztM0_level2_quad_clean.evt |
| Size (bytes) | 429,842,880 | 89,112,960 |
| Size | 409.9 MB | 85.0 MB |
| Events in quadrant A | 4,266,573 | 582,331 |
| Events in quadrant B | 2,633,097 | 628,055 |
| Events in quadrant C | 3,129,412 | 581,670 |
| Events in quadrant D | 5,450,137 | 517,215 |
| Mode SS | |||
|---|---|---|---|
| Quadrant | BADHDUFLAG | Total packets | Discarded packets |
| A | 0 | 114 | 0 |
| B | 0 | 114 | 0 |
| C | 0 | 114 | 0 |
| D | 0 | 114 | 0 |
| Mode M0 | |||
|---|---|---|---|
| Quadrant | BADHDUFLAG | Total packets | Discarded packets |
| A | 0 | 16354 | 2 |
| B | 0 | 11814 | 2 |
| C | 0 | 13030 | 2 |
| D | 0 | 20049 | 2 |
| Mode M9 | |||
|---|---|---|---|
| Quadrant | BADHDUFLAG | Total packets | Discarded packets |
| A | 0 | 24 | 0 |
| B | 0 | 24 | 0 |
| C | 0 | 25 | 0 |
| D | 0 | 25 | 0 |
| Quadrant | Total seconds | Saturated seconds | Saturation percentage |
|---|---|---|---|
| A | 5556 | 358 | 6.443485% |
| B | 5556 | 10 | 0.179986% |
| C | 5556 | 239 | 4.301656% |
| D | 5556 | 579 | 10.421166% |
Noise dominated data is calculated using 1-second bins in cleaned event files. If a bin has >2000 counts, and if more than 50% of those come from <1% of pixels, then it is considered to be noise-dominated and hence unusable.
| Quadrant | # 1 sec bins | Bins with >0 counts | Bins with >2000 counts | High rate bins dominated by noise | Noise dominated (total time) | Noise dominated (detector-on time) | Marked lightcurve |
|---|---|---|---|---|---|---|---|
| A | 7347 | 5557 | 236 | 236 | 3.21% | 4.25% | 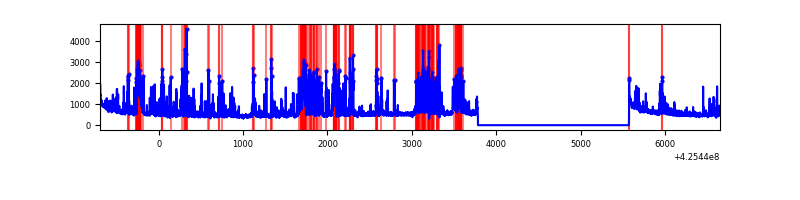 |
| B | 7347 | 5557 | 8 | 8 | 0.11% | 0.14% | 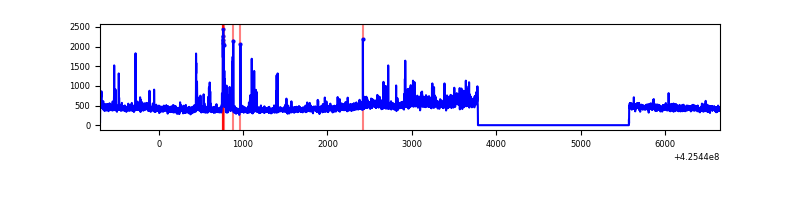 |
| C | 7347 | 5557 | 244 | 244 | 3.32% | 4.39% | 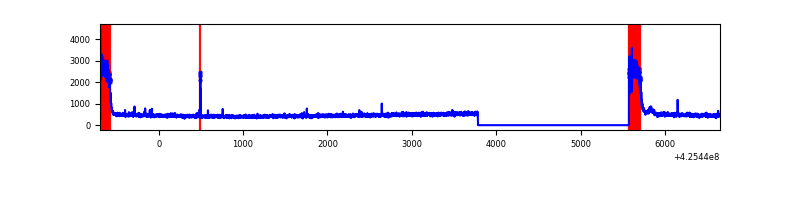 |
| D | 7347 | 5557 | 596 | 596 | 8.11% | 10.73% | 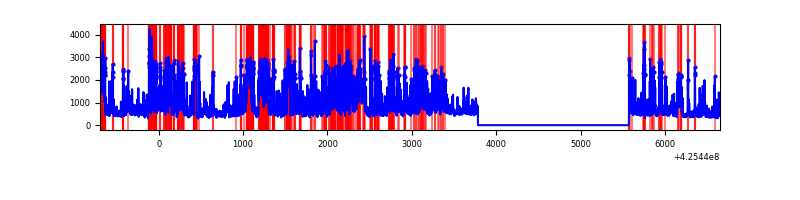 |
Top three noisy pixels from each quadrant. If the there are fewer than three noisy pixels in the level2.evt file, extra rows are filled as -1
| Pixel properties | Quadrant properties | ||||||
|---|---|---|---|---|---|---|---|
| Quadrant | DetID | PixID | Counts | Sigma | Mean | Median | Sigma |
| A | 14 | 24 | 1454466 | 12185.48 | 581 | 567 | 119.3 |
| A | 10 | 83 | 545300 | 4565.54 | 581 | 567 | 119.3 |
| A | 2 | 79 | 17814 | 144.55 | 581 | 567 | 119.3 |
| B | 5 | 255 | 104551 | 913.48 | 593 | 578 | 113.8 |
| B | 7 | 202 | 104054 | 909.12 | 593 | 578 | 113.8 |
| B | 0 | 245 | 43104 | 373.62 | 593 | 578 | 113.8 |
| C | 0 | 10 | 690635 | 5273.89 | 562 | 566 | 130.8 |
| C | 15 | 214 | 220663 | 1682.1 | 562 | 566 | 130.8 |
| C | 9 | 237 | 10393 | 75.1 | 562 | 566 | 130.8 |
| D | 12 | 79 | 1729643 | 12622.5 | 557 | 541 | 137.0 |
| D | 1 | 47 | 503135 | 3668.95 | 557 | 541 | 137.0 |
| D | 13 | 249 | 427215 | 3114.73 | 557 | 541 | 137.0 |
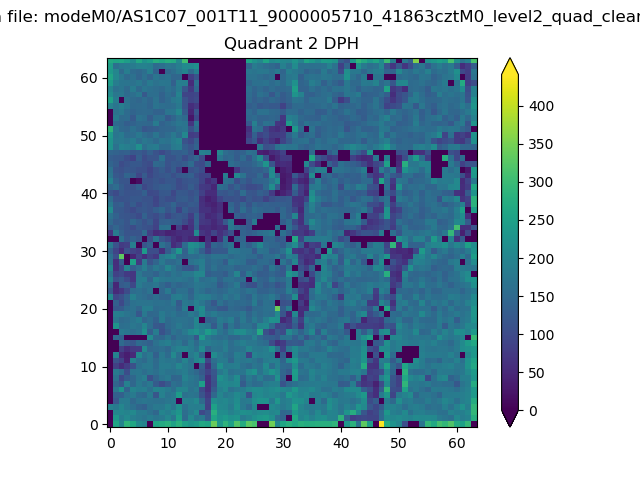
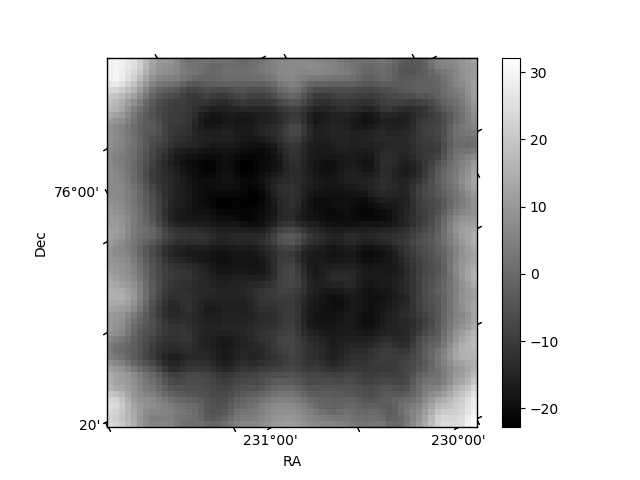
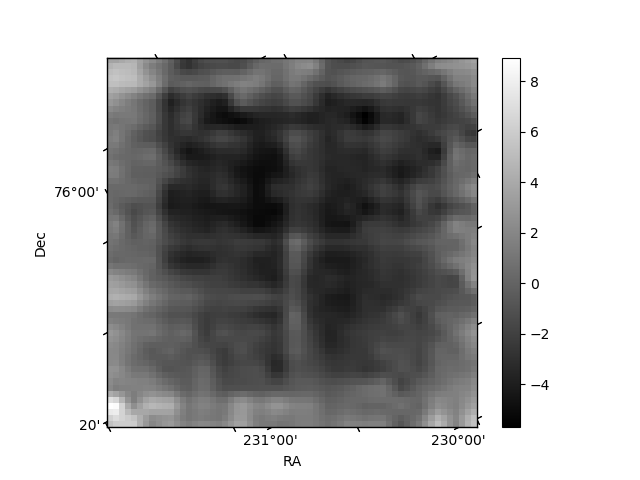
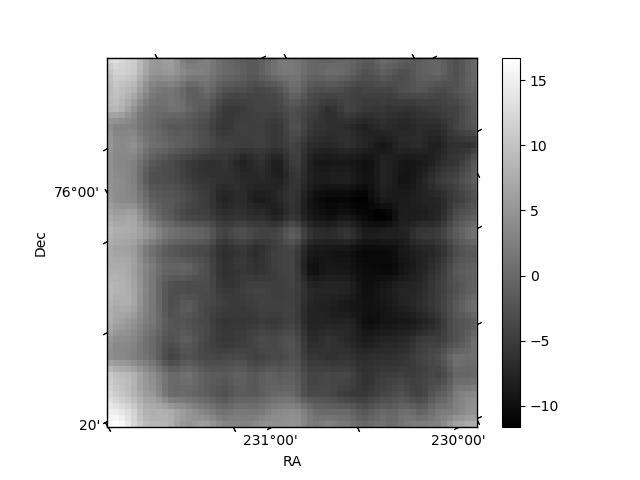
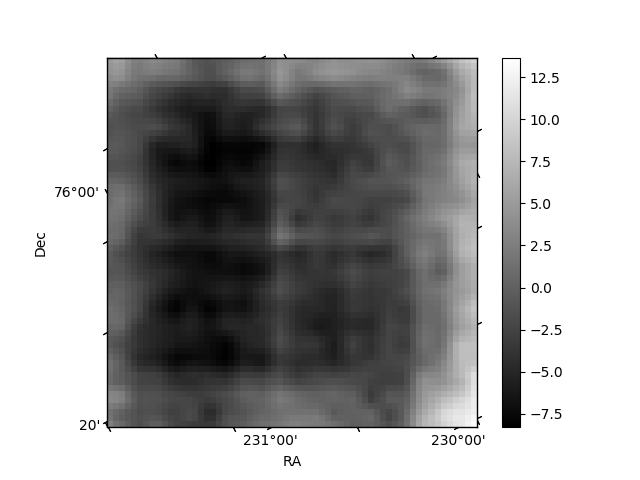
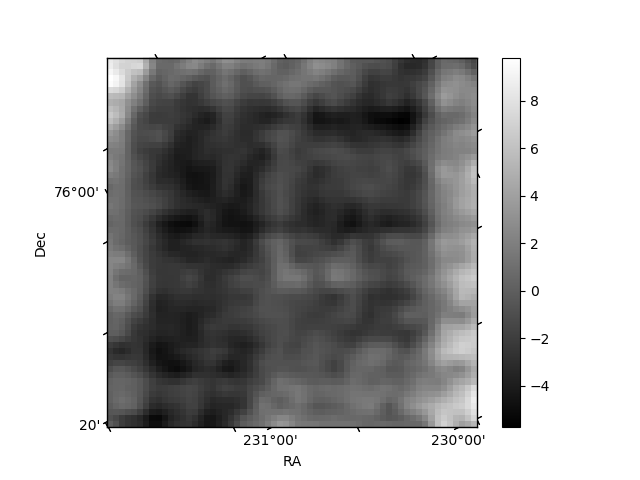
Histogram calculated using DETX and DETY for each event in the final _common_clean file
| Quadrant A | 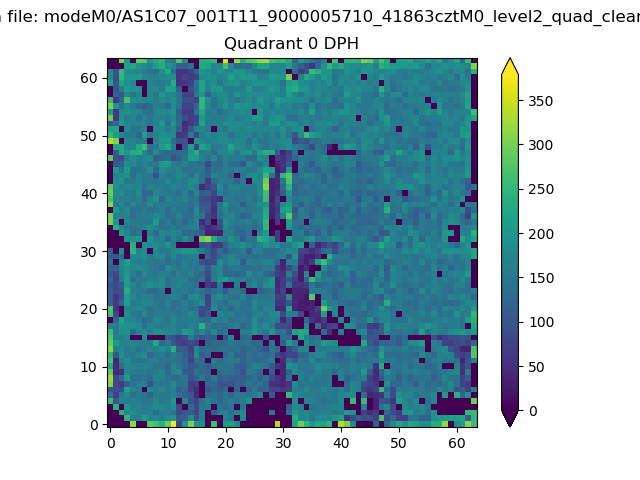 |
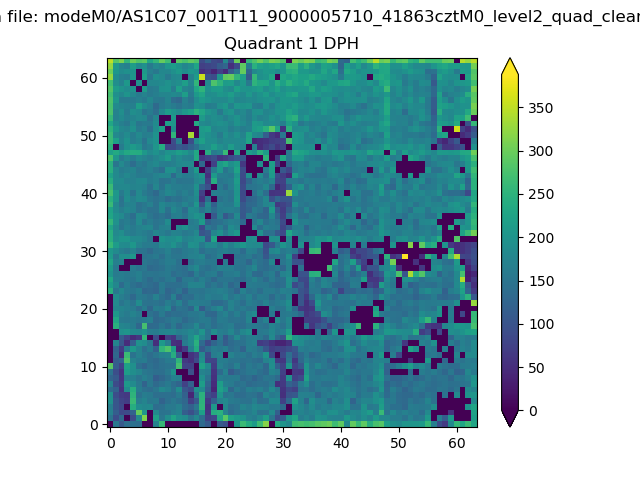 |
Quadrant B |
|---|---|---|---|
| Quadrant D | 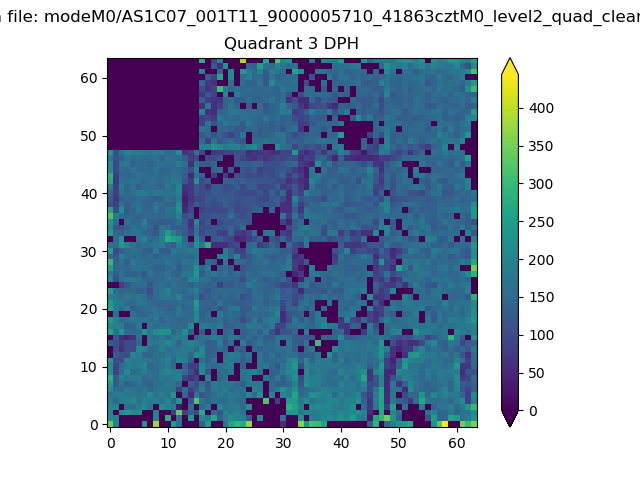 |
 |
Quadrant C |
| Plot type | Count rate plots | Images |
|---|---|---|
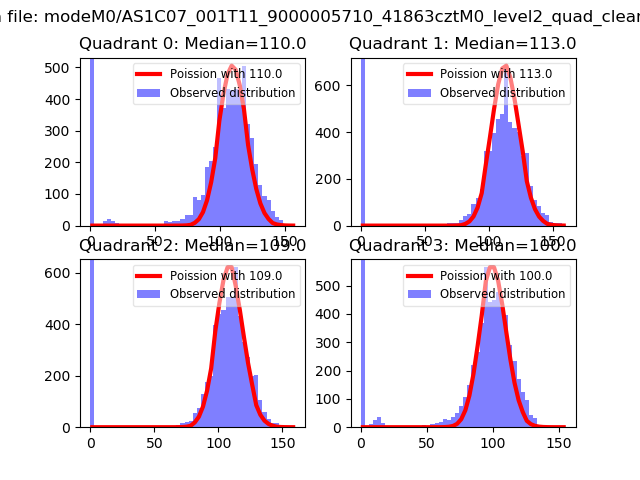
| Comparison with Poisson distribution Blue bars denote a histogram of data divided into 1 sec bins. Red curve is a Poisson curve with rate = median count rate of data. |
 |
 |
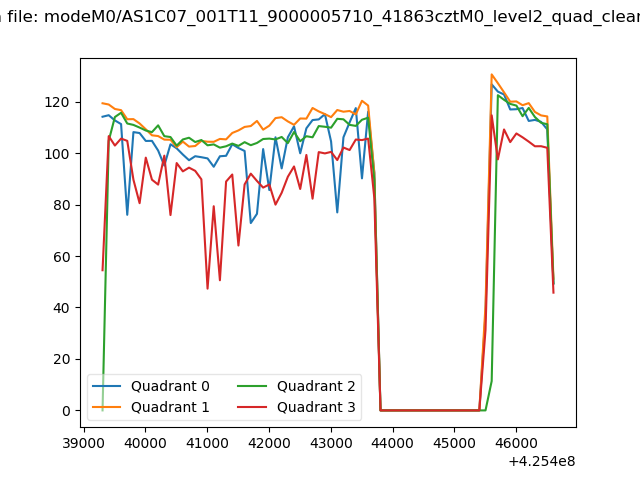
| Quadrant-wise count rates Data is divided into 100 sec bins |
 |
|
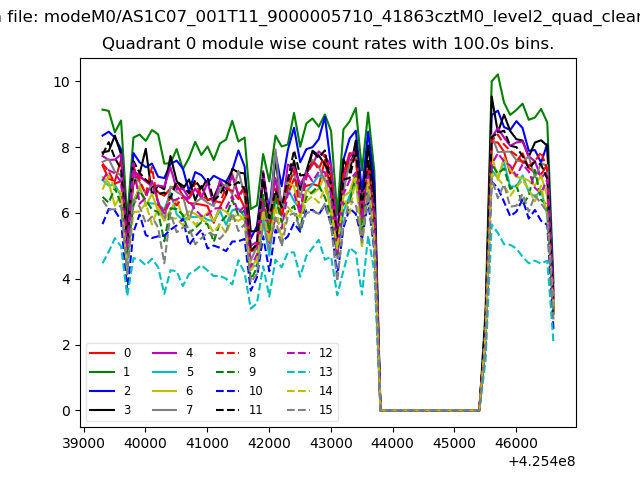
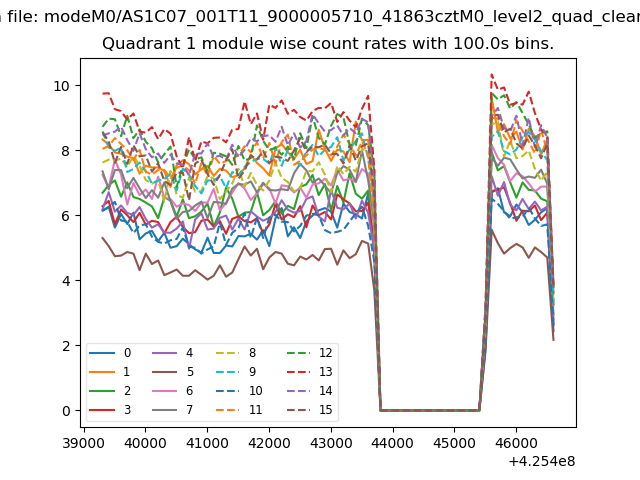
| Module-wise count rates for Quadrant A Data is divided into 100 sec bins |
 |
 |
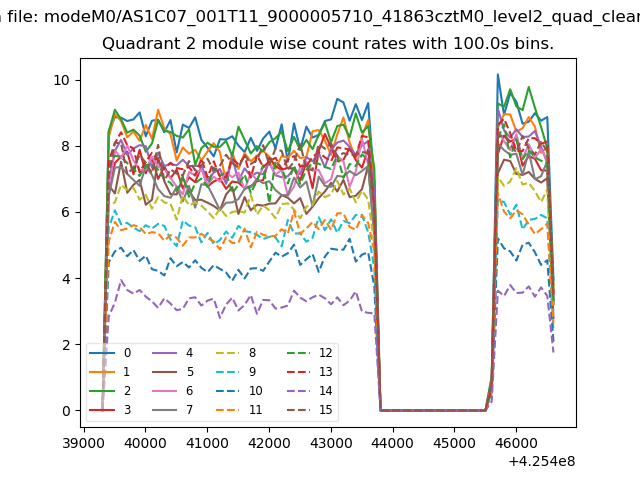
| Module-wise count rates for Quadrant B Data is divided into 100 sec bins |
 |
 |
| Module-wise count rates for Quadrant C Data is divided into 100 sec bins |
 |
 |
| Module-wise count rates for Quadrant D Data is divided into 100 sec bins |
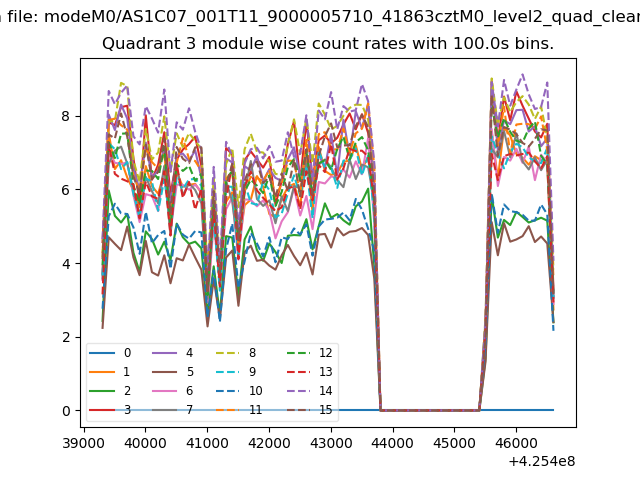 |
 |
| Parameter | Plot |
|---|---|
| CZT HV Monitor | 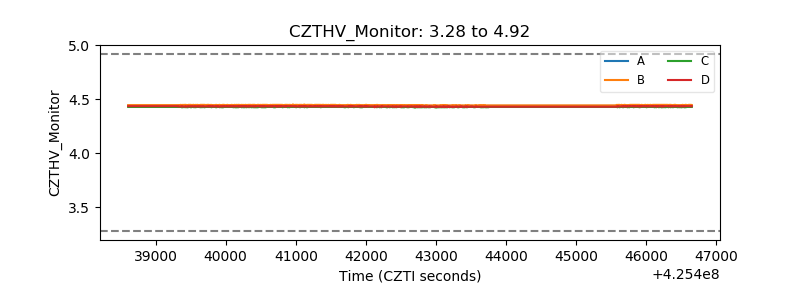 |
| D_VDD | 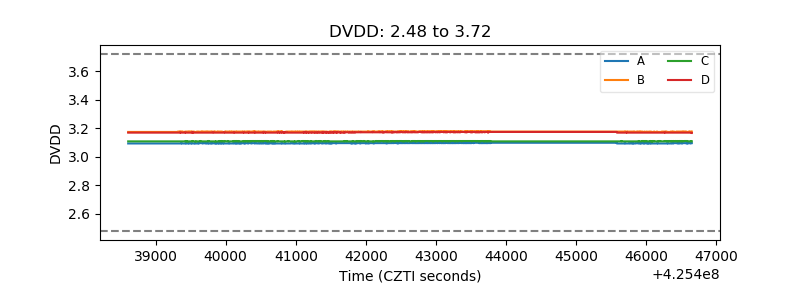 |
| Temperature 1 |  |
| Veto HV Monitor | 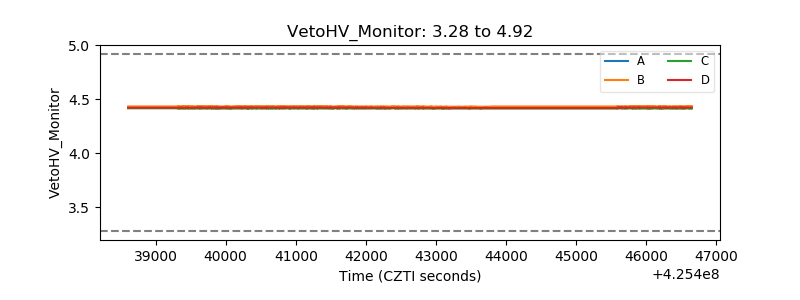 |
| Veto LLD | 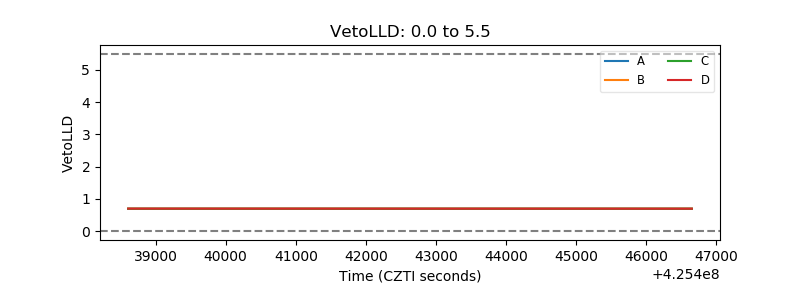 |
| Alpha Counter | 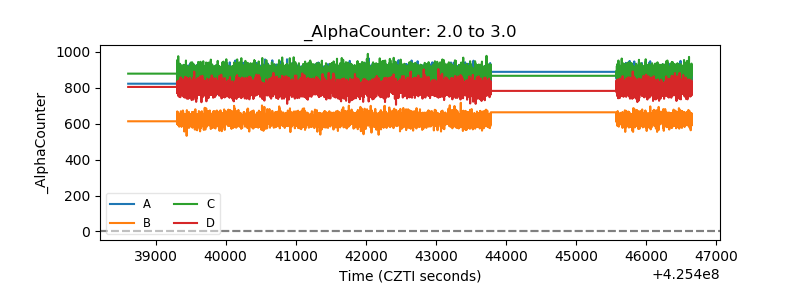 |
| _CPM_Rate | 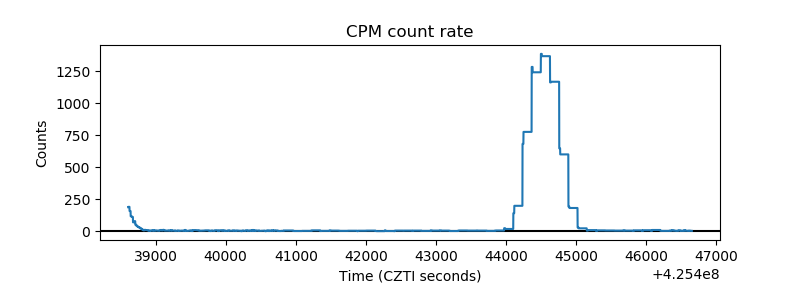 |
| CZT Counter | 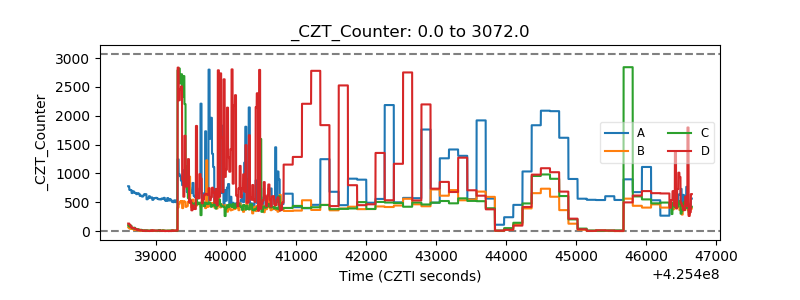 |
| +2.5 Volts monitor | 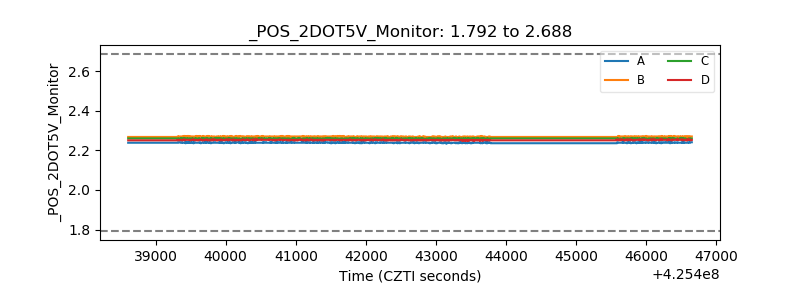 |
| +5 Volts monitor | 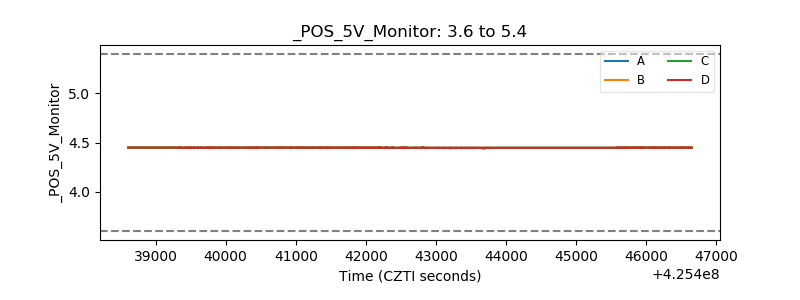 |
| _ROLL_ROT | 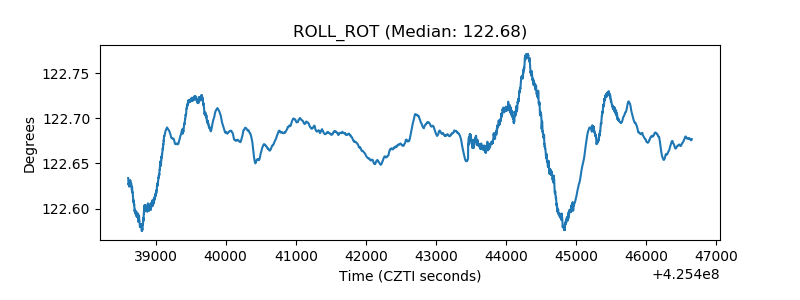 |
| _Roll_DEC | 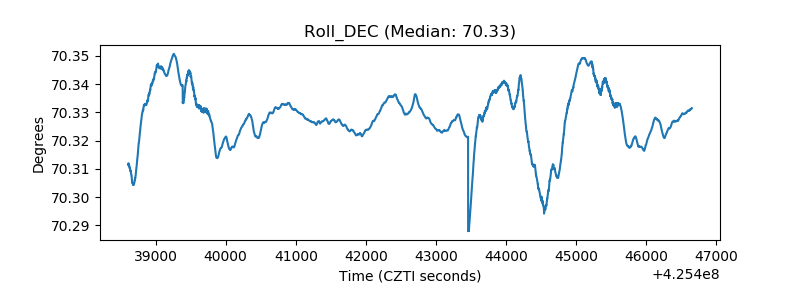 |
| _Roll_RA | 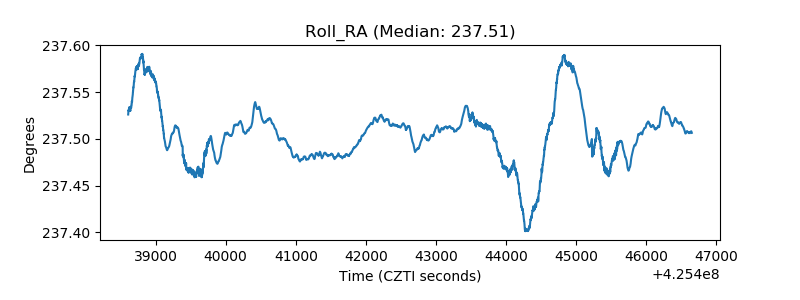 |
| Veto Counter | 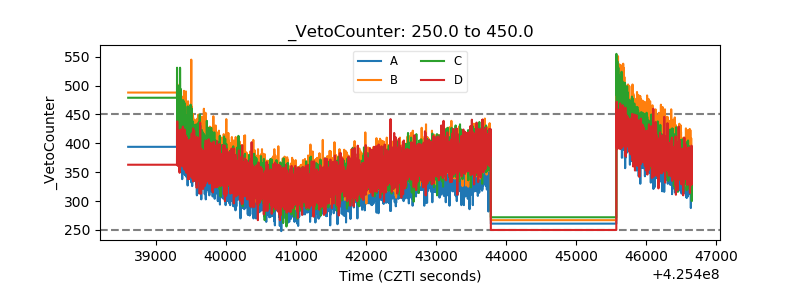 |