| Param | Original file | Final file |
|---|---|---|
| Filename | modeM0/AS1C07_001T11_9000005710_41865cztM0_level2.fits | modeM0/AS1C07_001T11_9000005710_41865cztM0_level2_quad_clean.evt |
| Size (bytes) | 343,342,080 | 86,996,160 |
| Size | 327.4 MB | 83.0 MB |
| Events in quadrant A | 3,307,413 | 592,647 |
| Events in quadrant B | 2,469,961 | 610,490 |
| Events in quadrant C | 3,086,216 | 550,469 |
| Events in quadrant D | 3,458,401 | 532,217 |
| Mode SS | |||
|---|---|---|---|
| Quadrant | BADHDUFLAG | Total packets | Discarded packets |
| A | 0 | 100 | 0 |
| B | 0 | 100 | 0 |
| C | 0 | 100 | 0 |
| D | 0 | 100 | 0 |
| Mode M0 | |||
|---|---|---|---|
| Quadrant | BADHDUFLAG | Total packets | Discarded packets |
| A | 0 | 12869 | 2 |
| B | 0 | 10649 | 2 |
| C | 0 | 12081 | 2 |
| D | 0 | 13592 | 2 |
| Mode M9 | |||
|---|---|---|---|
| Quadrant | BADHDUFLAG | Total packets | Discarded packets |
| A | 0 | 23 | 0 |
| B | 0 | 23 | 0 |
| C | 0 | 24 | 0 |
| D | 0 | 24 | 0 |
| Quadrant | Total seconds | Saturated seconds | Saturation percentage |
|---|---|---|---|
| A | 4976 | 139 | 2.793408% |
| B | 4976 | 68 | 1.366559% |
| C | 4976 | 259 | 5.204984% |
| D | 4976 | 132 | 2.652733% |
Noise dominated data is calculated using 1-second bins in cleaned event files. If a bin has >2000 counts, and if more than 50% of those come from <1% of pixels, then it is considered to be noise-dominated and hence unusable.
| Quadrant | # 1 sec bins | Bins with >0 counts | Bins with >2000 counts | High rate bins dominated by noise | Noise dominated (total time) | Noise dominated (detector-on time) | Marked lightcurve |
|---|---|---|---|---|---|---|---|
| A | 7009 | 4977 | 114 | 114 | 1.63% | 2.29% | 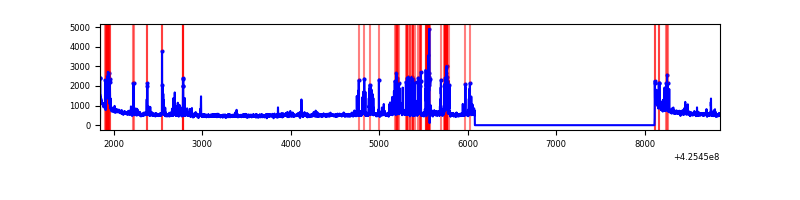 |
| B | 7009 | 4977 | 38 | 38 | 0.54% | 0.76% | 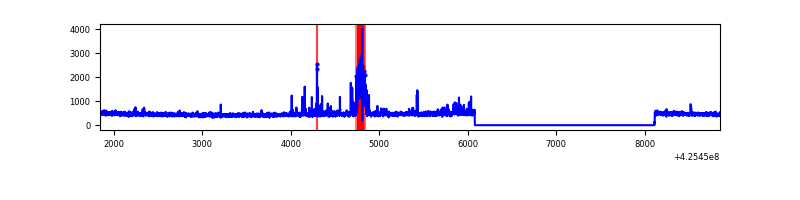 |
| C | 7009 | 4977 | 264 | 264 | 3.77% | 5.30% | 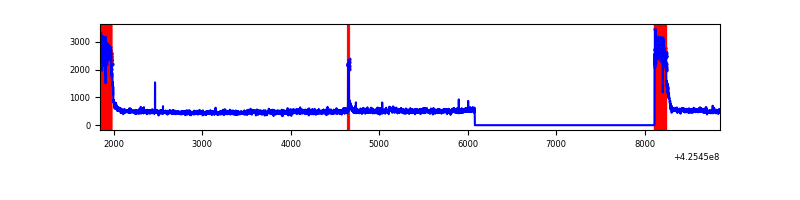 |
| D | 7009 | 4977 | 121 | 121 | 1.73% | 2.43% | 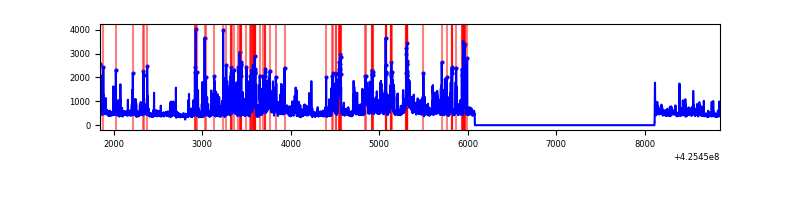 |
Top three noisy pixels from each quadrant. If the there are fewer than three noisy pixels in the level2.evt file, extra rows are filled as -1
| Pixel properties | Quadrant properties | ||||||
|---|---|---|---|---|---|---|---|
| Quadrant | DetID | PixID | Counts | Sigma | Mean | Median | Sigma |
| A | 14 | 24 | 580870 | 5149.03 | 560 | 550 | 112.7 |
| A | 10 | 83 | 531785 | 4713.51 | 560 | 550 | 112.7 |
| A | 2 | 79 | 11275 | 95.16 | 560 | 550 | 112.7 |
| B | 15 | 85 | 133421 | 1256.23 | 557 | 542 | 105.8 |
| B | 5 | 255 | 50315 | 470.55 | 557 | 542 | 105.8 |
| B | 0 | 245 | 43289 | 404.12 | 557 | 542 | 105.8 |
| C | 0 | 10 | 814347 | 6718.71 | 524 | 528 | 121.1 |
| C | 15 | 214 | 198238 | 1632.25 | 524 | 528 | 121.1 |
| C | 2 | 16 | 27682 | 224.18 | 524 | 528 | 121.1 |
| D | 12 | 79 | 534038 | 4112.78 | 540 | 527 | 129.7 |
| D | 13 | 249 | 280220 | 2156.12 | 540 | 527 | 129.7 |
| D | 2 | 249 | 197008 | 1514.65 | 540 | 527 | 129.7 |
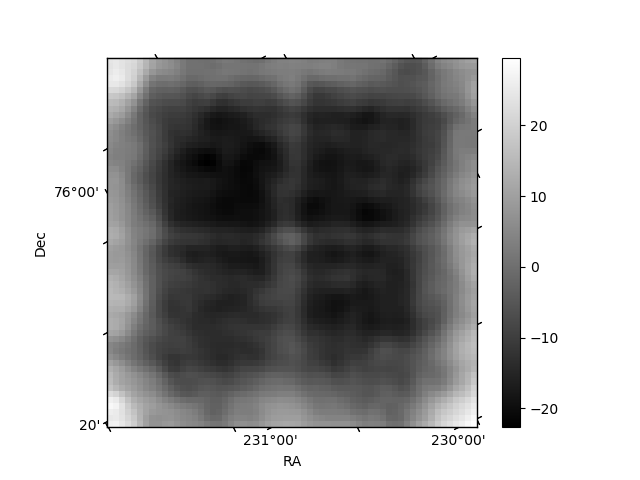
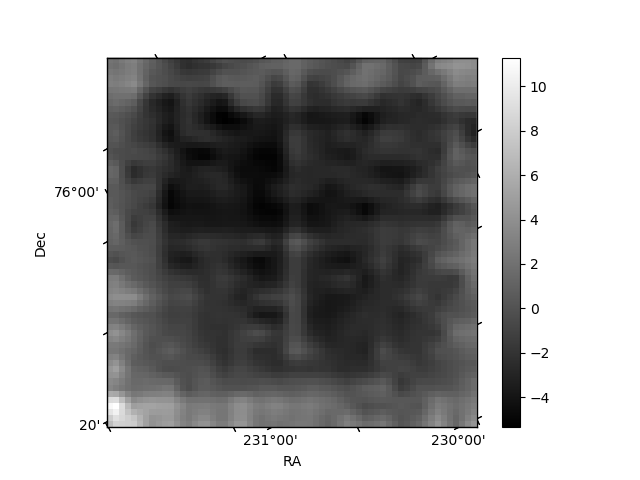
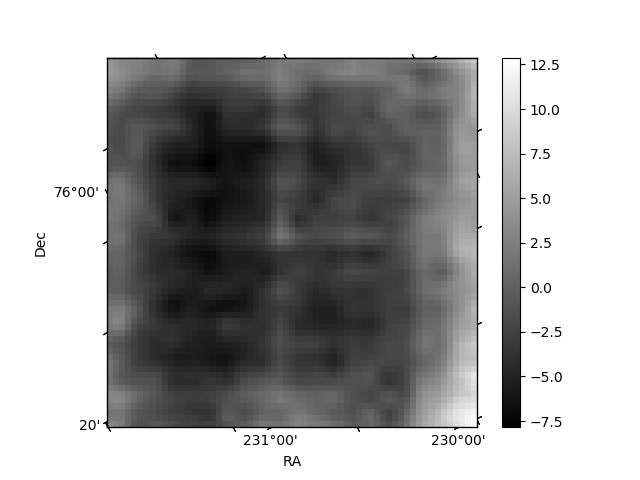
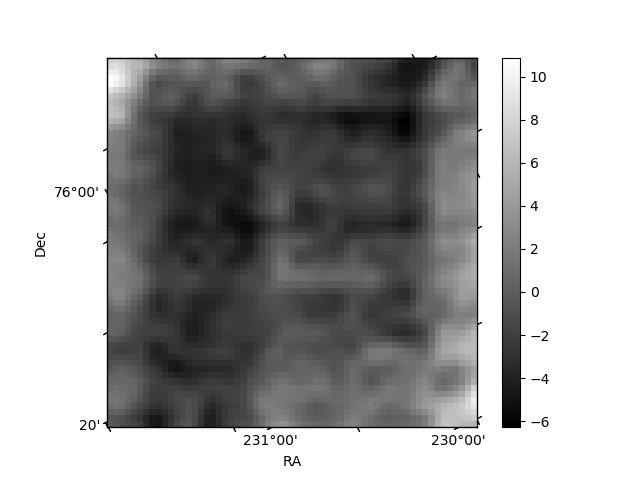
Histogram calculated using DETX and DETY for each event in the final _common_clean file
| Quadrant A | 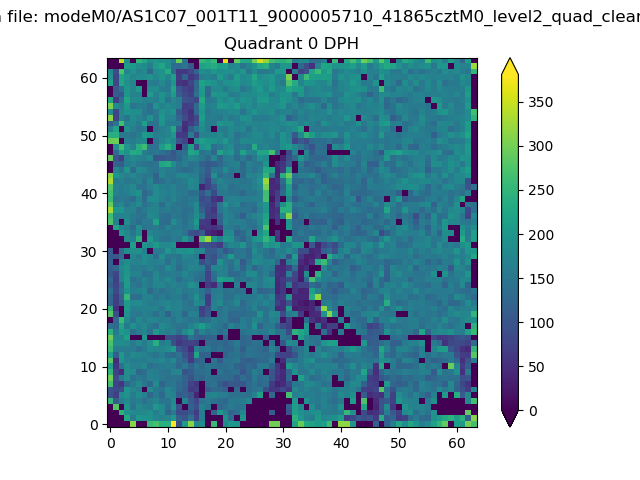 |
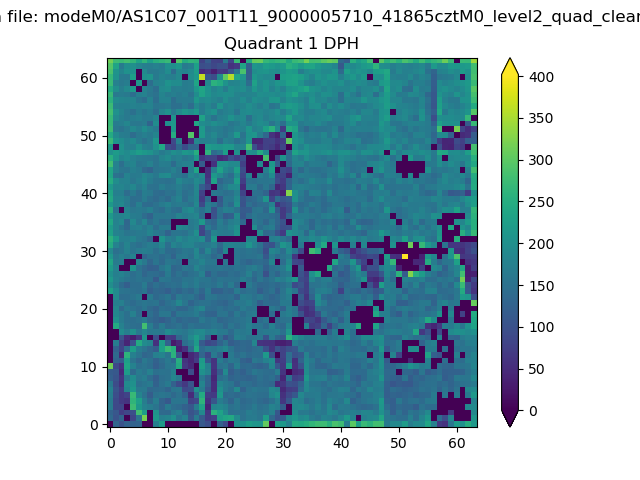 |
Quadrant B |
|---|---|---|---|
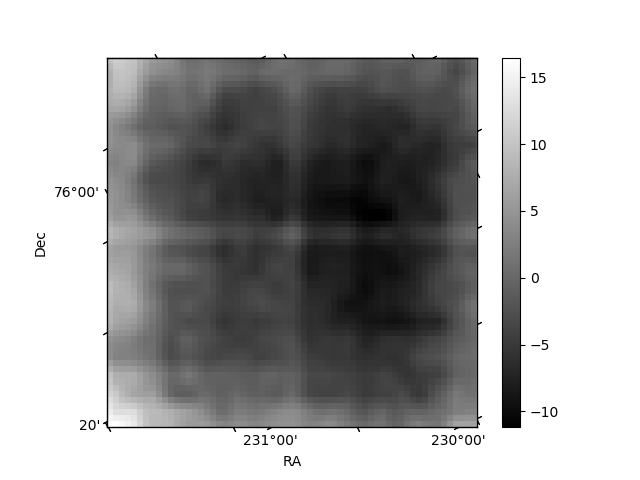
| Quadrant D | 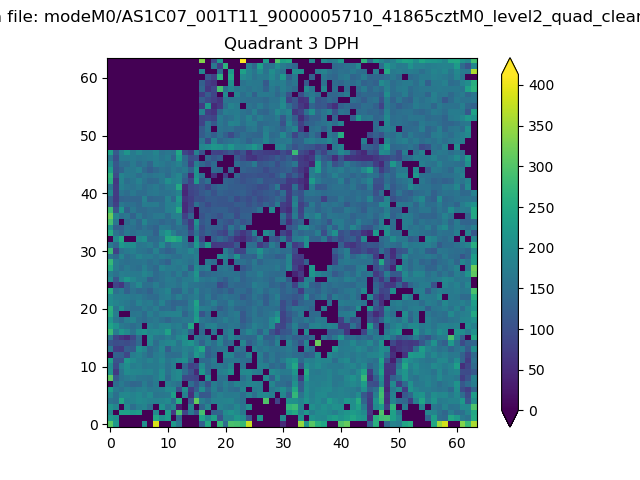 |
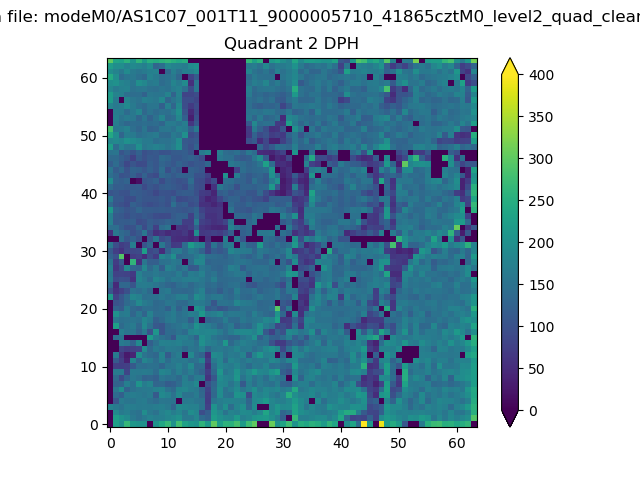 |
Quadrant C |
| Plot type | Count rate plots | Images |
|---|---|---|
| Comparison with Poisson distribution Blue bars denote a histogram of data divided into 1 sec bins. Red curve is a Poisson curve with rate = median count rate of data. |
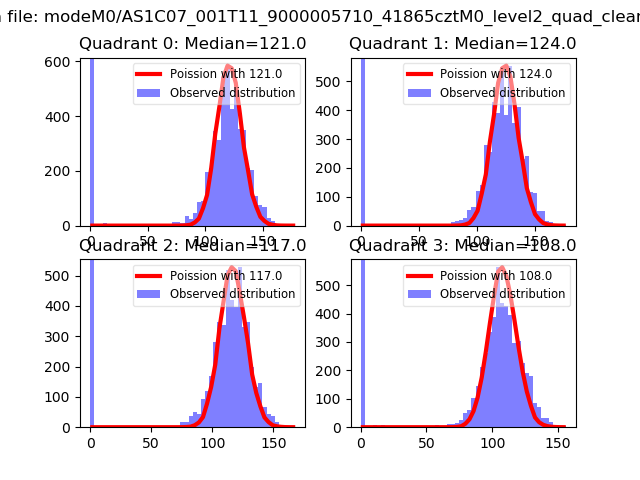 |
 |
| Quadrant-wise count rates Data is divided into 100 sec bins |
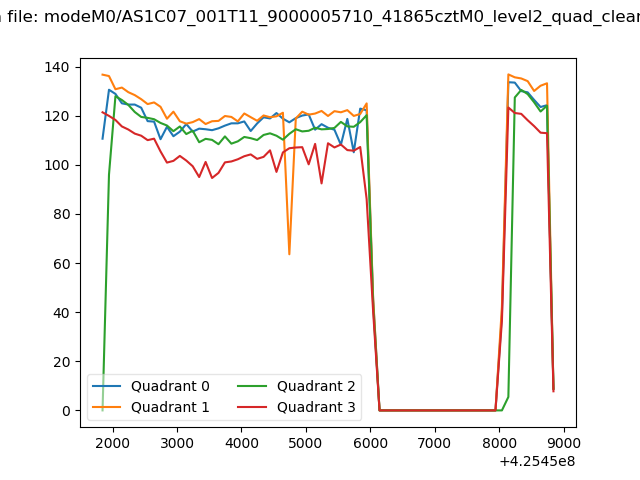 |
|
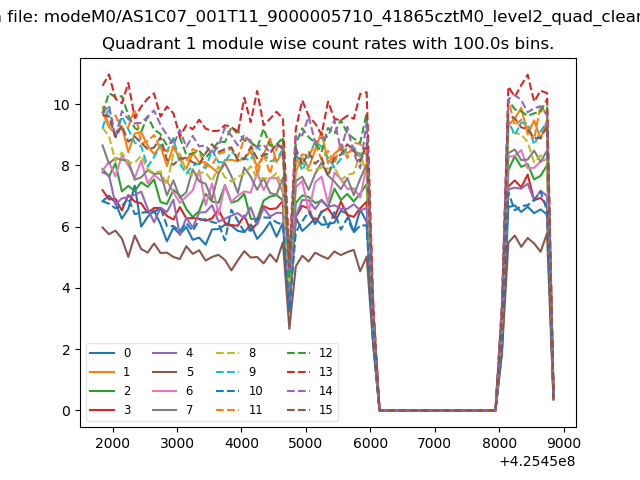
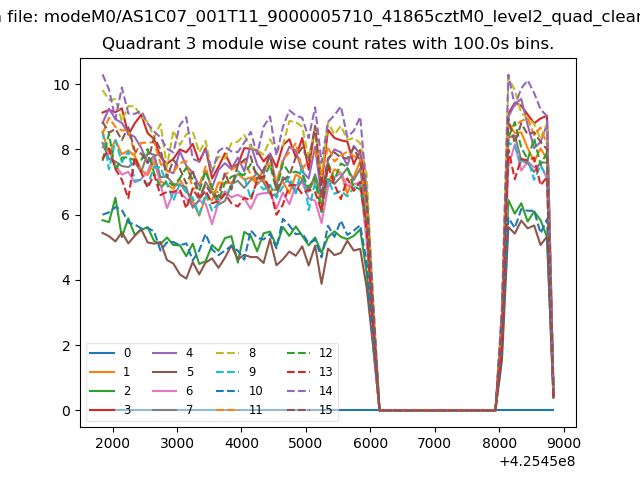
| Module-wise count rates for Quadrant A Data is divided into 100 sec bins |
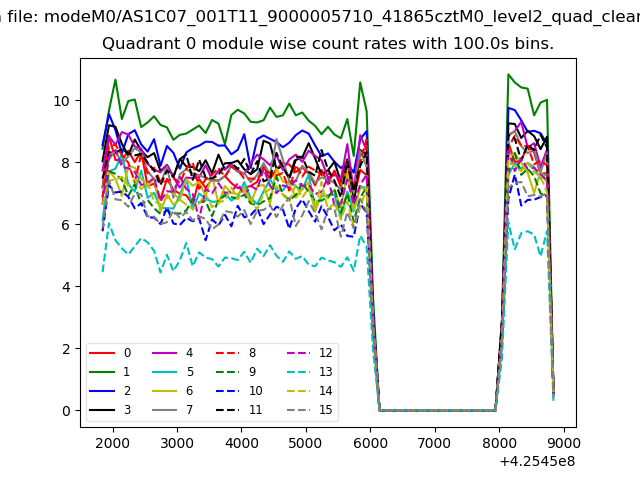 |
 |
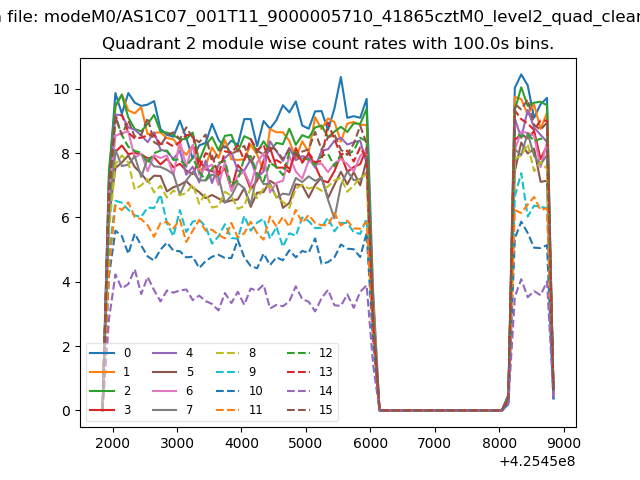
| Module-wise count rates for Quadrant B Data is divided into 100 sec bins |
 |
 |
| Module-wise count rates for Quadrant C Data is divided into 100 sec bins |
 |
 |
| Module-wise count rates for Quadrant D Data is divided into 100 sec bins |
 |
 |
| Parameter | Plot |
|---|---|
| CZT HV Monitor | 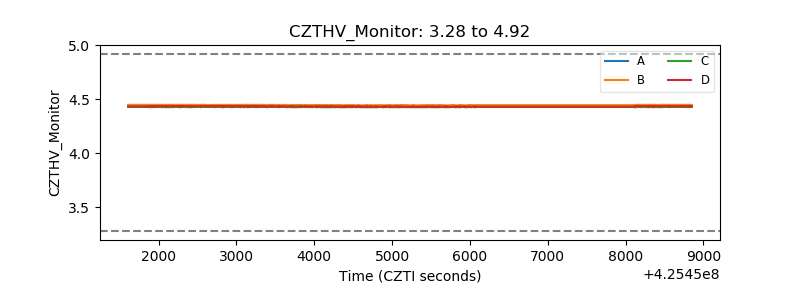 |
| D_VDD | 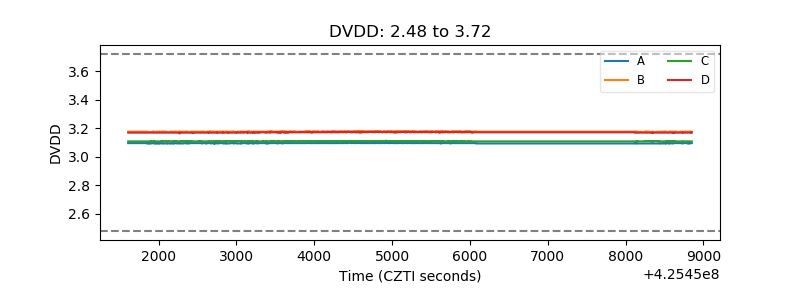 |
| Temperature 1 | 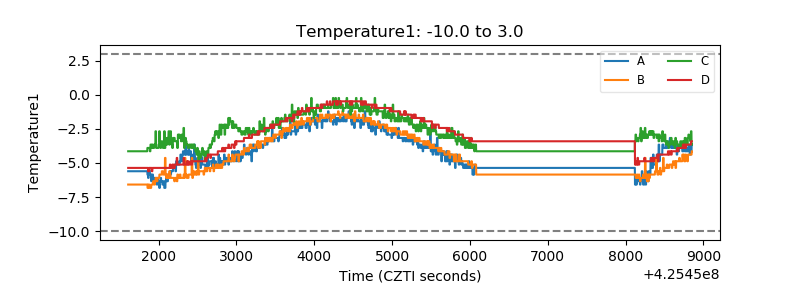 |
| Veto HV Monitor | 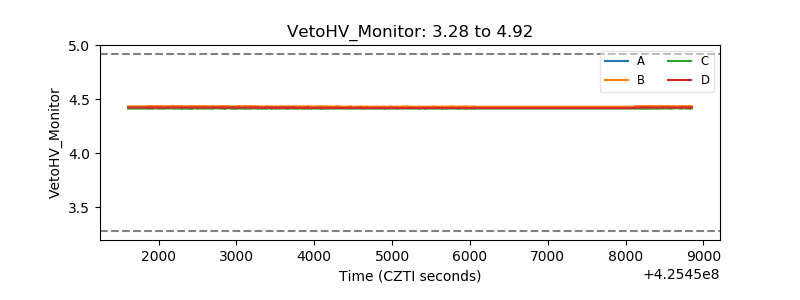 |
| Veto LLD | 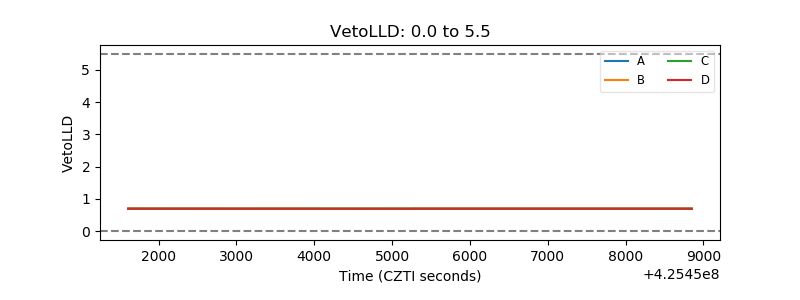 |
| Alpha Counter | 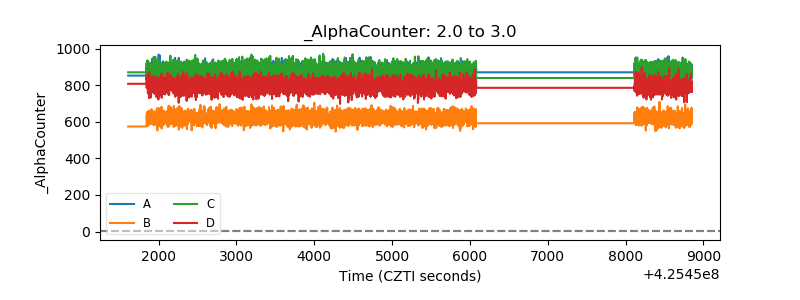 |
| _CPM_Rate | 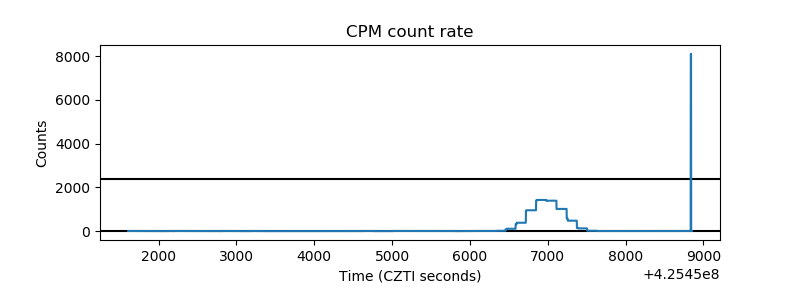 |
| CZT Counter | 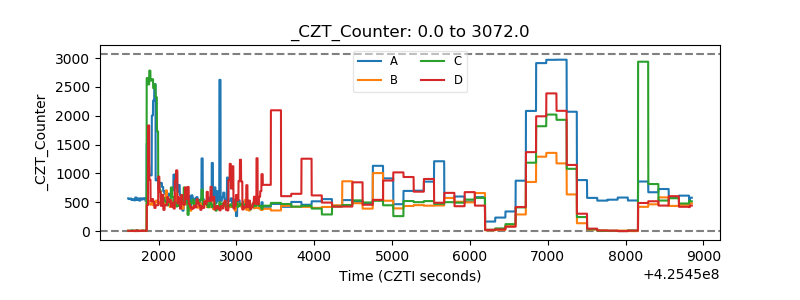 |
| +2.5 Volts monitor | 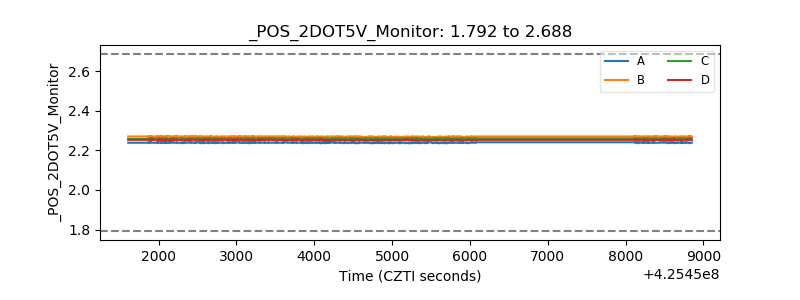 |
| +5 Volts monitor | 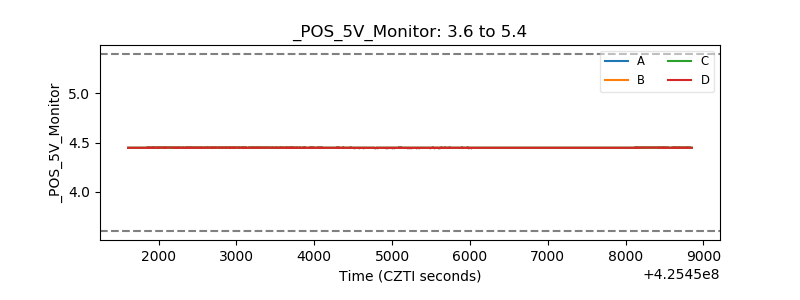 |
| _ROLL_ROT | 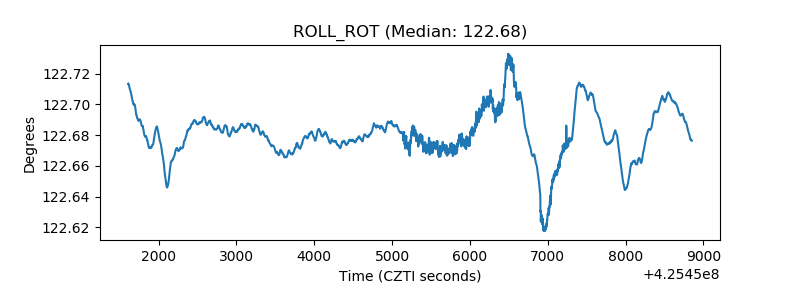 |
| _Roll_DEC |  |
| _Roll_RA | 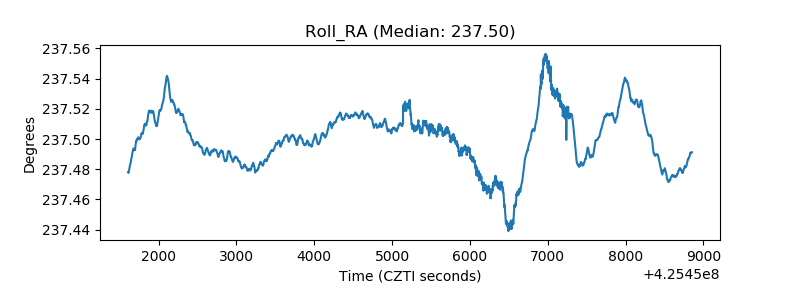 |
| Veto Counter | 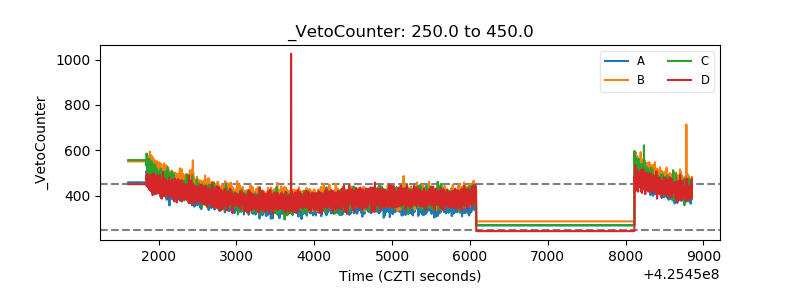 |