| Param | Original file | Final file |
|---|---|---|
| Filename | modeM0/AS1C07_001T11_9000005710_41866cztM0_level2.fits | modeM0/AS1C07_001T11_9000005710_41866cztM0_level2_quad_clean.evt |
| Size (bytes) | 386,268,480 | 84,890,880 |
| Size | 368.4 MB | 81.0 MB |
| Events in quadrant A | 3,713,428 | 574,057 |
| Events in quadrant B | 2,619,689 | 608,827 |
| Events in quadrant C | 3,071,242 | 543,368 |
| Events in quadrant D | 4,512,954 | 500,525 |
| Mode SS | |||
|---|---|---|---|
| Quadrant | BADHDUFLAG | Total packets | Discarded packets |
| A | 0 | 100 | 0 |
| B | 0 | 100 | 0 |
| C | 0 | 100 | 0 |
| D | 0 | 100 | 0 |
| Mode M0 | |||
|---|---|---|---|
| Quadrant | BADHDUFLAG | Total packets | Discarded packets |
| A | 0 | 14089 | 2 |
| B | 0 | 10999 | 2 |
| C | 0 | 11910 | 2 |
| D | 0 | 16713 | 2 |
| Mode M9 | |||
|---|---|---|---|
| Quadrant | BADHDUFLAG | Total packets | Discarded packets |
| A | 0 | 30 | 0 |
| B | 0 | 30 | 0 |
| C | 0 | 31 | 0 |
| D | 0 | 31 | 0 |
| Quadrant | Total seconds | Saturated seconds | Saturation percentage |
|---|---|---|---|
| A | 4900 | 293 | 5.979592% |
| B | 4900 | 41 | 0.836735% |
| C | 4900 | 265 | 5.408163% |
| D | 4900 | 439 | 8.959184% |
Noise dominated data is calculated using 1-second bins in cleaned event files. If a bin has >2000 counts, and if more than 50% of those come from <1% of pixels, then it is considered to be noise-dominated and hence unusable.
| Quadrant | # 1 sec bins | Bins with >0 counts | Bins with >2000 counts | High rate bins dominated by noise | Noise dominated (total time) | Noise dominated (detector-on time) | Marked lightcurve |
|---|---|---|---|---|---|---|---|
| A | 7023 | 4901 | 197 | 197 | 2.81% | 4.02% | 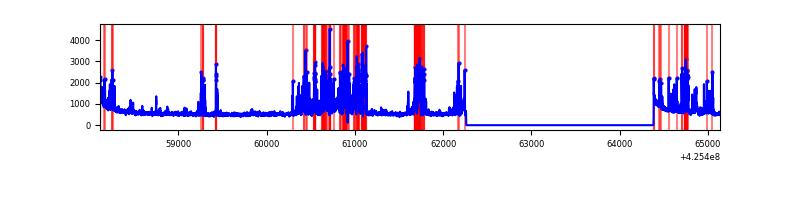 |
| B | 7023 | 4901 | 24 | 24 | 0.34% | 0.49% | 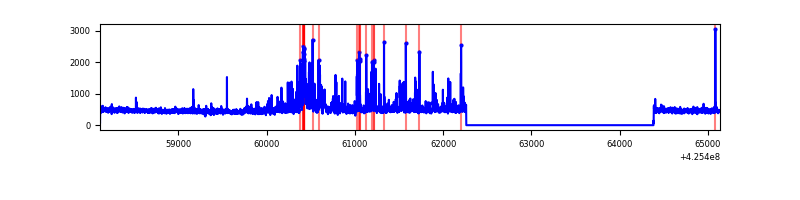 |
| C | 7023 | 4901 | 266 | 266 | 3.79% | 5.43% | 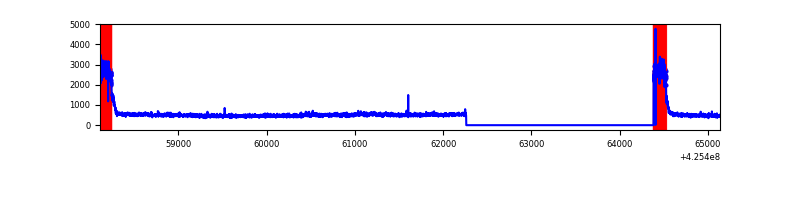 |
| D | 7023 | 4901 | 456 | 456 | 6.49% | 9.30% | 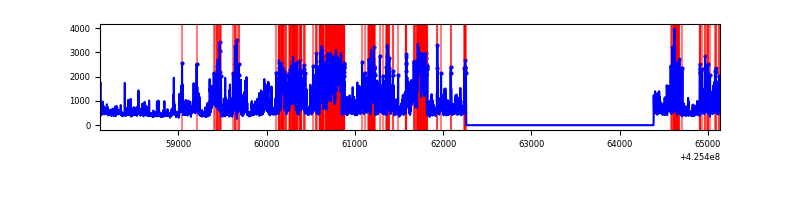 |
Top three noisy pixels from each quadrant. If the there are fewer than three noisy pixels in the level2.evt file, extra rows are filled as -1
| Pixel properties | Quadrant properties | ||||||
|---|---|---|---|---|---|---|---|
| Quadrant | DetID | PixID | Counts | Sigma | Mean | Median | Sigma |
| A | 14 | 24 | 1033986 | 9217.42 | 550 | 541 | 112.1 |
| A | 10 | 83 | 534211 | 4759.87 | 550 | 541 | 112.1 |
| A | 13 | 248 | 8165 | 68.0 | 550 | 541 | 112.1 |
| B | 5 | 255 | 218248 | 2090.48 | 550 | 536 | 104.1 |
| B | 0 | 245 | 82509 | 787.11 | 550 | 536 | 104.1 |
| B | 0 | 156 | 47025 | 446.39 | 550 | 536 | 104.1 |
| C | 0 | 10 | 869833 | 7294.69 | 513 | 515 | 119.2 |
| C | 15 | 214 | 192665 | 1612.38 | 513 | 515 | 119.2 |
| C | 13 | 61 | 3541 | 25.39 | 513 | 515 | 119.2 |
| D | 12 | 79 | 1975157 | 15337.62 | 527 | 512 | 128.7 |
| D | 13 | 249 | 140499 | 1087.32 | 527 | 512 | 128.7 |
| D | 2 | 249 | 94161 | 727.4 | 527 | 512 | 128.7 |
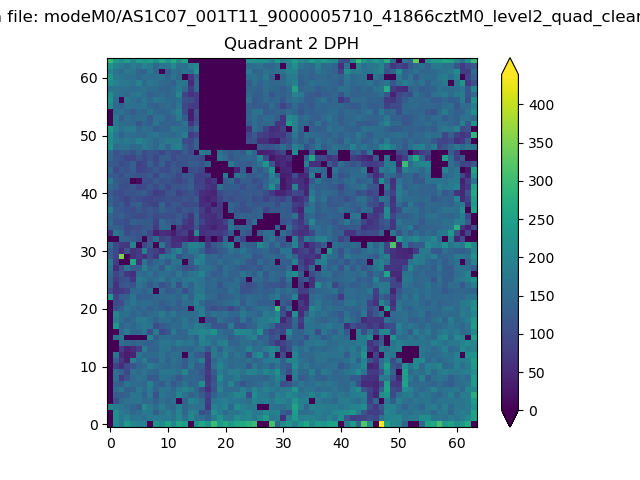
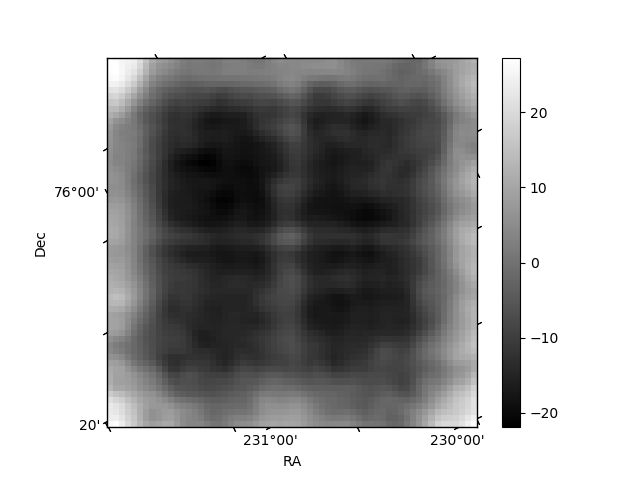
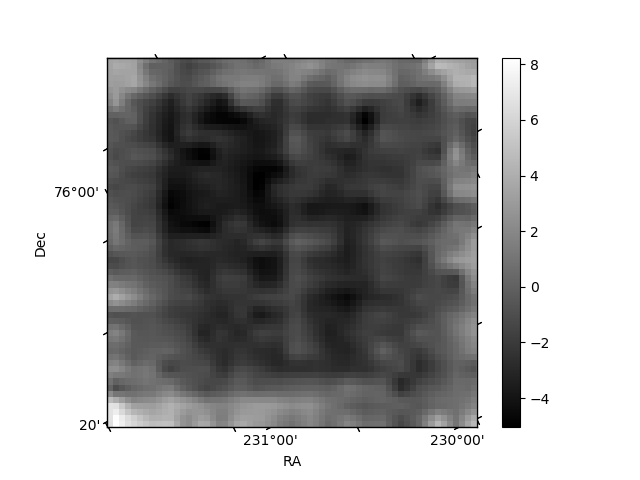
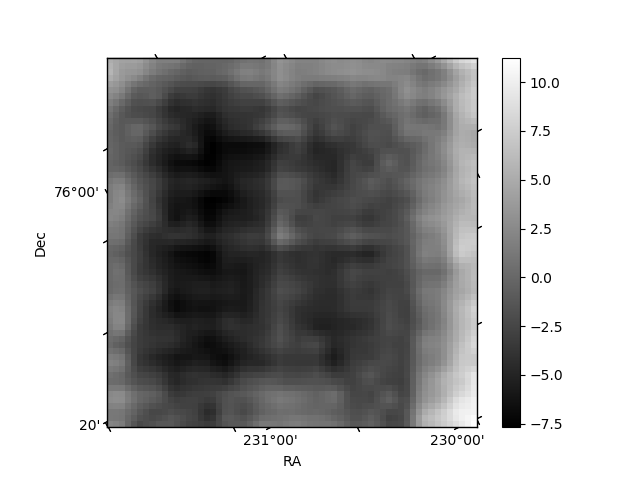
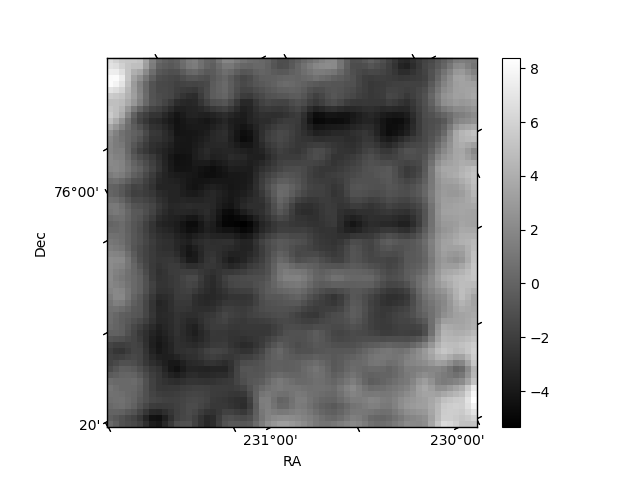
Histogram calculated using DETX and DETY for each event in the final _common_clean file
| Quadrant A | 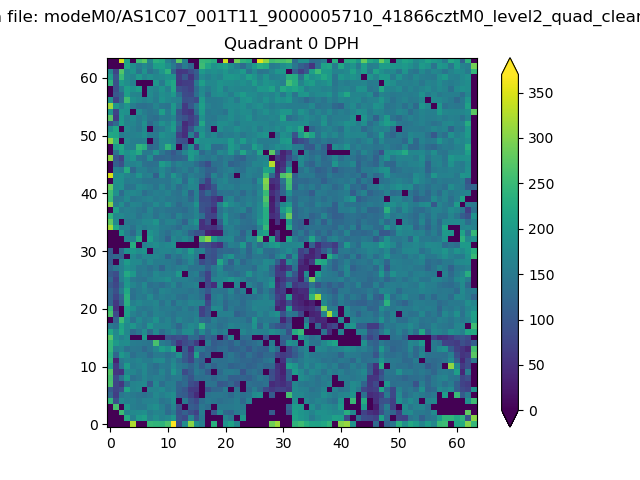 |
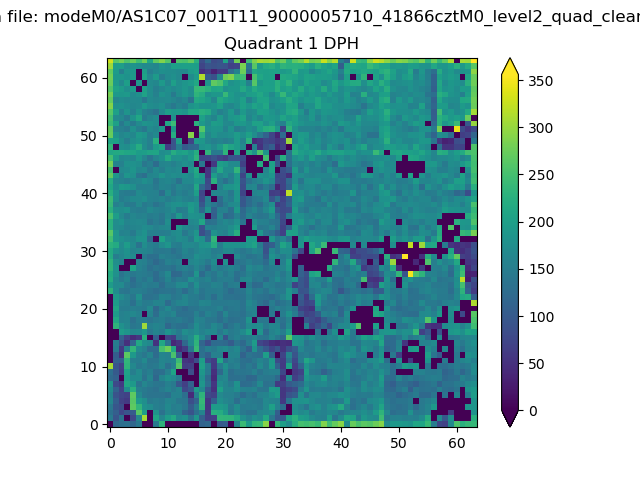 |
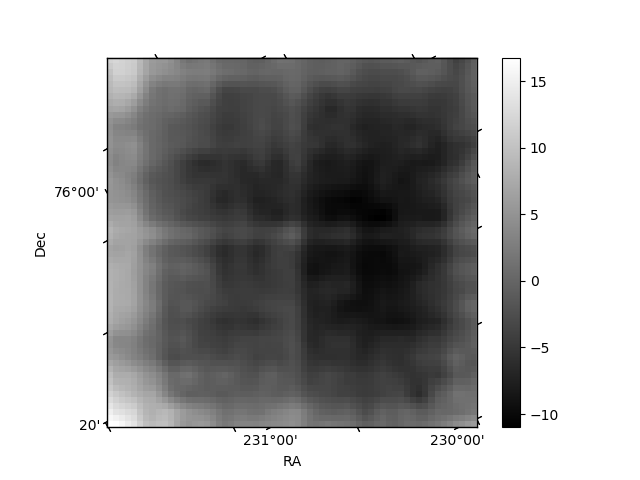
Quadrant B |
|---|---|---|---|
| Quadrant D | 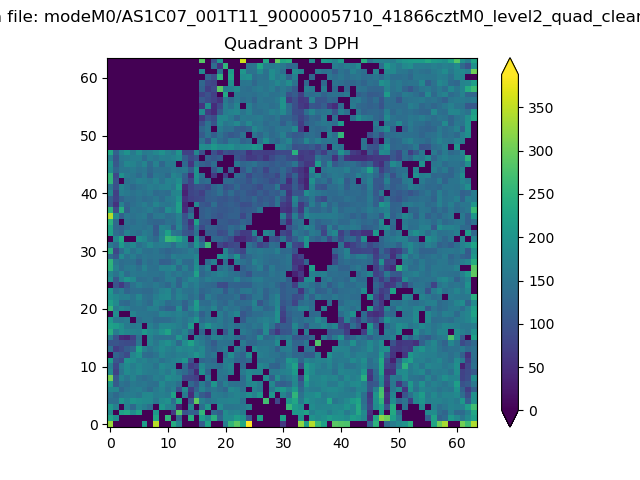 |
 |
Quadrant C |
| Plot type | Count rate plots | Images |
|---|---|---|
| Comparison with Poisson distribution Blue bars denote a histogram of data divided into 1 sec bins. Red curve is a Poisson curve with rate = median count rate of data. |
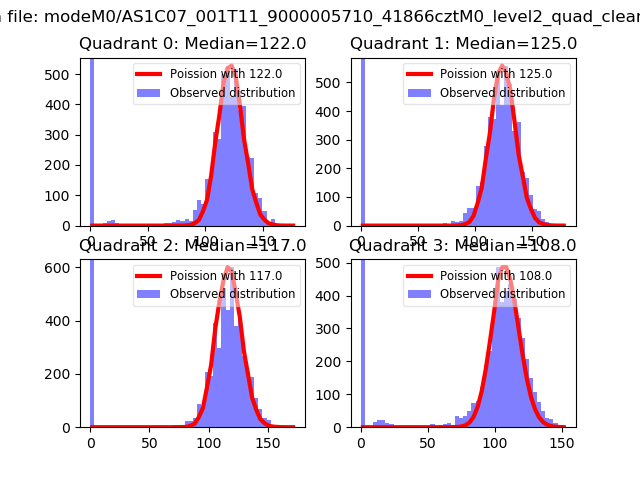 |
 |
| Quadrant-wise count rates Data is divided into 100 sec bins |
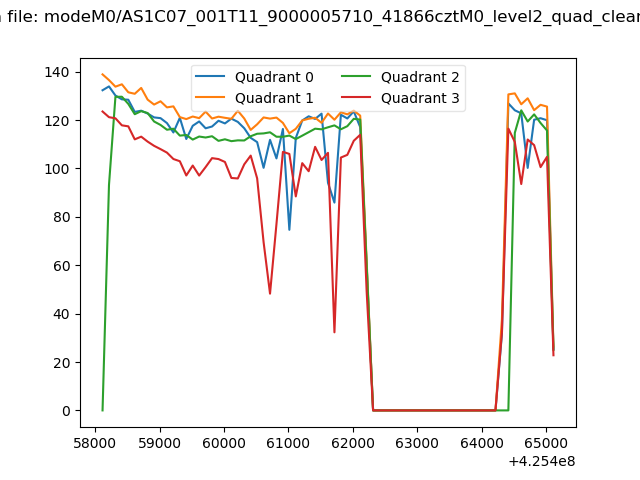 |
|
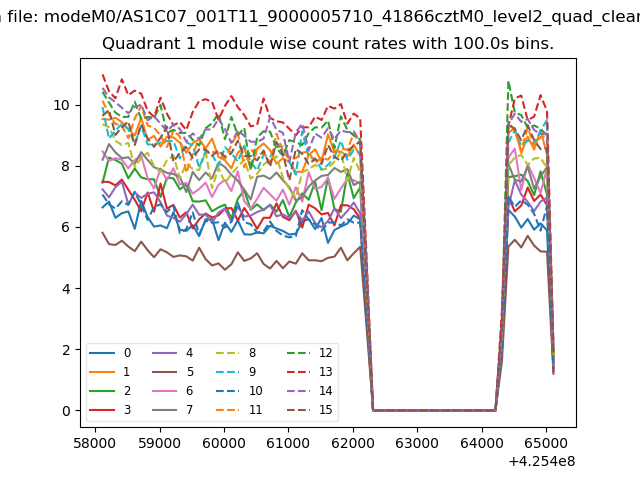
| Module-wise count rates for Quadrant A Data is divided into 100 sec bins |
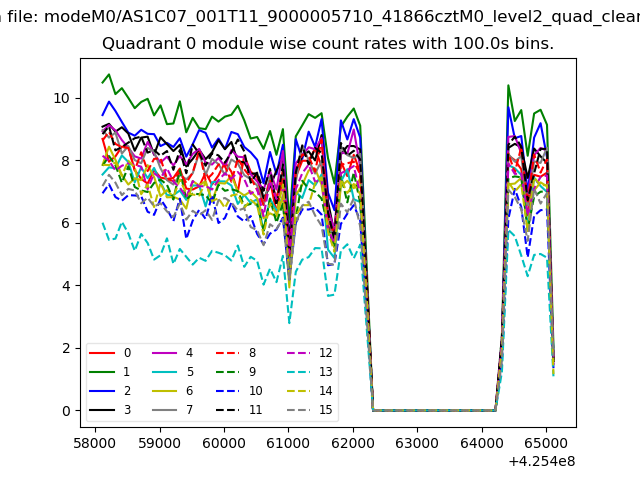 |
 |
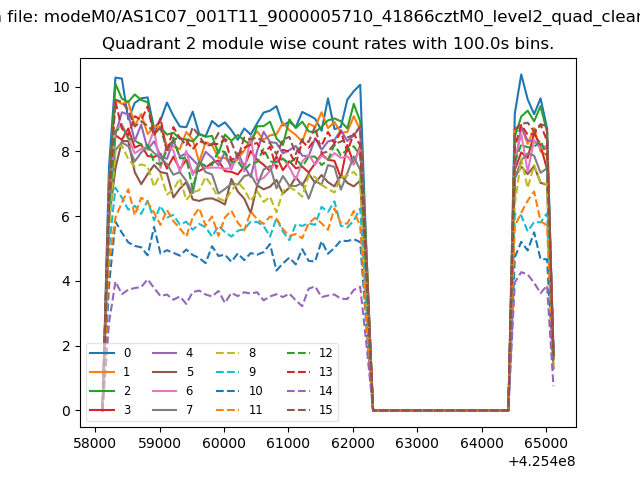
| Module-wise count rates for Quadrant B Data is divided into 100 sec bins |
 |
 |
| Module-wise count rates for Quadrant C Data is divided into 100 sec bins |
 |
 |
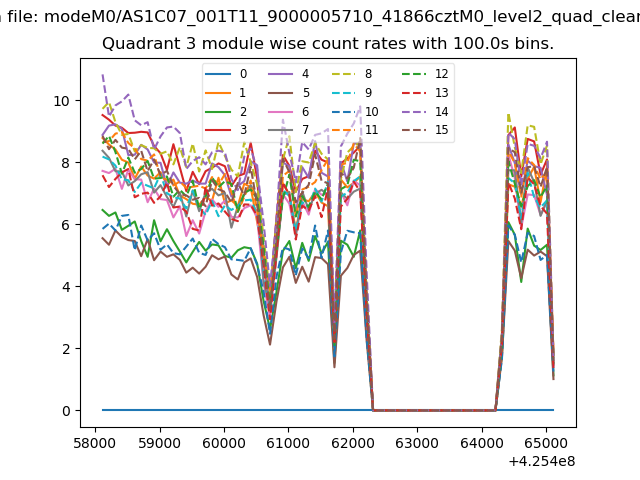
| Module-wise count rates for Quadrant D Data is divided into 100 sec bins |
 |
 |
| Parameter | Plot |
|---|---|
| CZT HV Monitor | 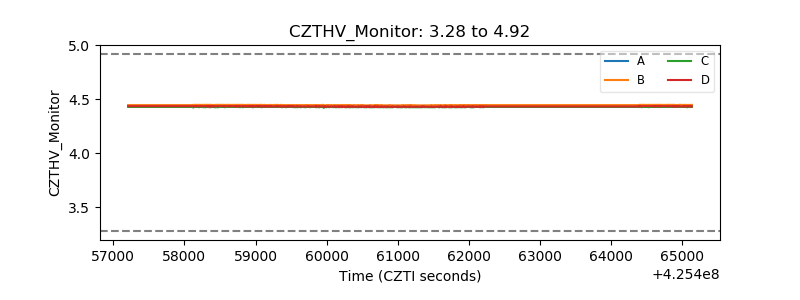 |
| D_VDD | 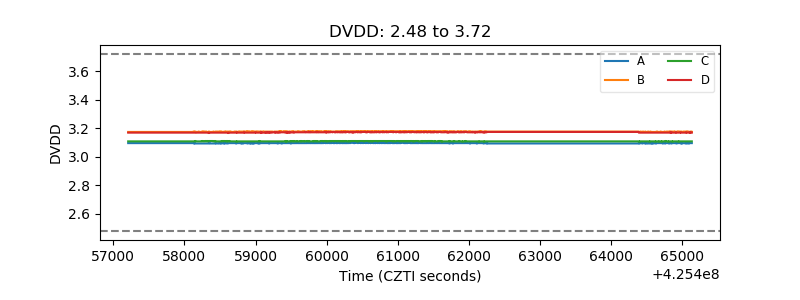 |
| Temperature 1 | 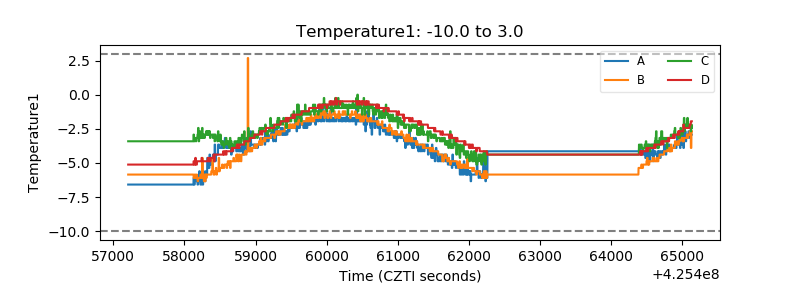 |
| Veto HV Monitor | 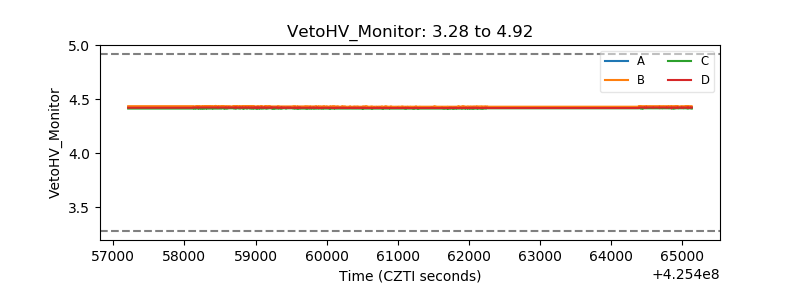 |
| Veto LLD | 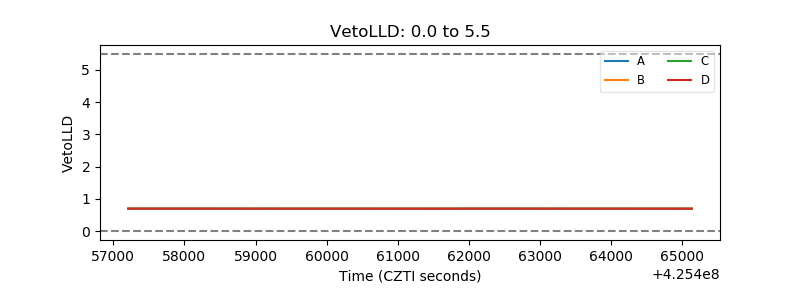 |
| Alpha Counter | 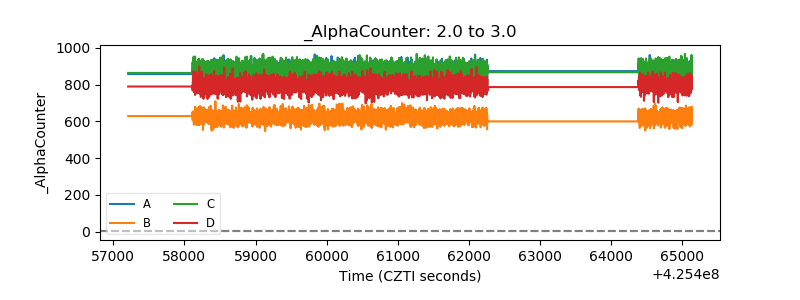 |
| _CPM_Rate | 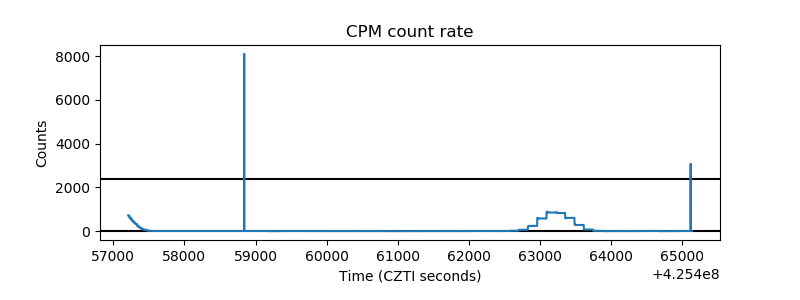 |
| CZT Counter | 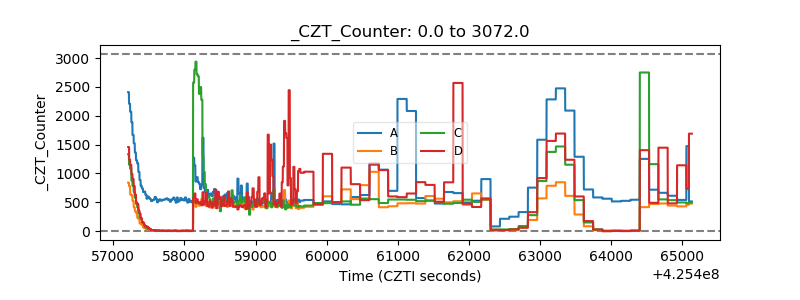 |
| +2.5 Volts monitor | 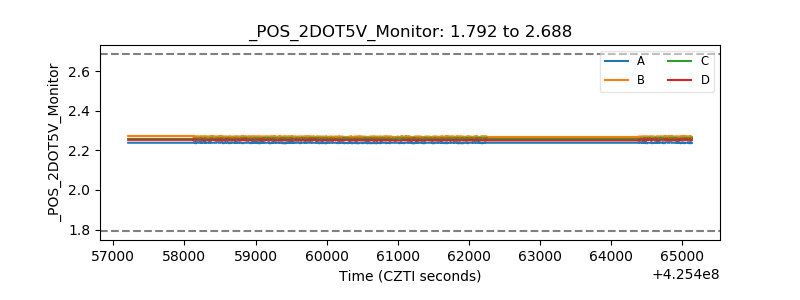 |
| +5 Volts monitor | 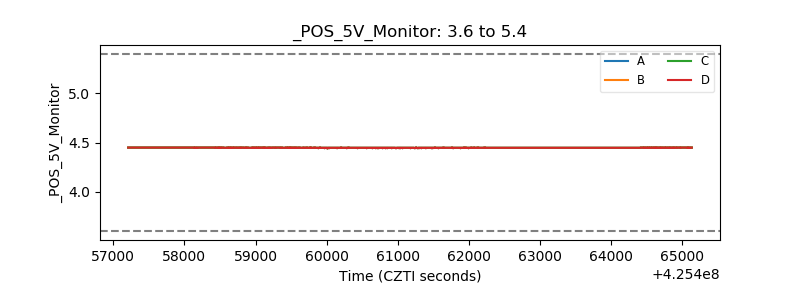 |
| _ROLL_ROT | 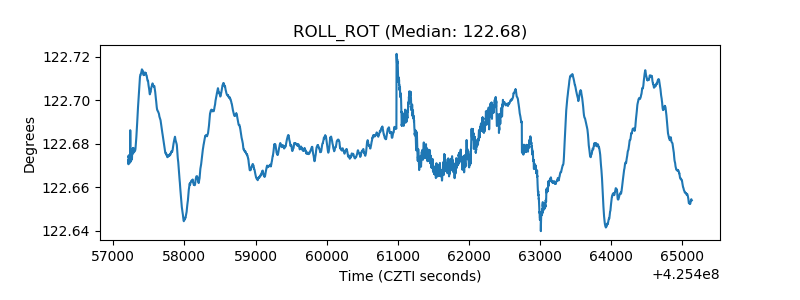 |
| _Roll_DEC | 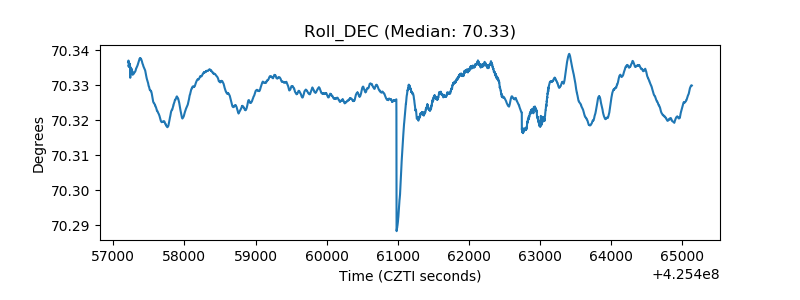 |
| _Roll_RA | 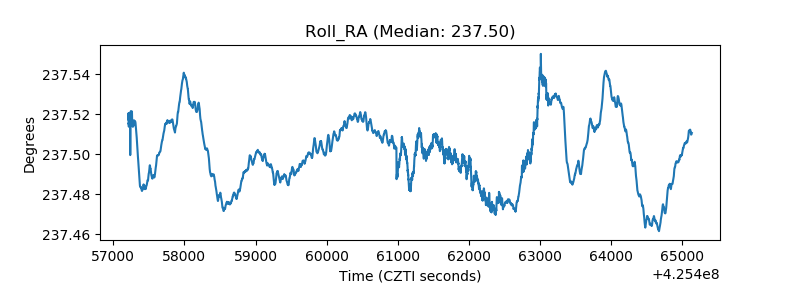 |
| Veto Counter | 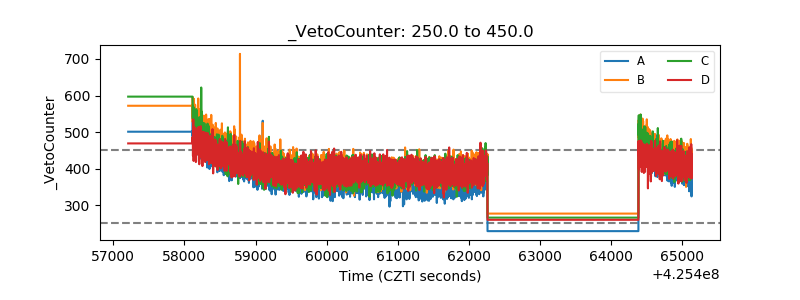 |