| Param | Original file | Final file |
|---|---|---|
| Filename | modeM0/AS1C07_001T11_9000005710_41867cztM0_level2.fits | modeM0/AS1C07_001T11_9000005710_41867cztM0_level2_quad_clean.evt |
| Size (bytes) | 363,686,400 | 81,656,640 |
| Size | 346.8 MB | 77.9 MB |
| Events in quadrant A | 3,851,472 | 556,744 |
| Events in quadrant B | 2,328,910 | 583,438 |
| Events in quadrant C | 2,939,300 | 519,518 |
| Events in quadrant D | 3,966,307 | 473,712 |
| Mode SS | |||
|---|---|---|---|
| Quadrant | BADHDUFLAG | Total packets | Discarded packets |
| A | 0 | 98 | 0 |
| B | 0 | 98 | 0 |
| C | 0 | 98 | 0 |
| D | 0 | 98 | 0 |
| Mode M0 | |||
|---|---|---|---|
| Quadrant | BADHDUFLAG | Total packets | Discarded packets |
| A | 0 | 14523 | 2 |
| B | 0 | 10115 | 2 |
| C | 0 | 11644 | 2 |
| D | 0 | 15053 | 2 |
| Mode M9 | |||
|---|---|---|---|
| Quadrant | BADHDUFLAG | Total packets | Discarded packets |
| A | 0 | 24 | 0 |
| B | 0 | 24 | 0 |
| C | 0 | 25 | 0 |
| D | 0 | 25 | 0 |
| Quadrant | Total seconds | Saturated seconds | Saturation percentage |
|---|---|---|---|
| A | 4837 | 255 | 5.271863% |
| B | 4837 | 12 | 0.248088% |
| C | 4837 | 263 | 5.437254% |
| D | 4837 | 454 | 9.385983% |
Noise dominated data is calculated using 1-second bins in cleaned event files. If a bin has >2000 counts, and if more than 50% of those come from <1% of pixels, then it is considered to be noise-dominated and hence unusable.
| Quadrant | # 1 sec bins | Bins with >0 counts | Bins with >2000 counts | High rate bins dominated by noise | Noise dominated (total time) | Noise dominated (detector-on time) | Marked lightcurve |
|---|---|---|---|---|---|---|---|
| A | 6989 | 4838 | 150 | 150 | 2.15% | 3.10% | 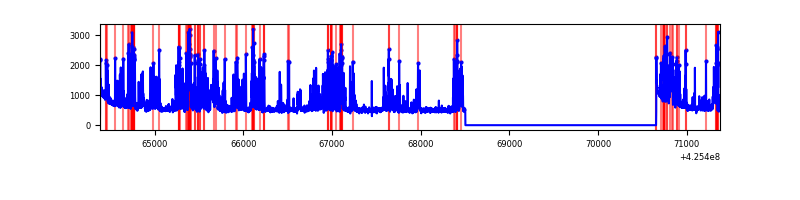 |
| B | 6989 | 4838 | 6 | 6 | 0.09% | 0.12% | 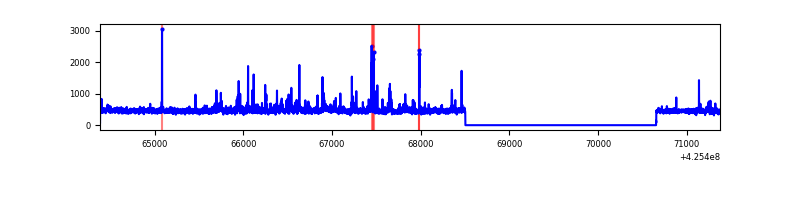 |
| C | 6989 | 4838 | 263 | 263 | 3.76% | 5.44% | 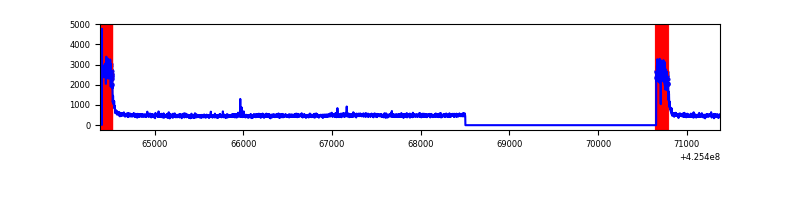 |
| D | 6989 | 4838 | 373 | 373 | 5.34% | 7.71% | 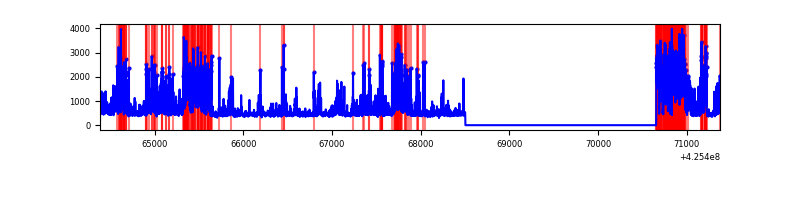 |
Top three noisy pixels from each quadrant. If the there are fewer than three noisy pixels in the level2.evt file, extra rows are filled as -1
| Pixel properties | Quadrant properties | ||||||
|---|---|---|---|---|---|---|---|
| Quadrant | DetID | PixID | Counts | Sigma | Mean | Median | Sigma |
| A | 14 | 24 | 1186592 | 11105.37 | 531 | 521 | 106.8 |
| A | 10 | 83 | 535823 | 5012.12 | 531 | 521 | 106.8 |
| A | 4 | 0 | 66022 | 613.3 | 531 | 521 | 106.8 |
| B | 5 | 255 | 50262 | 495.75 | 533 | 519 | 100.3 |
| B | 0 | 245 | 49706 | 490.21 | 533 | 519 | 100.3 |
| B | 3 | 112 | 42416 | 417.56 | 533 | 519 | 100.3 |
| C | 0 | 10 | 796836 | 6870.85 | 498 | 501 | 115.9 |
| C | 15 | 214 | 192937 | 1660.35 | 498 | 501 | 115.9 |
| C | 15 | 111 | 4057 | 30.68 | 498 | 501 | 115.9 |
| D | 13 | 249 | 852537 | 7020.38 | 502 | 488 | 121.4 |
| D | 12 | 79 | 593689 | 4887.63 | 502 | 488 | 121.4 |
| D | 2 | 249 | 267575 | 2200.64 | 502 | 488 | 121.4 |
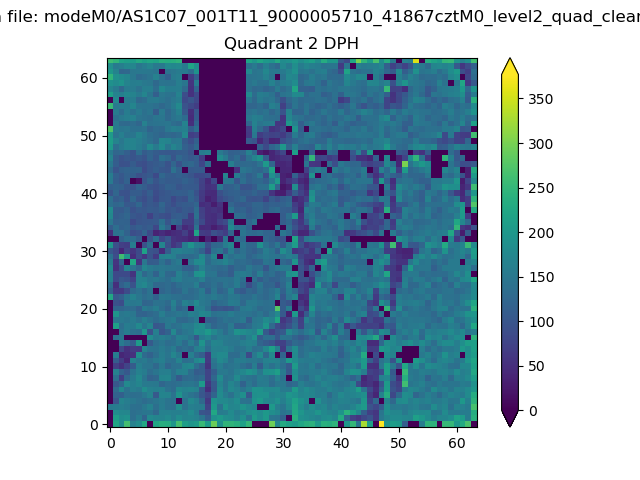
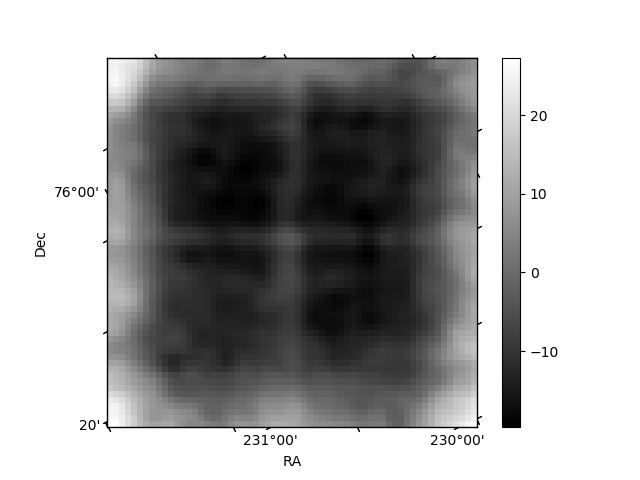
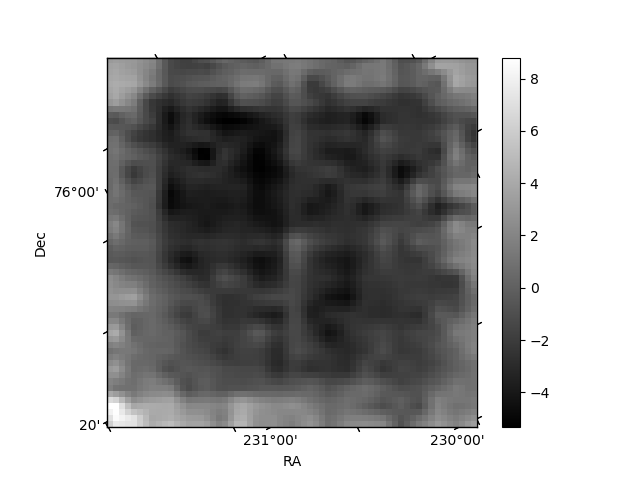
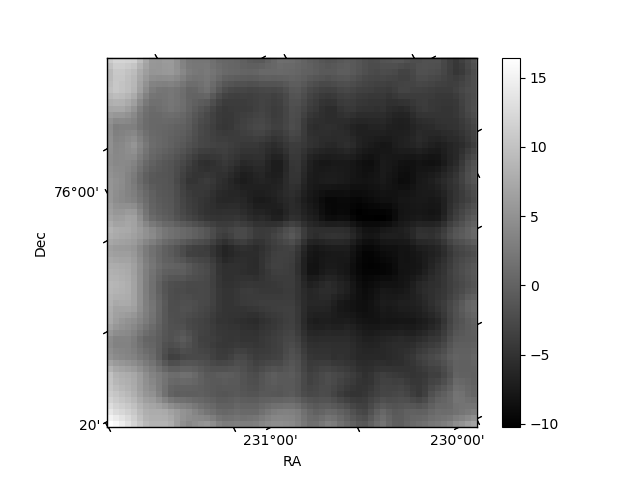
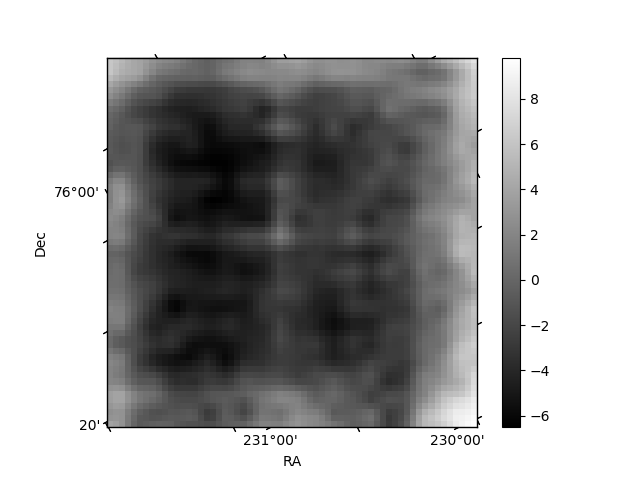
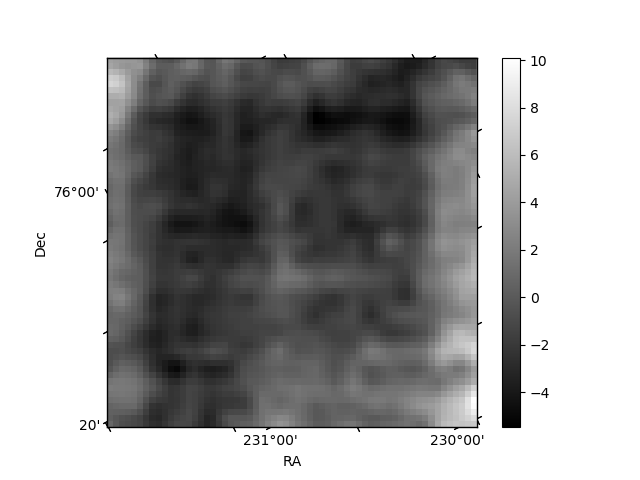
Histogram calculated using DETX and DETY for each event in the final _common_clean file
| Quadrant A | 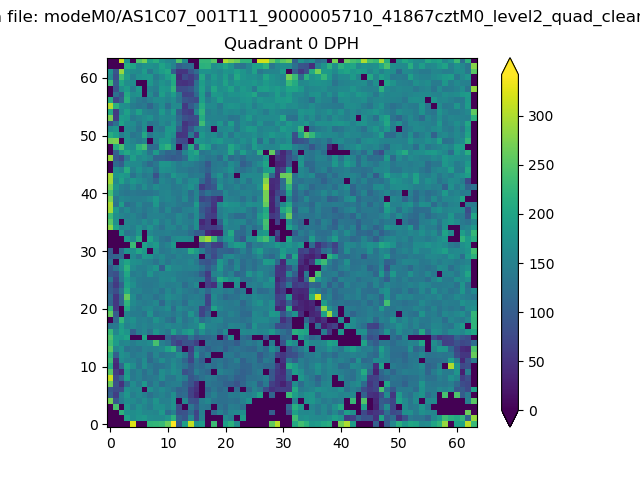 |
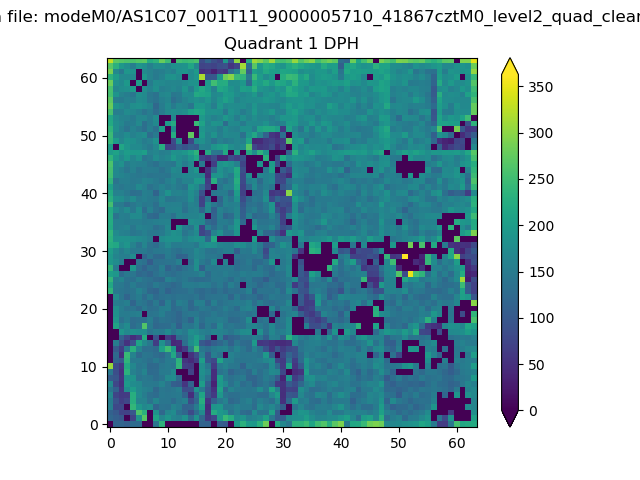 |
Quadrant B |
|---|---|---|---|
| Quadrant D | 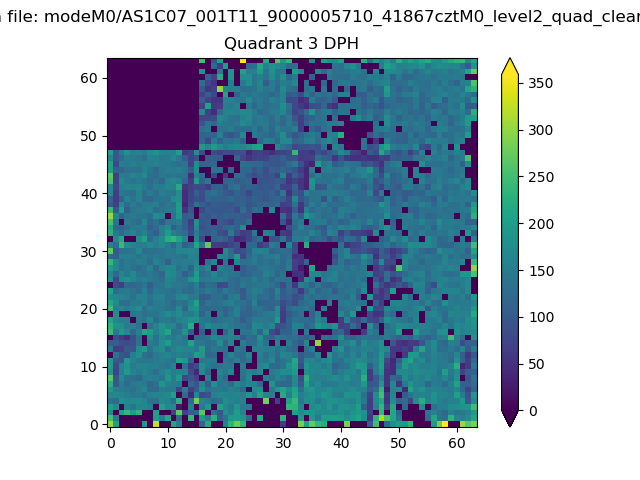 |
 |
Quadrant C |
| Plot type | Count rate plots | Images |
|---|---|---|
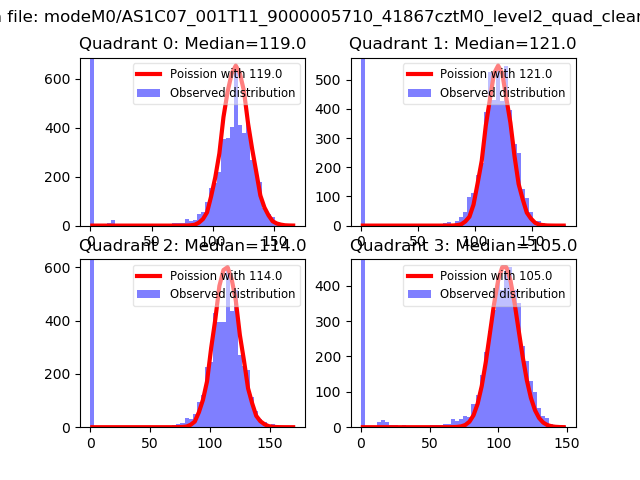
| Comparison with Poisson distribution Blue bars denote a histogram of data divided into 1 sec bins. Red curve is a Poisson curve with rate = median count rate of data. |
 |
 |
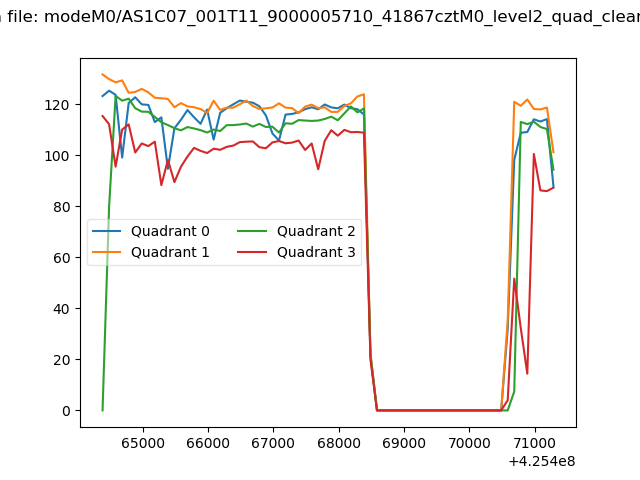
| Quadrant-wise count rates Data is divided into 100 sec bins |
 |
|
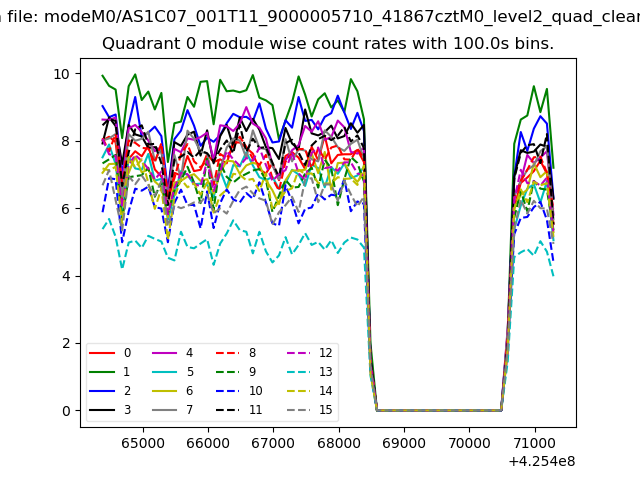
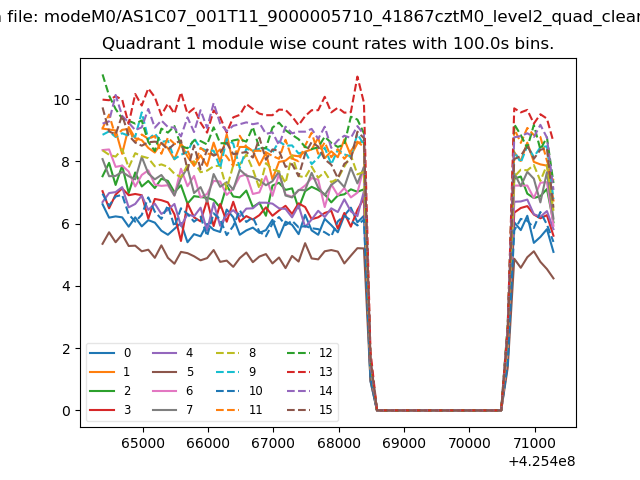
| Module-wise count rates for Quadrant A Data is divided into 100 sec bins |
 |
 |
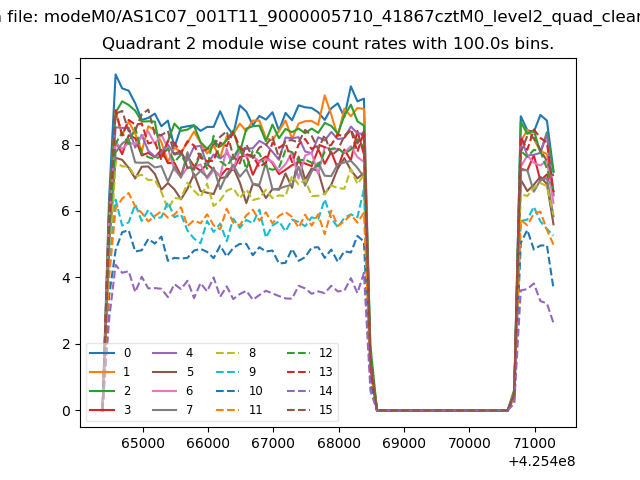
| Module-wise count rates for Quadrant B Data is divided into 100 sec bins |
 |
 |
| Module-wise count rates for Quadrant C Data is divided into 100 sec bins |
 |
 |
| Module-wise count rates for Quadrant D Data is divided into 100 sec bins |
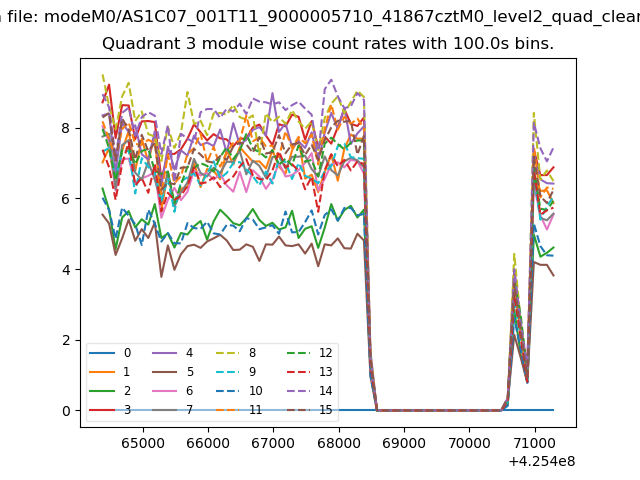 |
 |
| Parameter | Plot |
|---|---|
| CZT HV Monitor | 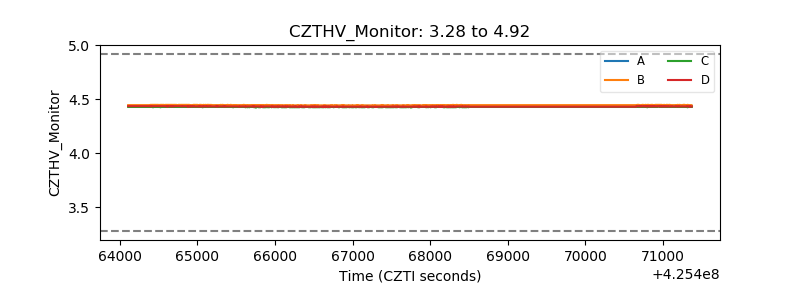 |
| D_VDD | 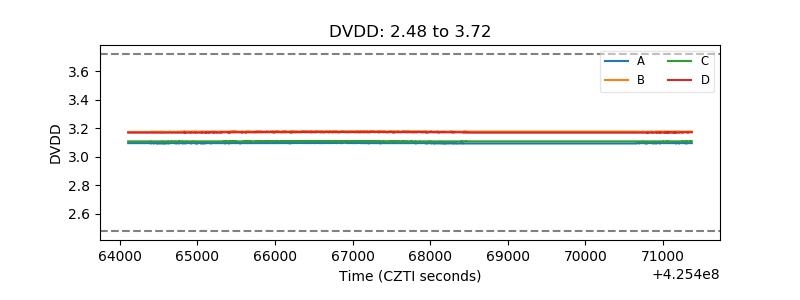 |
| Temperature 1 | 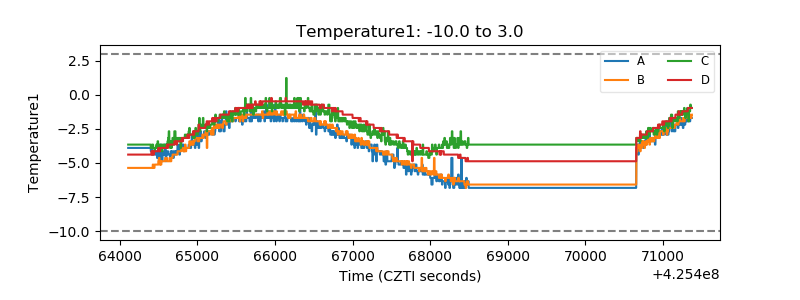 |
| Veto HV Monitor | 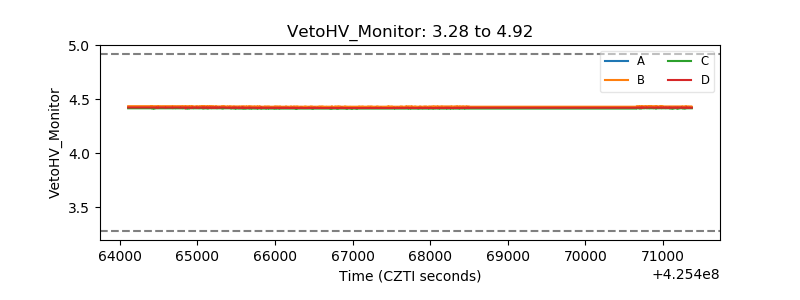 |
| Veto LLD | 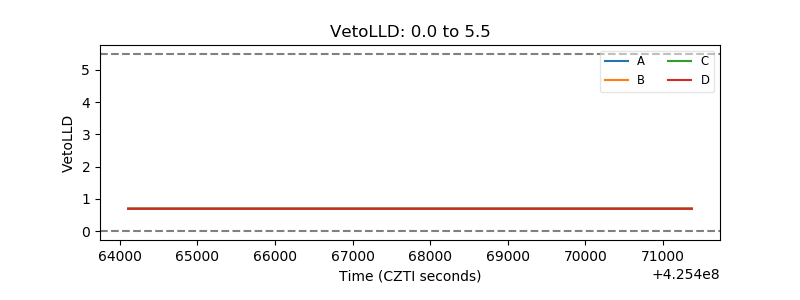 |
| Alpha Counter | 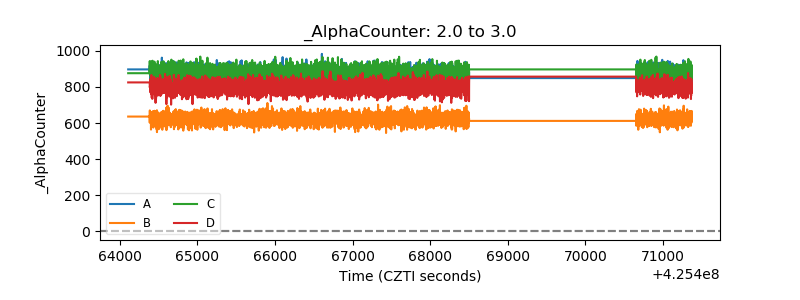 |
| _CPM_Rate | 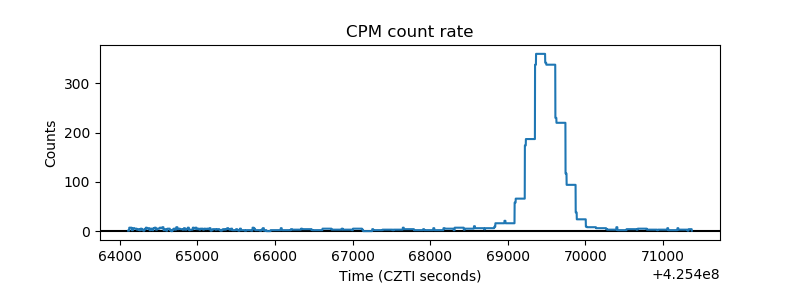 |
| CZT Counter | 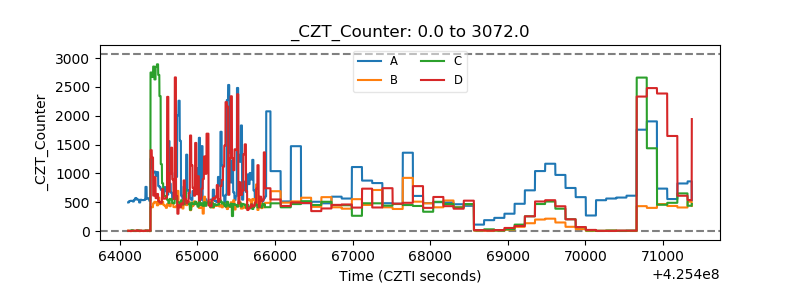 |
| +2.5 Volts monitor |  |
| +5 Volts monitor | 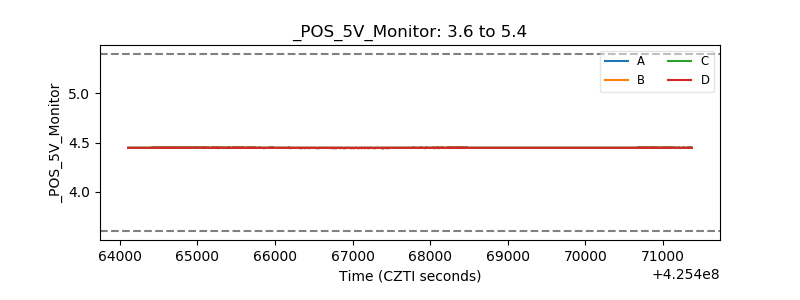 |
| _ROLL_ROT | 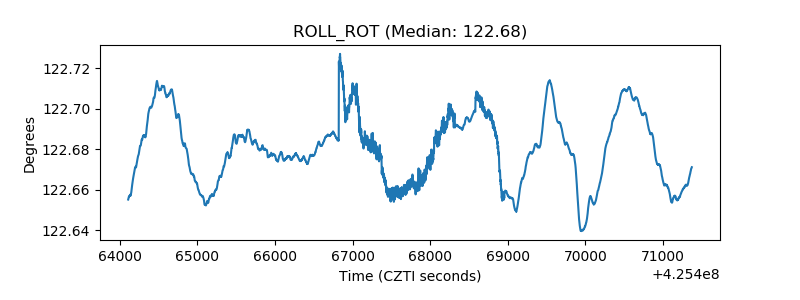 |
| _Roll_DEC | 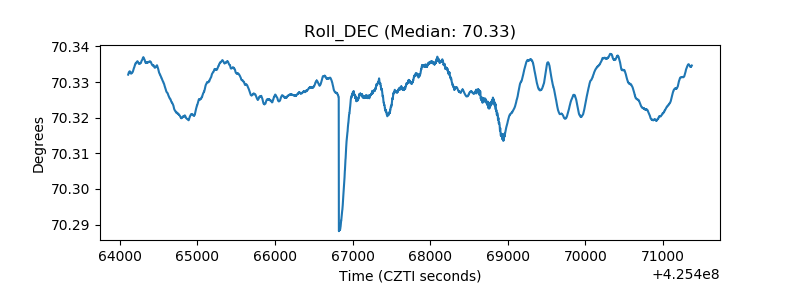 |
| _Roll_RA | 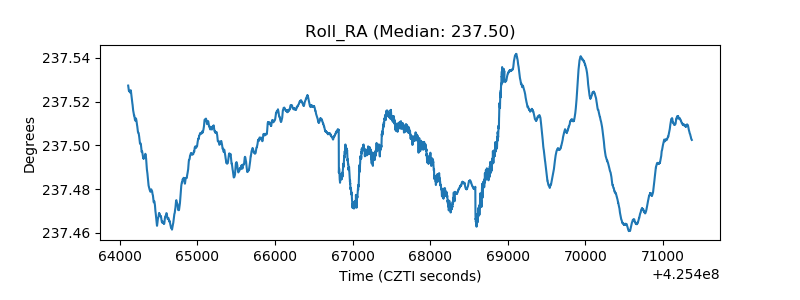 |
| Veto Counter | 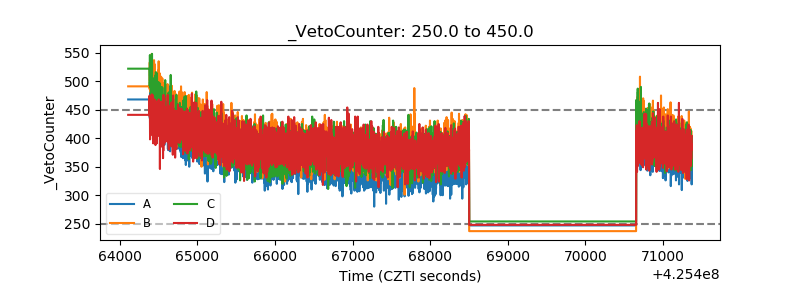 |