| Param | Original file | Final file |
|---|---|---|
| Filename | modeM0/AS1C07_001T11_9000005710_41868cztM0_level2.fits | modeM0/AS1C07_001T11_9000005710_41868cztM0_level2_quad_clean.evt |
| Size (bytes) | 417,372,480 | 84,182,400 |
| Size | 398.0 MB | 80.3 MB |
| Events in quadrant A | 4,295,037 | 566,436 |
| Events in quadrant B | 3,088,811 | 594,666 |
| Events in quadrant C | 3,201,198 | 541,798 |
| Events in quadrant D | 4,458,072 | 479,330 |
| Mode SS | |||
|---|---|---|---|
| Quadrant | BADHDUFLAG | Total packets | Discarded packets |
| A | 0 | 108 | 0 |
| B | 0 | 108 | 0 |
| C | 0 | 108 | 0 |
| D | 0 | 108 | 0 |
| Mode M0 | |||
|---|---|---|---|
| Quadrant | BADHDUFLAG | Total packets | Discarded packets |
| A | 0 | 16077 | 2 |
| B | 0 | 12701 | 2 |
| C | 0 | 12644 | 2 |
| D | 0 | 16909 | 2 |
| Mode M9 | |||
|---|---|---|---|
| Quadrant | BADHDUFLAG | Total packets | Discarded packets |
| A | 0 | 24 | 0 |
| B | 0 | 24 | 0 |
| C | 0 | 25 | 0 |
| D | 0 | 25 | 0 |
| Quadrant | Total seconds | Saturated seconds | Saturation percentage |
|---|---|---|---|
| A | 5230 | 347 | 6.634799% |
| B | 5230 | 73 | 1.395793% |
| C | 5230 | 264 | 5.047801% |
| D | 5230 | 601 | 11.491396% |
Noise dominated data is calculated using 1-second bins in cleaned event files. If a bin has >2000 counts, and if more than 50% of those come from <1% of pixels, then it is considered to be noise-dominated and hence unusable.
| Quadrant | # 1 sec bins | Bins with >0 counts | Bins with >2000 counts | High rate bins dominated by noise | Noise dominated (total time) | Noise dominated (detector-on time) | Marked lightcurve |
|---|---|---|---|---|---|---|---|
| A | 7262 | 5231 | 236 | 236 | 3.25% | 4.51% | 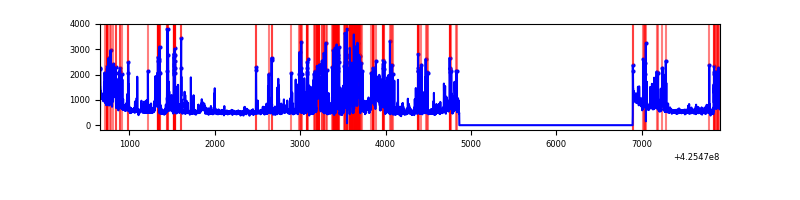 |
| B | 7262 | 5231 | 58 | 58 | 0.80% | 1.11% | 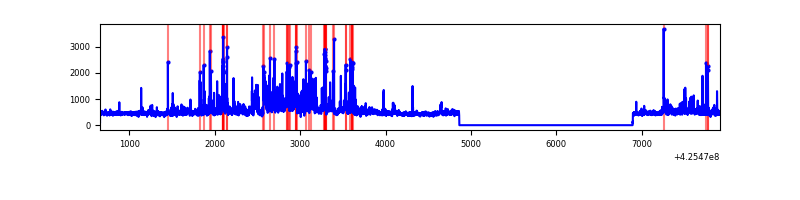 |
| C | 7262 | 5231 | 258 | 258 | 3.55% | 4.93% | 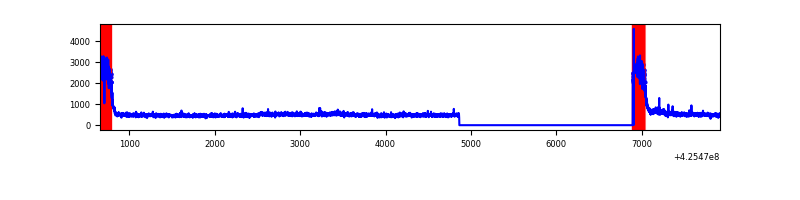 |
| D | 7262 | 5231 | 482 | 482 | 6.64% | 9.21% | 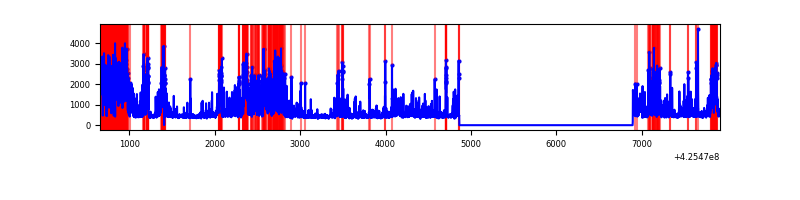 |
Top three noisy pixels from each quadrant. If the there are fewer than three noisy pixels in the level2.evt file, extra rows are filled as -1
| Pixel properties | Quadrant properties | ||||||
|---|---|---|---|---|---|---|---|
| Quadrant | DetID | PixID | Counts | Sigma | Mean | Median | Sigma |
| A | 14 | 24 | 1516799 | 13477.58 | 553 | 543 | 112.5 |
| A | 10 | 83 | 572599 | 5084.85 | 553 | 543 | 112.5 |
| A | 2 | 79 | 48925 | 430.05 | 553 | 543 | 112.5 |
| B | 5 | 255 | 464787 | 4389.44 | 556 | 540 | 105.8 |
| B | 0 | 156 | 143062 | 1347.54 | 556 | 540 | 105.8 |
| B | 0 | 190 | 66655 | 625.11 | 556 | 540 | 105.8 |
| C | 0 | 10 | 914493 | 7449.83 | 531 | 534 | 122.7 |
| C | 15 | 214 | 206772 | 1681.08 | 531 | 534 | 122.7 |
| C | 15 | 111 | 7280 | 54.99 | 531 | 534 | 122.7 |
| D | 13 | 249 | 838070 | 6499.65 | 526 | 512 | 128.9 |
| D | 12 | 79 | 431595 | 3345.31 | 526 | 512 | 128.9 |
| D | 12 | 233 | 389819 | 3021.12 | 526 | 512 | 128.9 |
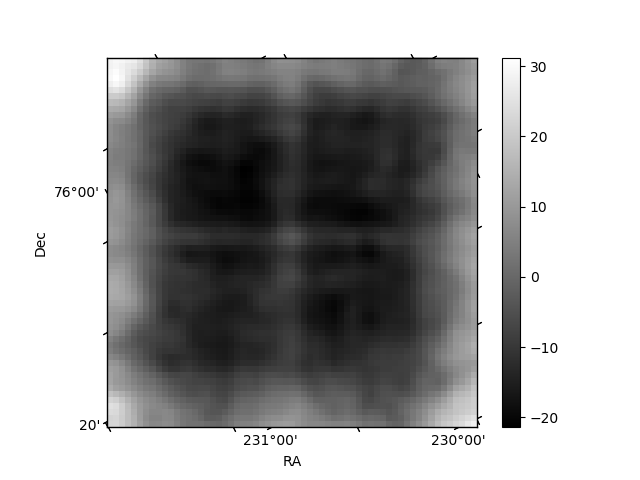
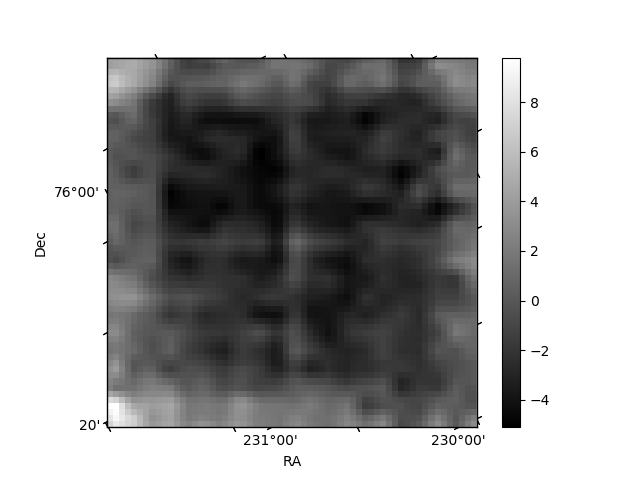
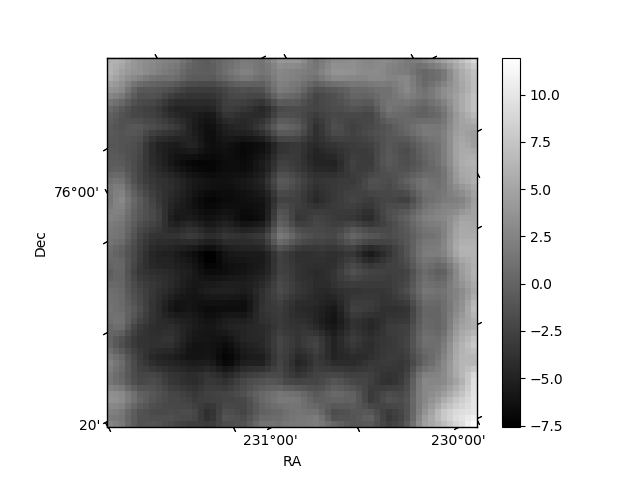
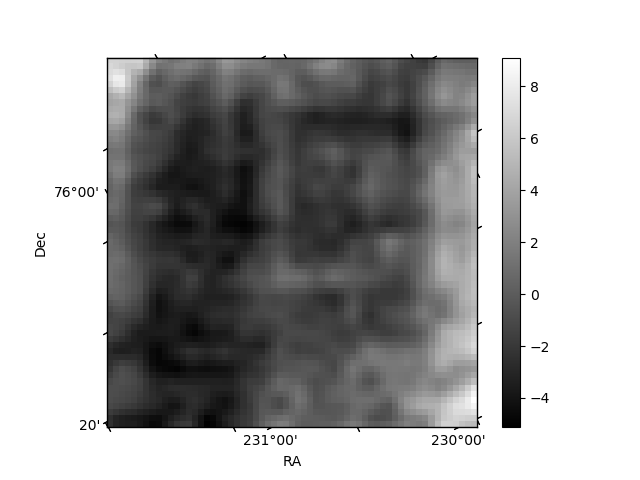
Histogram calculated using DETX and DETY for each event in the final _common_clean file
| Quadrant A | 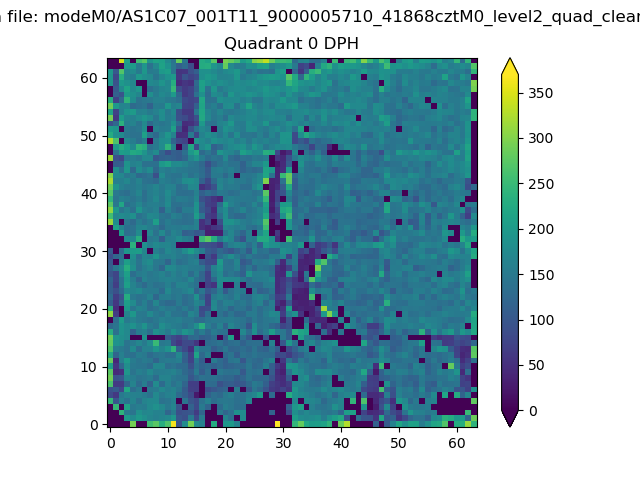 |
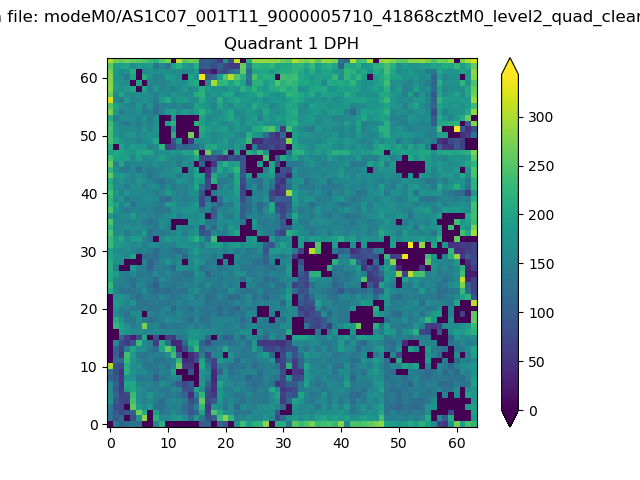 |
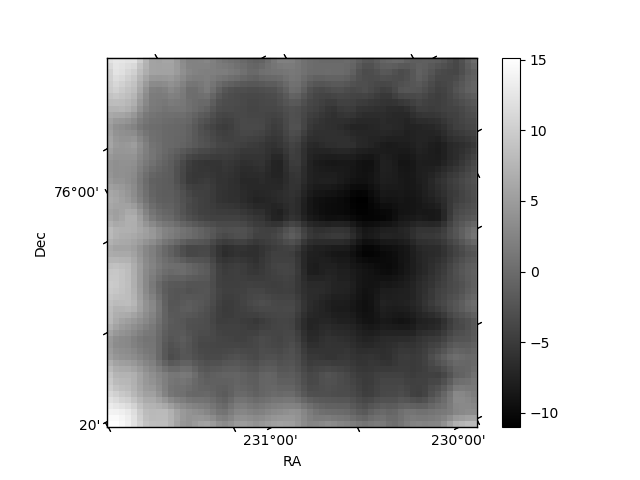
Quadrant B |
|---|---|---|---|
| Quadrant D | 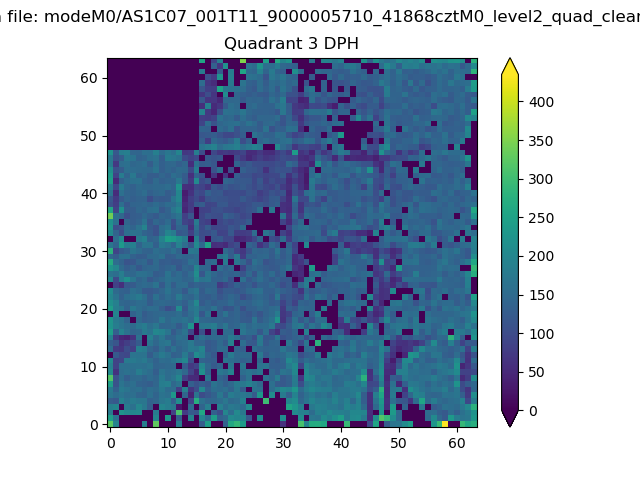 |
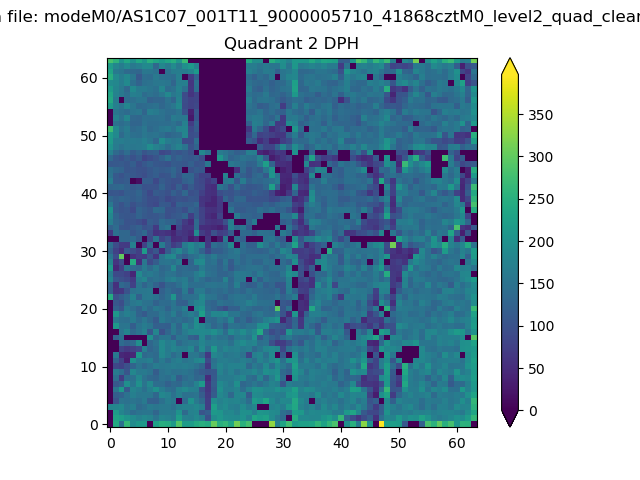 |
Quadrant C |
| Plot type | Count rate plots | Images |
|---|---|---|
| Comparison with Poisson distribution Blue bars denote a histogram of data divided into 1 sec bins. Red curve is a Poisson curve with rate = median count rate of data. |
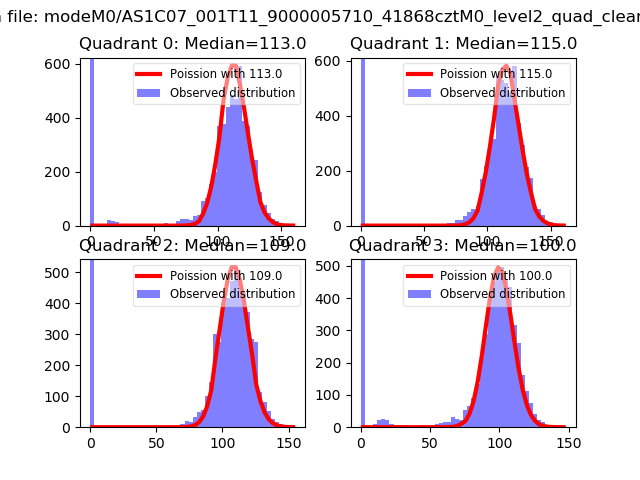 |
 |
| Quadrant-wise count rates Data is divided into 100 sec bins |
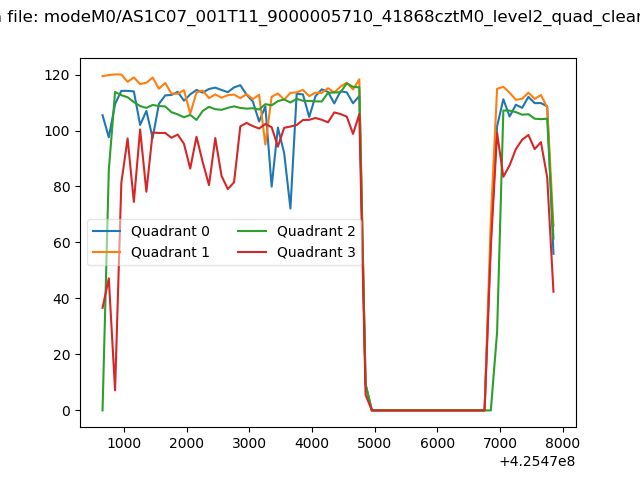 |
|
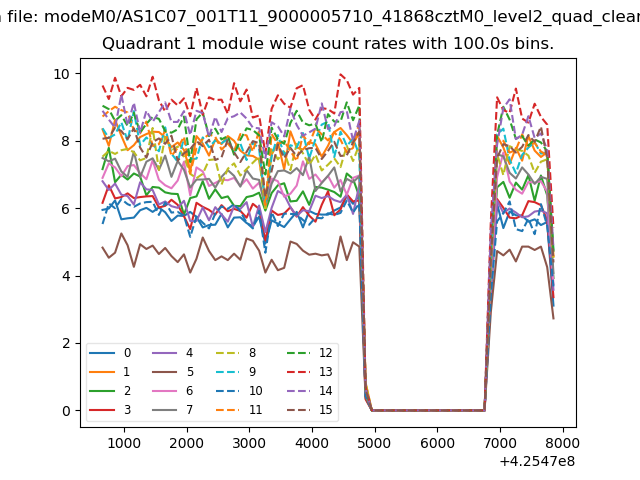
| Module-wise count rates for Quadrant A Data is divided into 100 sec bins |
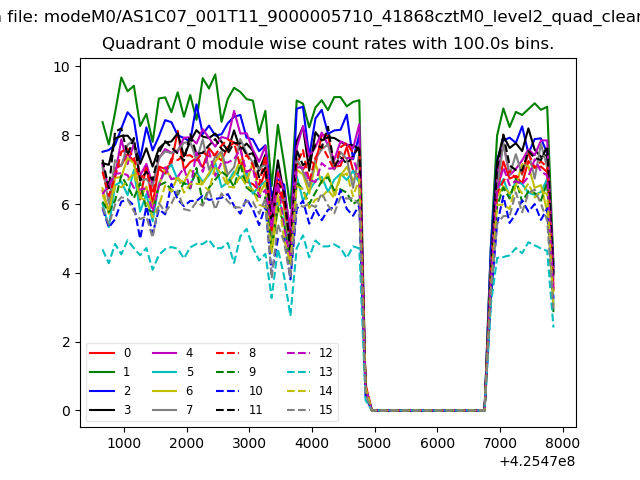 |
 |
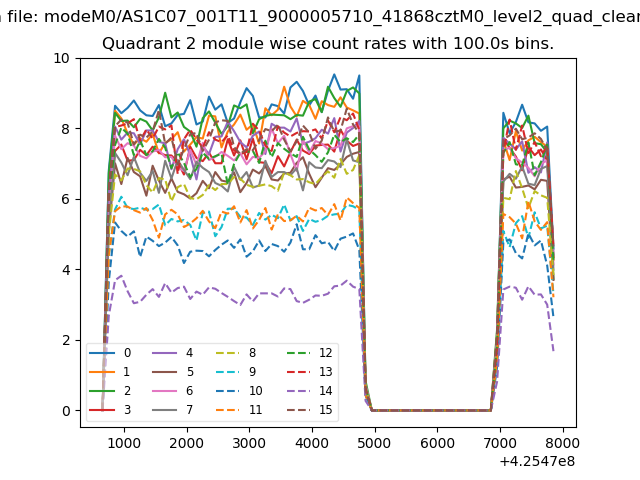
| Module-wise count rates for Quadrant B Data is divided into 100 sec bins |
 |
 |
| Module-wise count rates for Quadrant C Data is divided into 100 sec bins |
 |
 |
| Module-wise count rates for Quadrant D Data is divided into 100 sec bins |
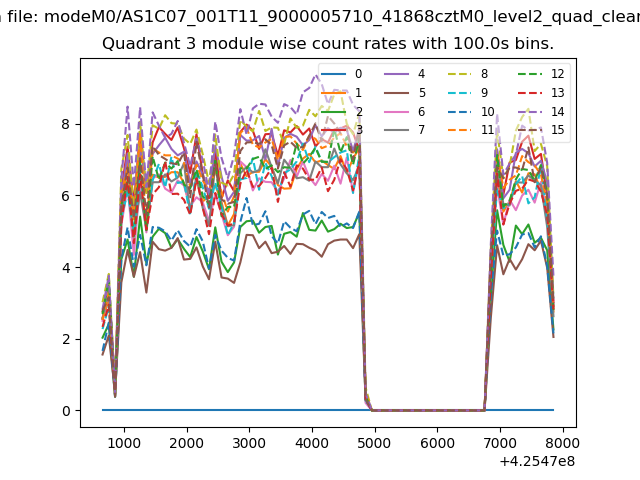 |
 |
| Parameter | Plot |
|---|---|
| CZT HV Monitor | 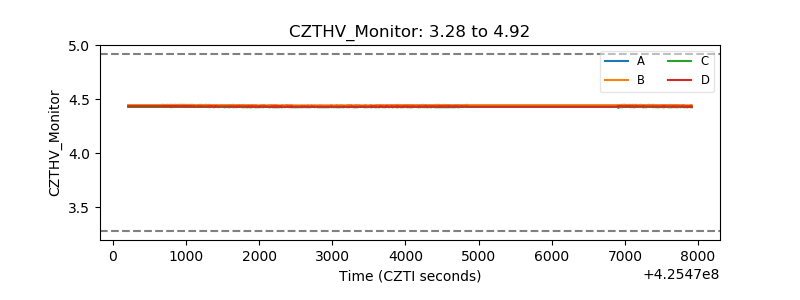 |
| D_VDD | 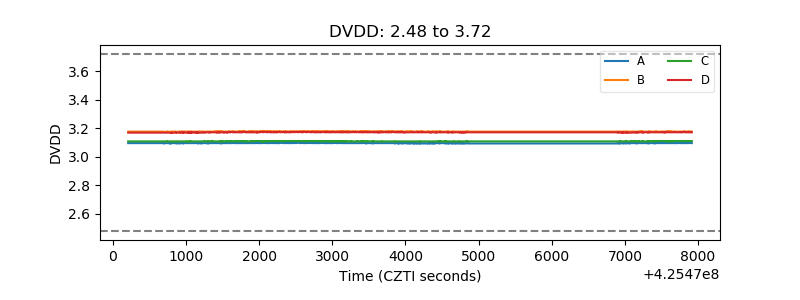 |
| Temperature 1 | 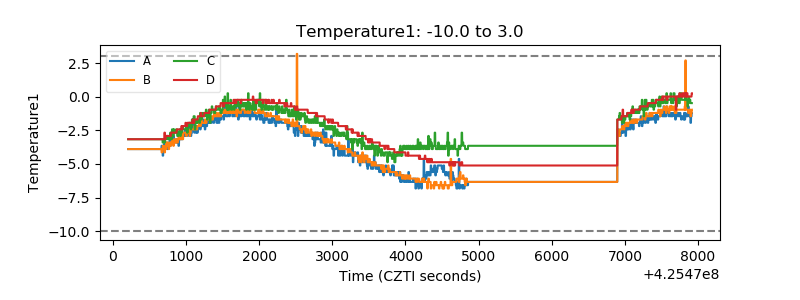 |
| Veto HV Monitor | 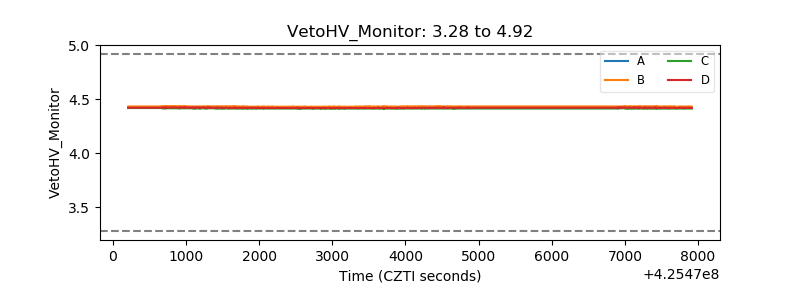 |
| Veto LLD | 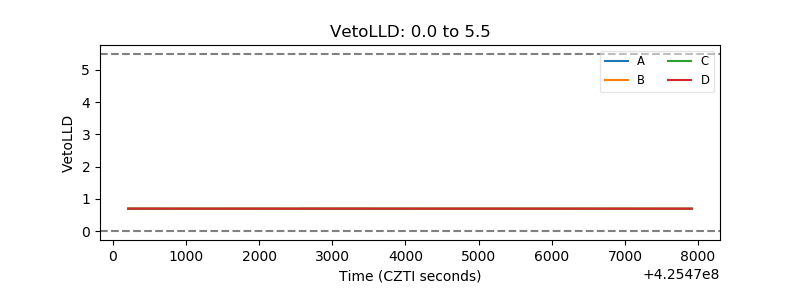 |
| Alpha Counter | 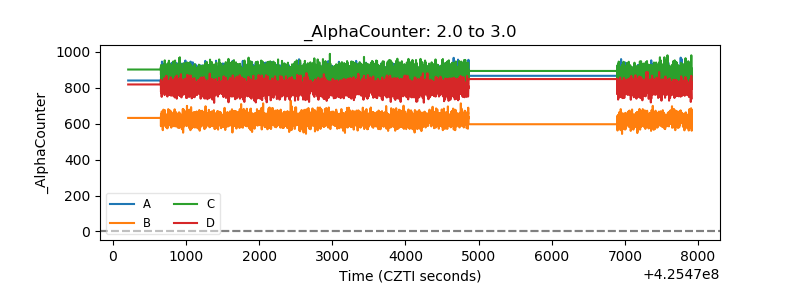 |
| _CPM_Rate |  |
| CZT Counter | 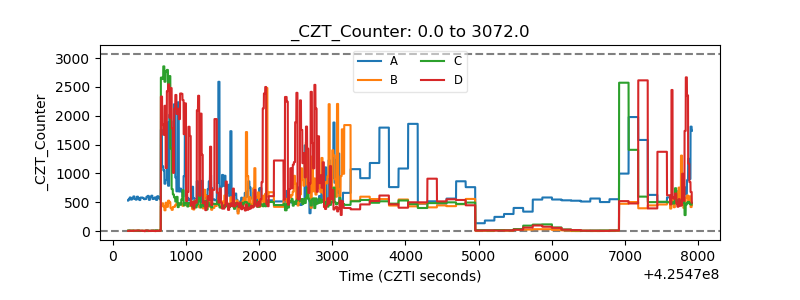 |
| +2.5 Volts monitor | 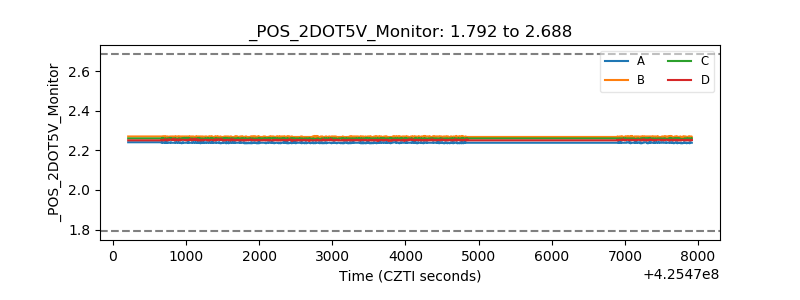 |
| +5 Volts monitor | 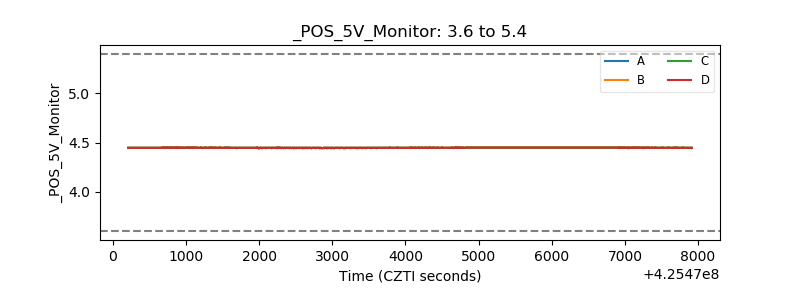 |
| _ROLL_ROT | 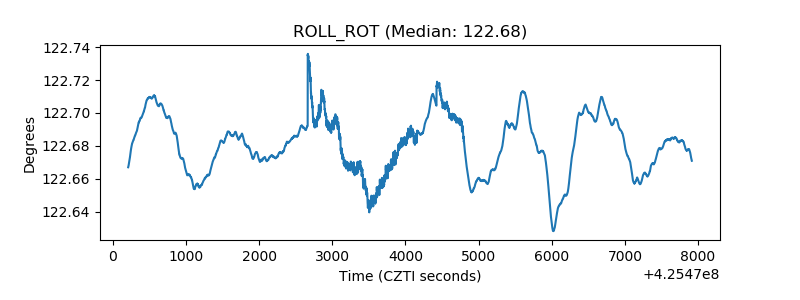 |
| _Roll_DEC | 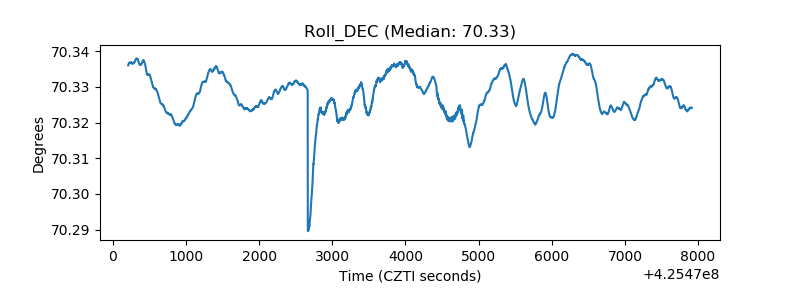 |
| _Roll_RA | 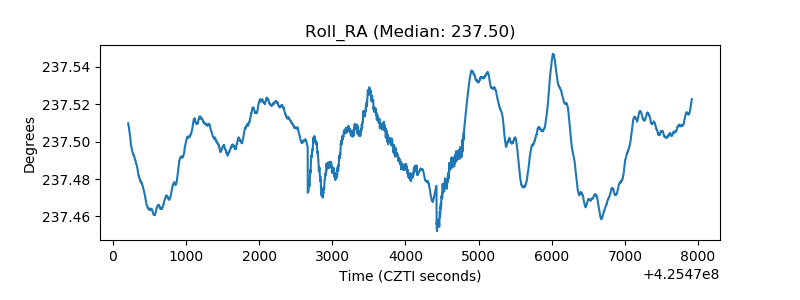 |
| Veto Counter | 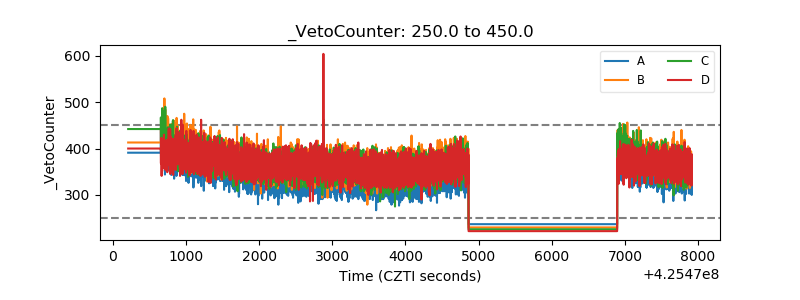 |