| Param | Original file | Final file |
|---|---|---|
| Filename | modeM0/AS1C07_001T11_9000005710_41869cztM0_level2.fits | modeM0/AS1C07_001T11_9000005710_41869cztM0_level2_quad_clean.evt |
| Size (bytes) | 128,877,120 | 23,601,600 |
| Size | 122.9 MB | 22.5 MB |
| Events in quadrant A | 1,503,433 | 147,070 |
| Events in quadrant B | 782,349 | 165,922 |
| Events in quadrant C | 805,878 | 156,064 |
| Events in quadrant D | 1,559,957 | 134,829 |
| Mode SS | |||
|---|---|---|---|
| Quadrant | BADHDUFLAG | Total packets | Discarded packets |
| A | 0 | 30 | 0 |
| B | 0 | 30 | 0 |
| C | 0 | 30 | 0 |
| D | 0 | 30 | 0 |
| Mode M0 | |||
|---|---|---|---|
| Quadrant | BADHDUFLAG | Total packets | Discarded packets |
| A | 0 | 5437 | 0 |
| B | 0 | 3343 | 0 |
| C | 0 | 3283 | 0 |
| D | 0 | 5661 | 0 |
| Quadrant | Total seconds | Saturated seconds | Saturation percentage |
|---|---|---|---|
| A | 1495 | 225 | 15.050167% |
| B | 1495 | 11 | 0.735786% |
| C | 1495 | 4 | 0.267559% |
| D | 1495 | 187 | 12.508361% |
Noise dominated data is calculated using 1-second bins in cleaned event files. If a bin has >2000 counts, and if more than 50% of those come from <1% of pixels, then it is considered to be noise-dominated and hence unusable.
| Quadrant | # 1 sec bins | Bins with >0 counts | Bins with >2000 counts | High rate bins dominated by noise | Noise dominated (total time) | Noise dominated (detector-on time) | Marked lightcurve |
|---|---|---|---|---|---|---|---|
| A | 1495 | 1495 | 158 | 158 | 10.57% | 10.57% | 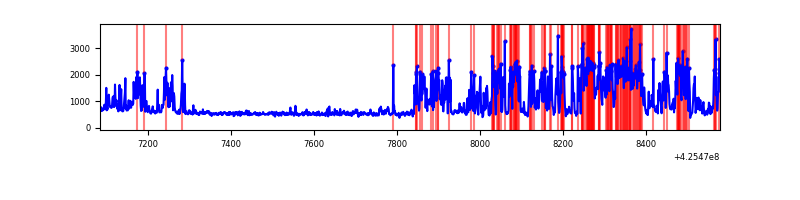 |
| B | 1495 | 1495 | 4 | 4 | 0.27% | 0.27% | 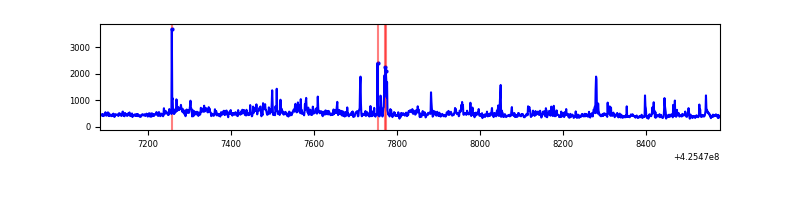 |
| C | 1495 | 1495 | 0 | 0 | 0.00% | 0.00% | 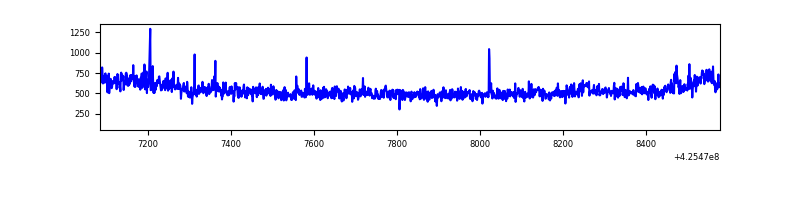 |
| D | 1495 | 1495 | 195 | 195 | 13.04% | 13.04% | 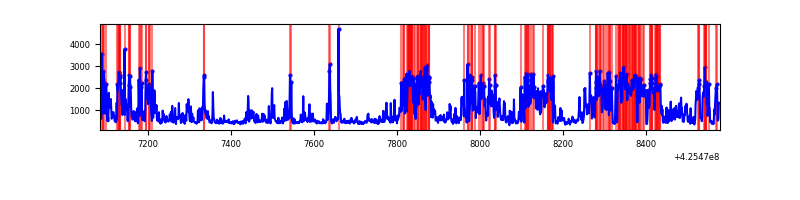 |
Top three noisy pixels from each quadrant. If the there are fewer than three noisy pixels in the level2.evt file, extra rows are filled as -1
| Pixel properties | Quadrant properties | ||||||
|---|---|---|---|---|---|---|---|
| Quadrant | DetID | PixID | Counts | Sigma | Mean | Median | Sigma |
| A | 14 | 24 | 738285 | 22116.44 | 153 | 150 | 33.4 |
| A | 10 | 83 | 145776 | 4363.32 | 153 | 150 | 33.4 |
| A | 2 | 79 | 19497 | 579.67 | 153 | 150 | 33.4 |
| B | 0 | 190 | 55930 | 1726.4 | 158 | 153 | 32.3 |
| B | 5 | 255 | 49091 | 1514.72 | 158 | 153 | 32.3 |
| B | 0 | 186 | 16550 | 507.52 | 158 | 153 | 32.3 |
| C | 0 | 10 | 129243 | 3439.88 | 155 | 155 | 37.5 |
| C | 15 | 214 | 62102 | 1650.74 | 155 | 155 | 37.5 |
| C | 15 | 111 | 4683 | 120.66 | 155 | 155 | 37.5 |
| D | 12 | 79 | 658550 | 16869.08 | 153 | 148 | 39.0 |
| D | 2 | 249 | 104657 | 2677.65 | 153 | 148 | 39.0 |
| D | 13 | 249 | 84187 | 2153.18 | 153 | 148 | 39.0 |
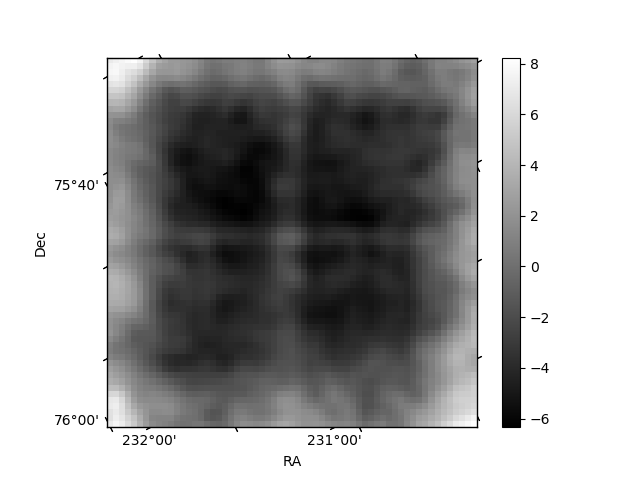
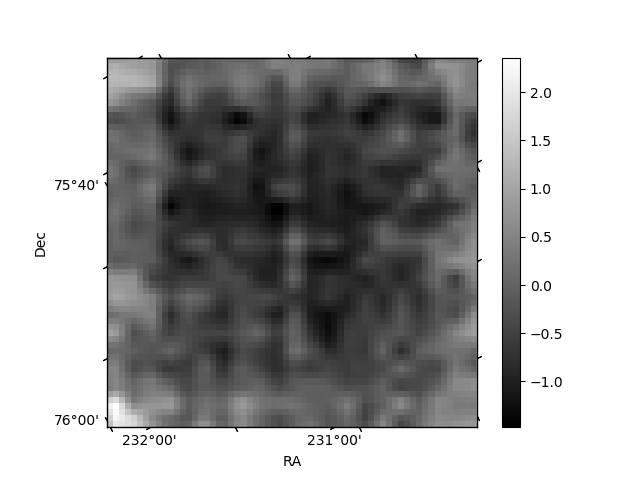
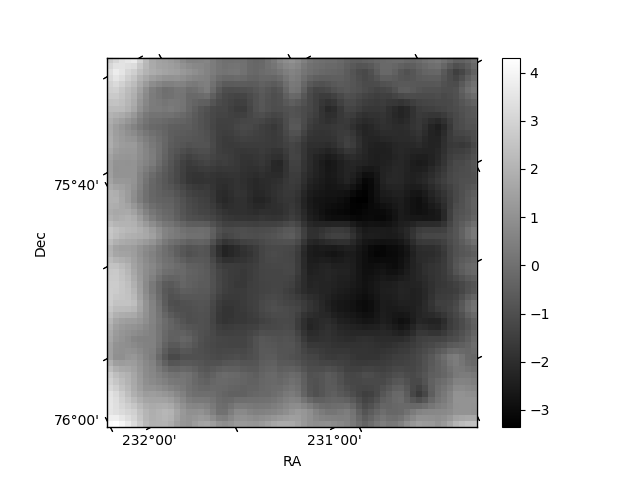
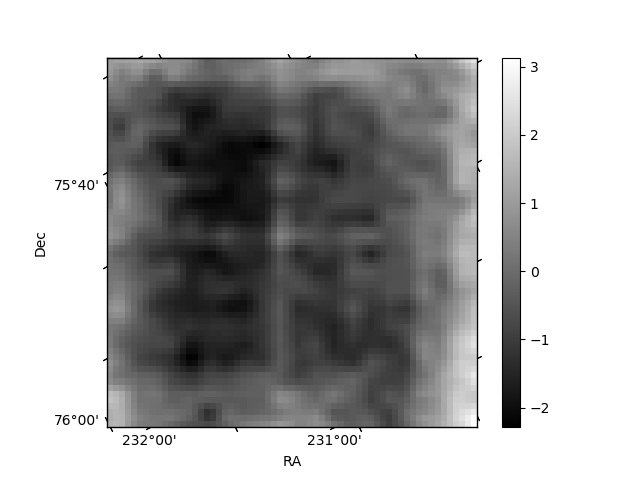
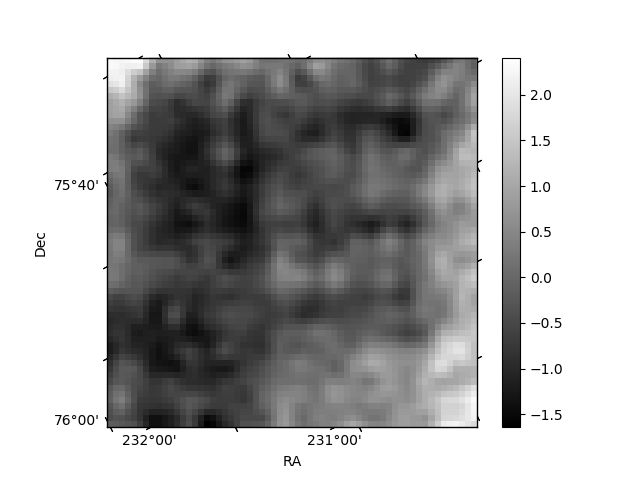
Histogram calculated using DETX and DETY for each event in the final _common_clean file
| Quadrant A | 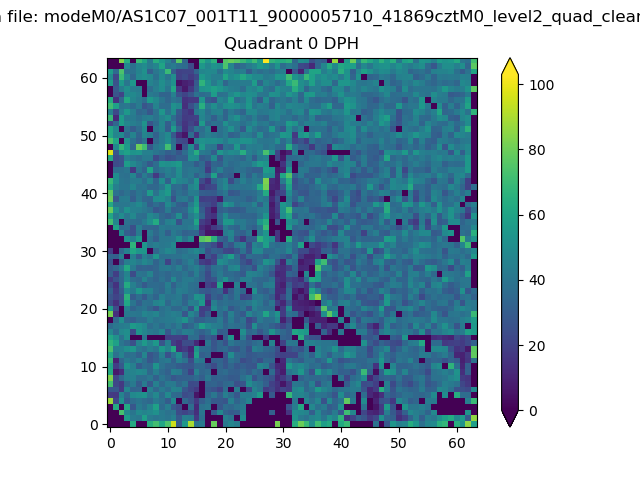 |
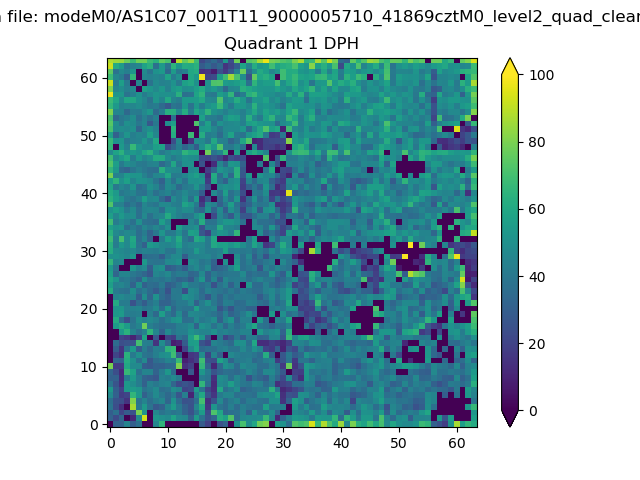 |
Quadrant B |
|---|---|---|---|
| Quadrant D | 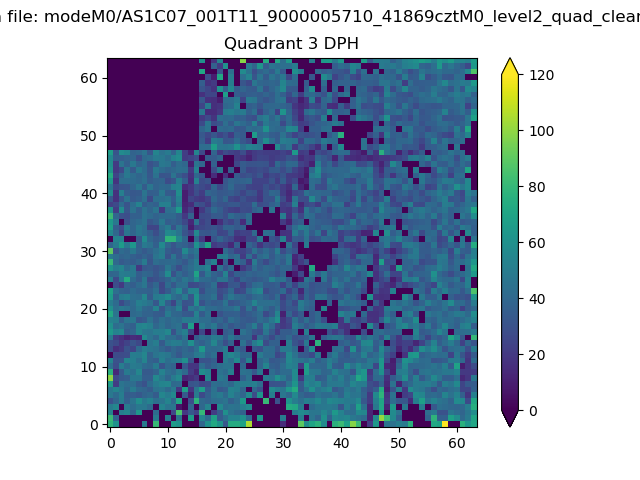 |
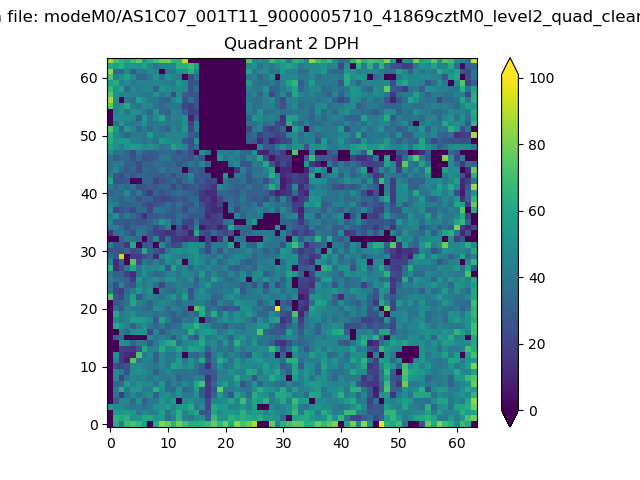 |
Quadrant C |
| Plot type | Count rate plots | Images |
|---|---|---|
| Comparison with Poisson distribution Blue bars denote a histogram of data divided into 1 sec bins. Red curve is a Poisson curve with rate = median count rate of data. |
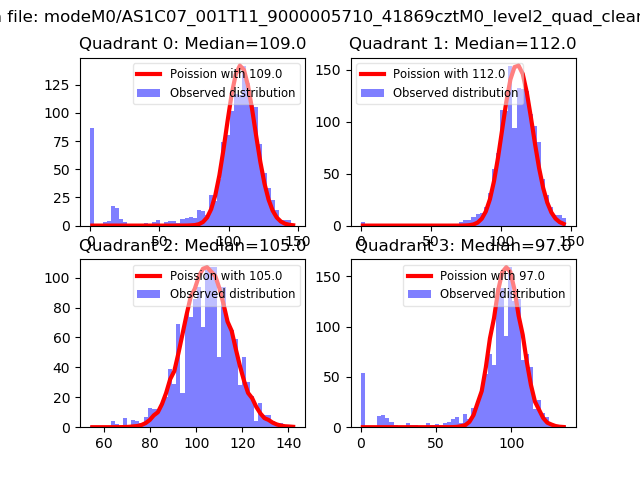 |
 |
| Quadrant-wise count rates Data is divided into 100 sec bins |
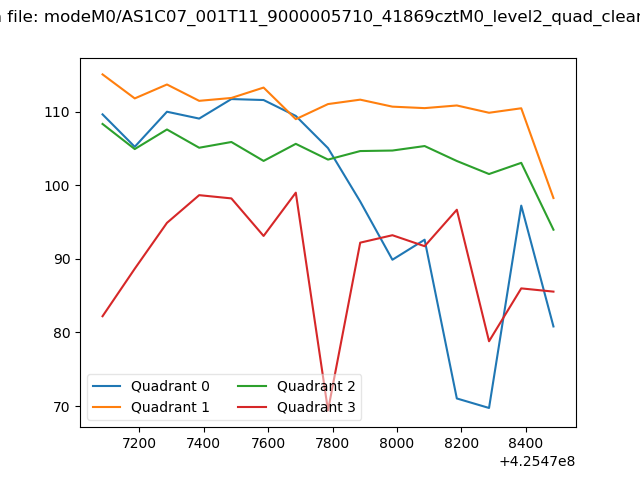 |
|
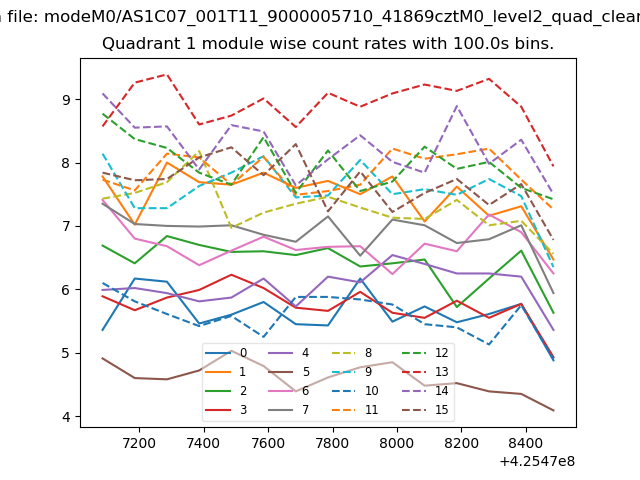
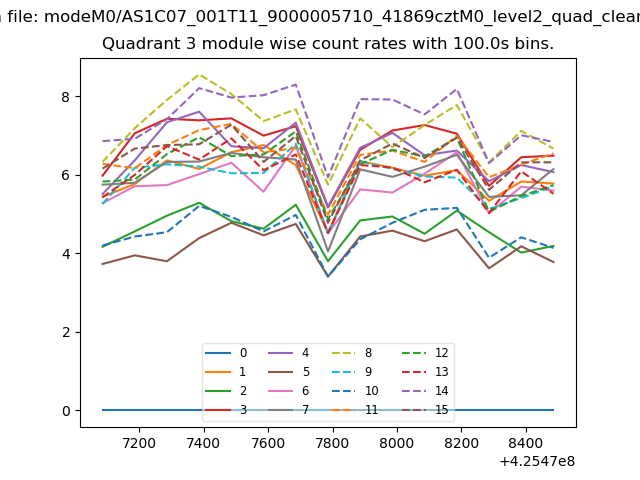
| Module-wise count rates for Quadrant A Data is divided into 100 sec bins |
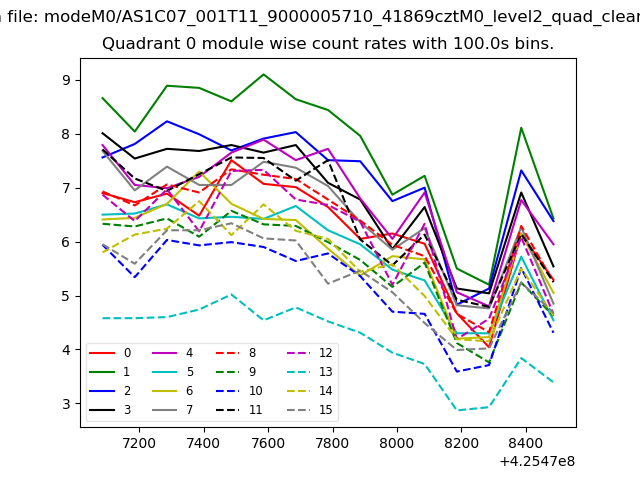 |
 |
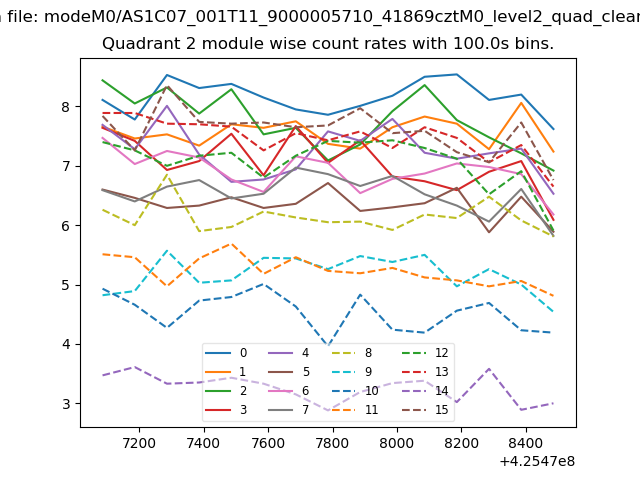
| Module-wise count rates for Quadrant B Data is divided into 100 sec bins |
 |
 |
| Module-wise count rates for Quadrant C Data is divided into 100 sec bins |
 |
 |
| Module-wise count rates for Quadrant D Data is divided into 100 sec bins |
 |
 |
| Parameter | Plot |
|---|---|
| CZT HV Monitor | 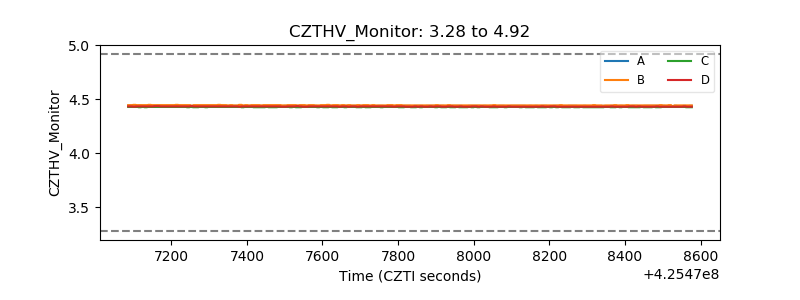 |
| D_VDD | 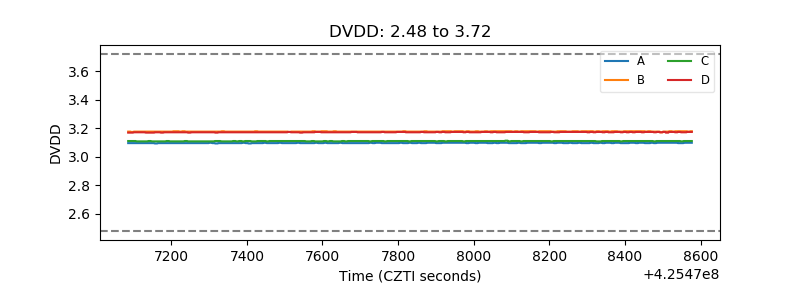 |
| Temperature 1 | 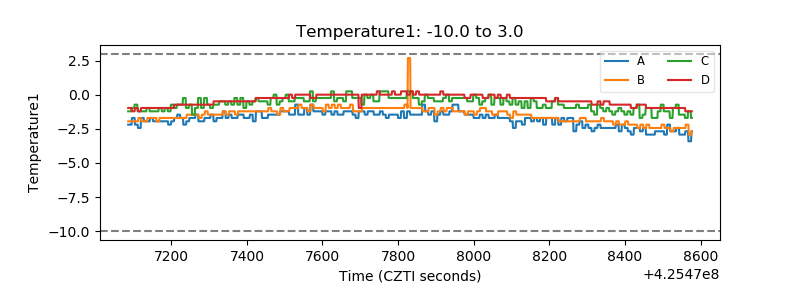 |
| Veto HV Monitor | 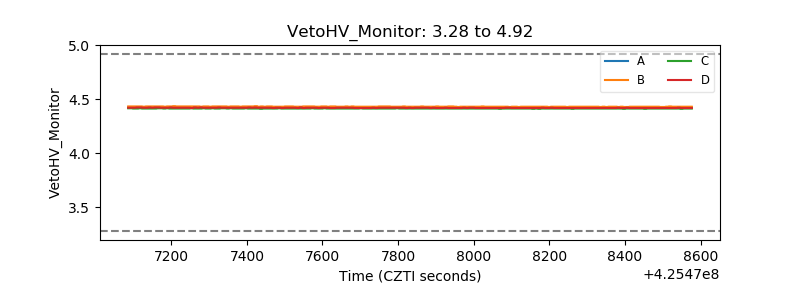 |
| Veto LLD |  |
| Alpha Counter | 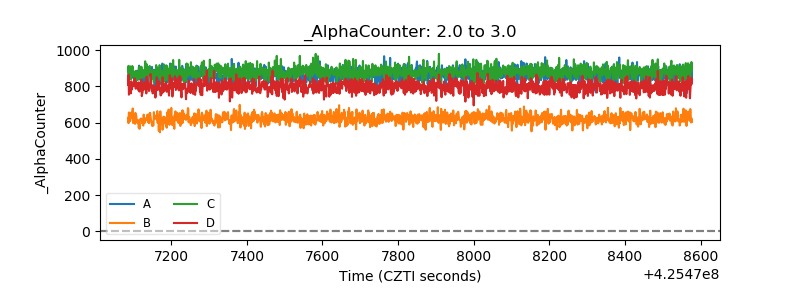 |
| _CPM_Rate | 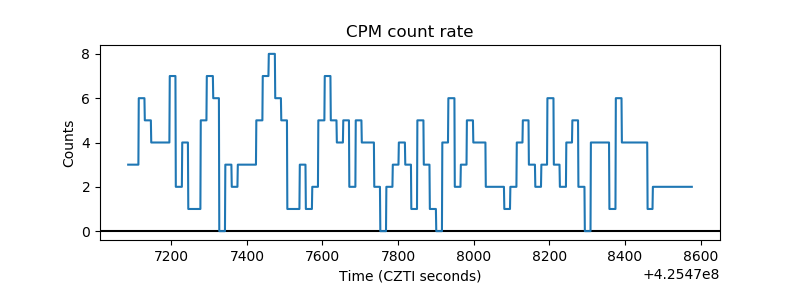 |
| CZT Counter | 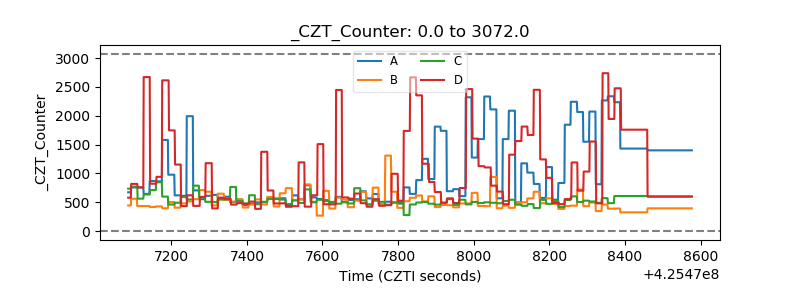 |
| +2.5 Volts monitor | 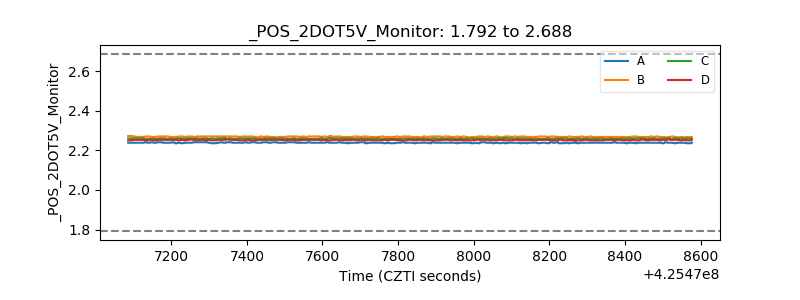 |
| +5 Volts monitor | 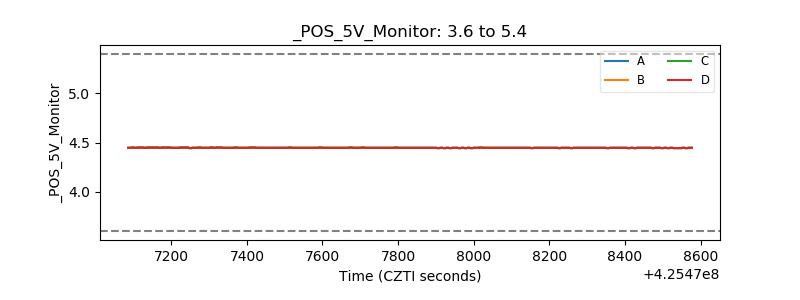 |
| _ROLL_ROT | 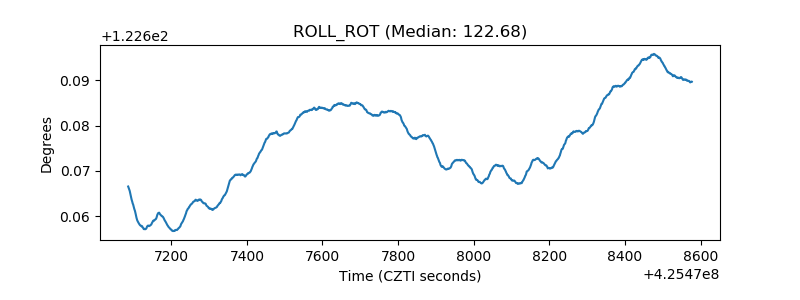 |
| _Roll_DEC | 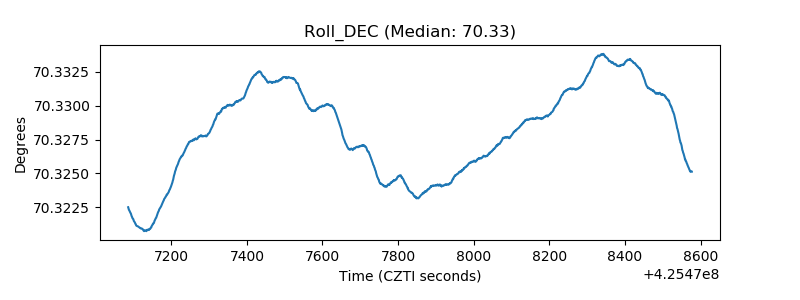 |
| _Roll_RA | 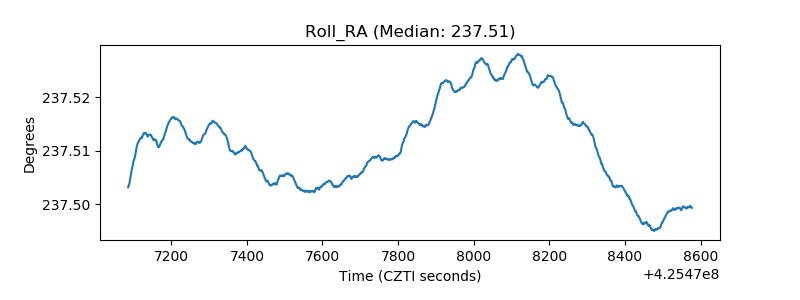 |
| Veto Counter | 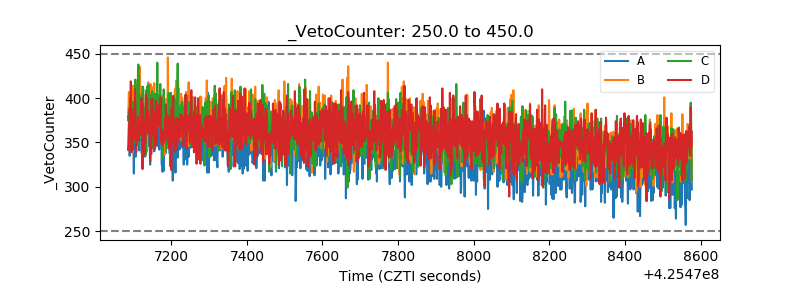 |