| Param | Original file | Final file |
|---|---|---|
| Filename | modeM0/AS1T05_124T01_9000005712_41869cztM0_level2.fits | modeM0/AS1T05_124T01_9000005712_41869cztM0_level2_quad_clean.evt |
| Size (bytes) | 241,056,000 | 45,766,080 |
| Size | 229.9 MB | 43.6 MB |
| Events in quadrant A | 2,457,299 | 314,356 |
| Events in quadrant B | 1,440,333 | 328,145 |
| Events in quadrant C | 1,709,833 | 294,895 |
| Events in quadrant D | 3,089,932 | 242,767 |
| Mode SS | |||
|---|---|---|---|
| Quadrant | BADHDUFLAG | Total packets | Discarded packets |
| A | 0 | 60 | 0 |
| B | 0 | 60 | 0 |
| C | 0 | 60 | 0 |
| D | 0 | 60 | 0 |
| Mode M9 | |||
|---|---|---|---|
| Quadrant | BADHDUFLAG | Total packets | Discarded packets |
| A | 0 | 17 | 0 |
| B | 0 | 17 | 0 |
| C | 0 | 17 | 0 |
| D | 0 | 17 | 0 |
| Mode M0 | |||
|---|---|---|---|
| Quadrant | BADHDUFLAG | Total packets | Discarded packets |
| A | 0 | 9232 | 2 |
| B | 0 | 6190 | 1 |
| C | 0 | 6786 | 1 |
| D | 0 | 11142 | 1 |
| Quadrant | Total seconds | Saturated seconds | Saturation percentage |
|---|---|---|---|
| A | 2880 | 165 | 5.729167% |
| B | 2880 | 37 | 1.284722% |
| C | 2880 | 127 | 4.409722% |
| D | 2880 | 559 | 19.409722% |
Noise dominated data is calculated using 1-second bins in cleaned event files. If a bin has >2000 counts, and if more than 50% of those come from <1% of pixels, then it is considered to be noise-dominated and hence unusable.
| Quadrant | # 1 sec bins | Bins with >0 counts | Bins with >2000 counts | High rate bins dominated by noise | Noise dominated (total time) | Noise dominated (detector-on time) | Marked lightcurve |
|---|---|---|---|---|---|---|---|
| A | 4613 | 2881 | 121 | 121 | 2.62% | 4.20% | 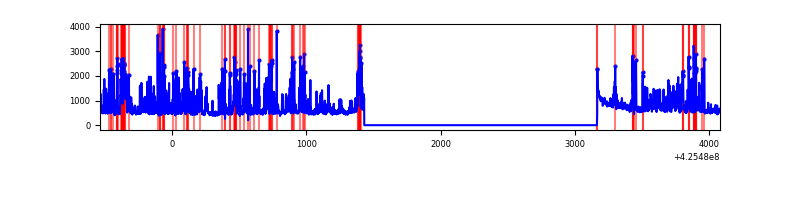 |
| B | 4613 | 2881 | 25 | 25 | 0.54% | 0.87% | 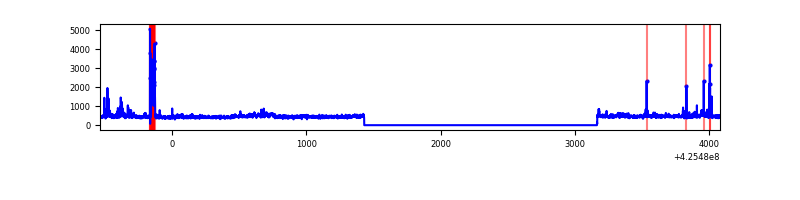 |
| C | 4613 | 2881 | 124 | 124 | 2.69% | 4.30% | 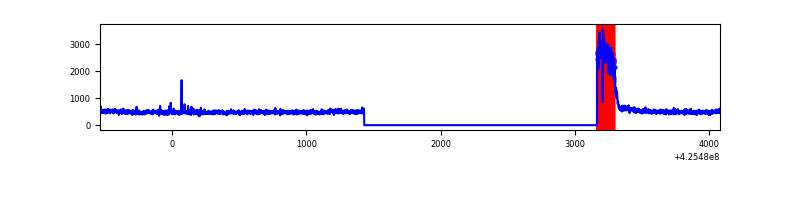 |
| D | 4613 | 2881 | 530 | 530 | 11.49% | 18.40% | 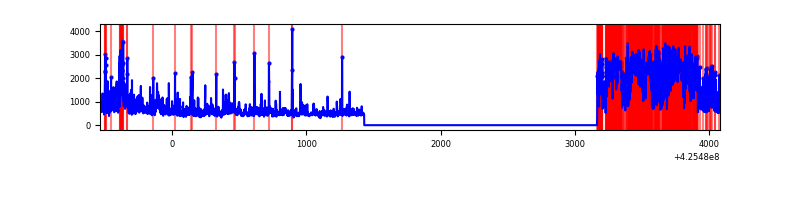 |
Top three noisy pixels from each quadrant. If the there are fewer than three noisy pixels in the level2.evt file, extra rows are filled as -1
| Pixel properties | Quadrant properties | ||||||
|---|---|---|---|---|---|---|---|
| Quadrant | DetID | PixID | Counts | Sigma | Mean | Median | Sigma |
| A | 14 | 24 | 935056 | 14377.08 | 312 | 305 | 65.0 |
| A | 10 | 83 | 283065 | 4349.03 | 312 | 305 | 65.0 |
| A | 14 | 250 | 16086 | 242.71 | 312 | 305 | 65.0 |
| B | 15 | 35 | 79805 | 1279.73 | 316 | 307 | 62.1 |
| B | 0 | 245 | 46768 | 747.91 | 316 | 307 | 62.1 |
| B | 0 | 186 | 24386 | 387.61 | 316 | 307 | 62.1 |
| C | 0 | 10 | 411149 | 5687.86 | 301 | 302 | 72.2 |
| C | 15 | 214 | 113110 | 1561.74 | 301 | 302 | 72.2 |
| C | 15 | 111 | 7120 | 94.39 | 301 | 302 | 72.2 |
| D | 12 | 79 | 1549641 | 21655.33 | 287 | 280 | 71.5 |
| D | 5 | 222 | 153217 | 2137.59 | 287 | 280 | 71.5 |
| D | 2 | 249 | 150648 | 2101.68 | 287 | 280 | 71.5 |
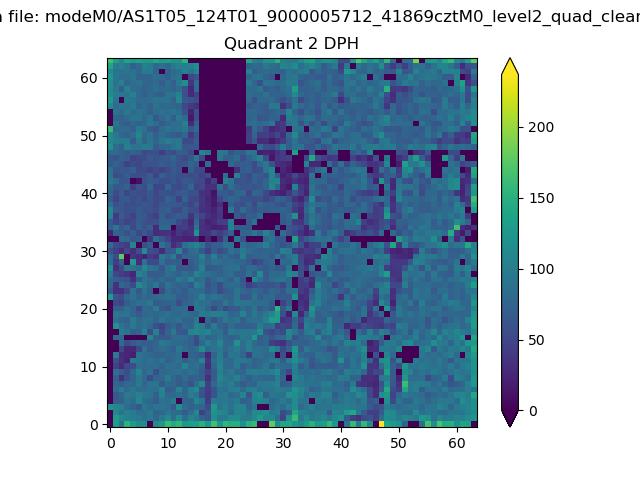
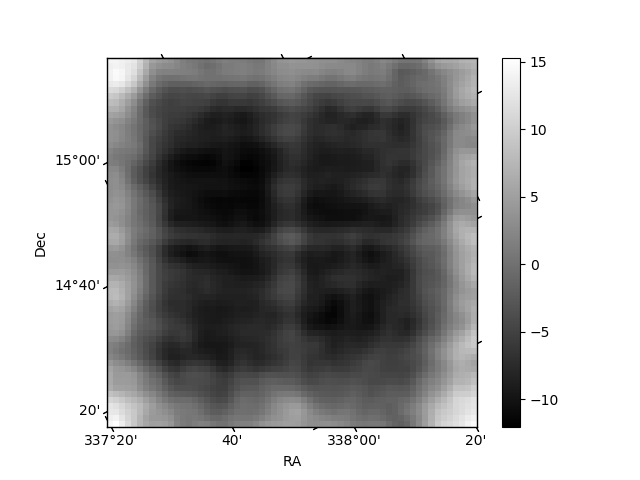
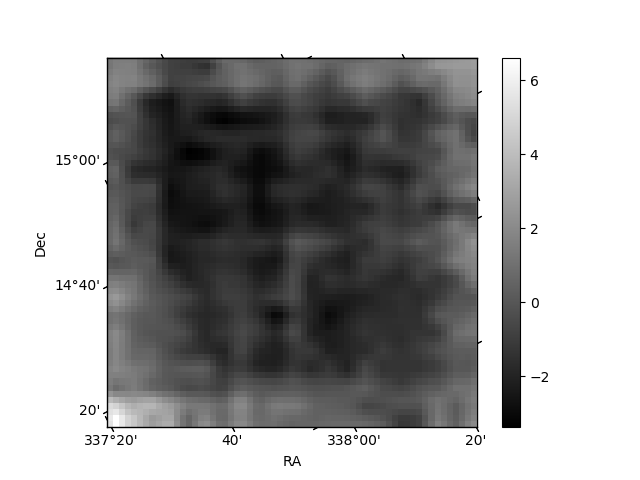
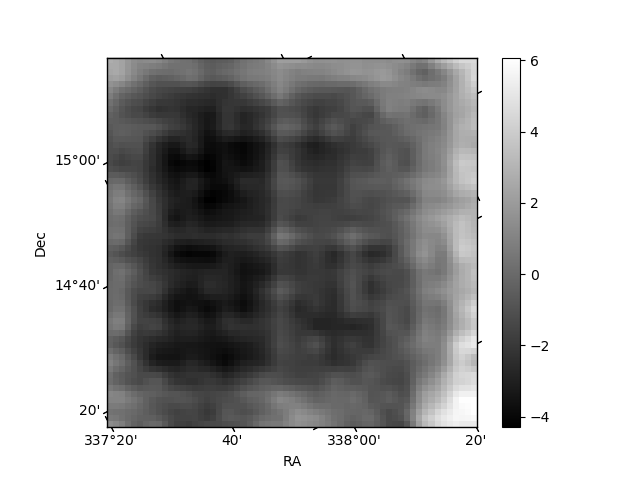
Histogram calculated using DETX and DETY for each event in the final _common_clean file
| Quadrant A | 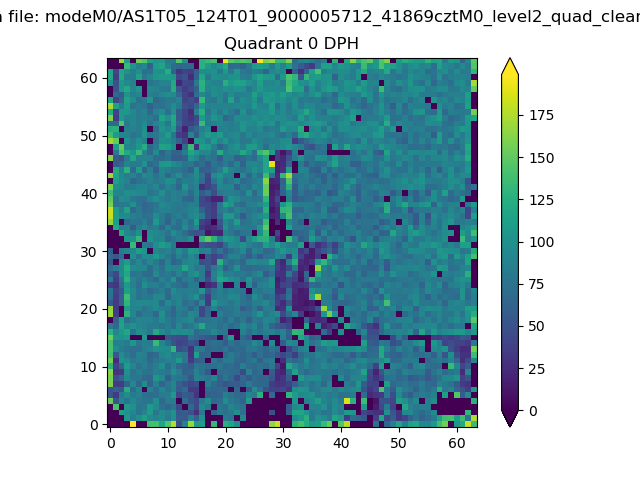 |
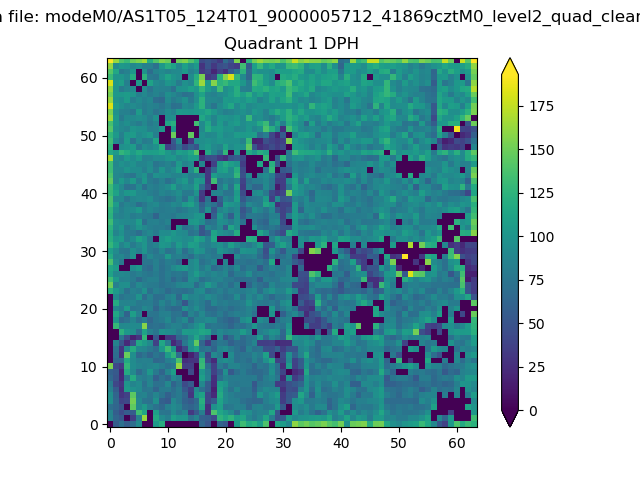 |
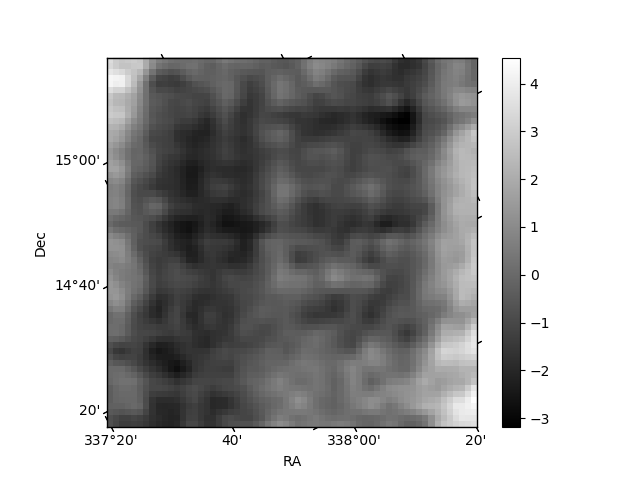
Quadrant B |
|---|---|---|---|
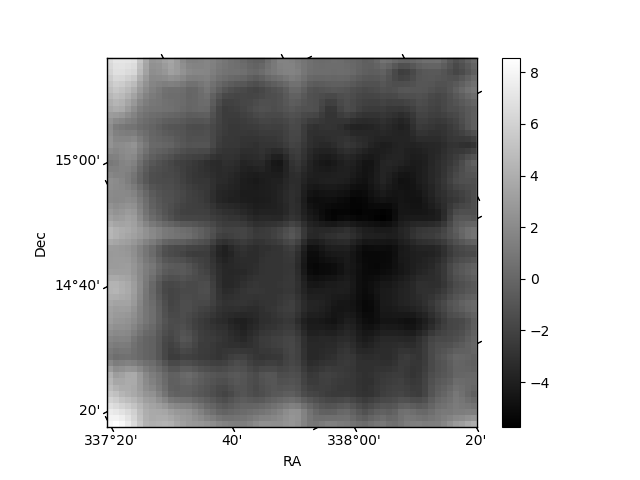
| Quadrant D | 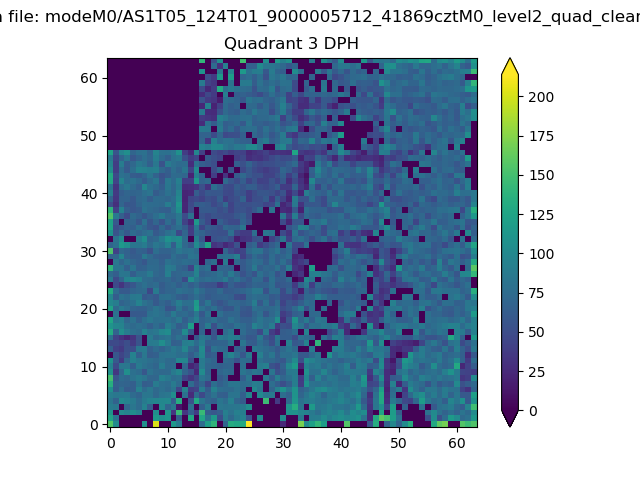 |
 |
Quadrant C |
| Plot type | Count rate plots | Images |
|---|---|---|
| Comparison with Poisson distribution Blue bars denote a histogram of data divided into 1 sec bins. Red curve is a Poisson curve with rate = median count rate of data. |
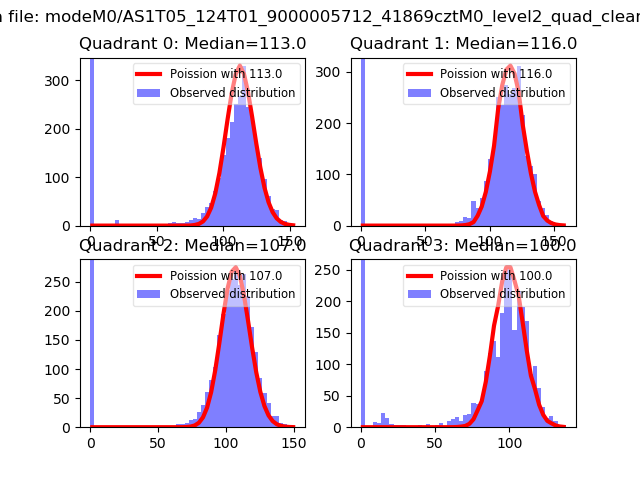 |
 |
| Quadrant-wise count rates Data is divided into 100 sec bins |
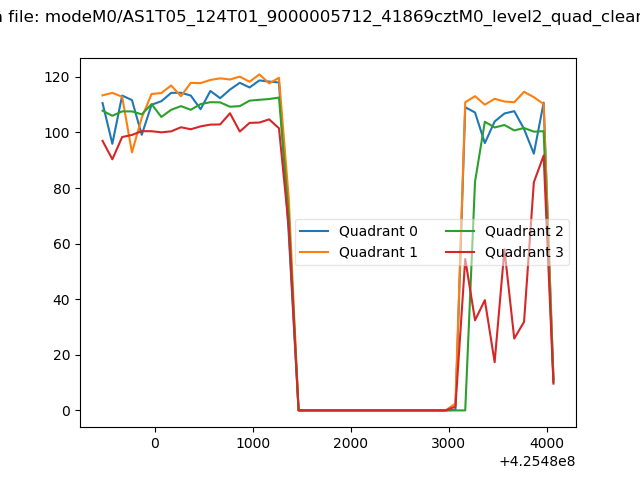 |
|
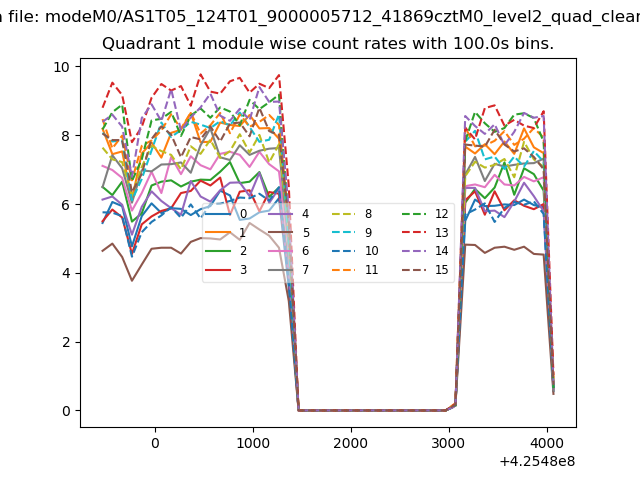
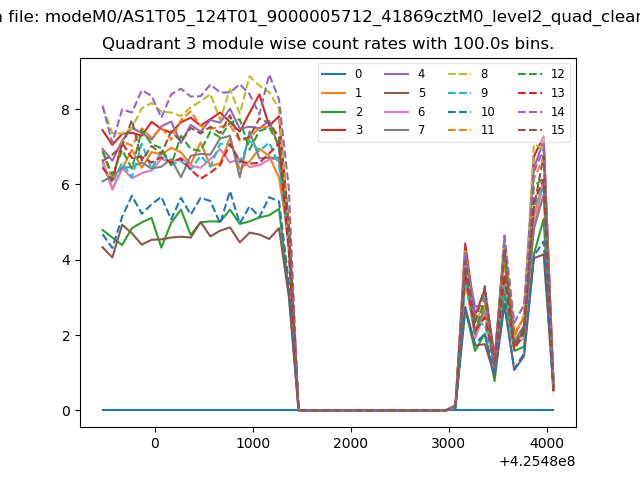
| Module-wise count rates for Quadrant A Data is divided into 100 sec bins |
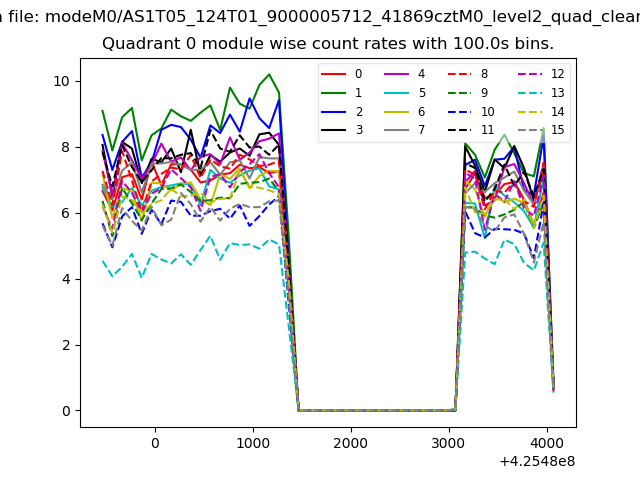 |
 |
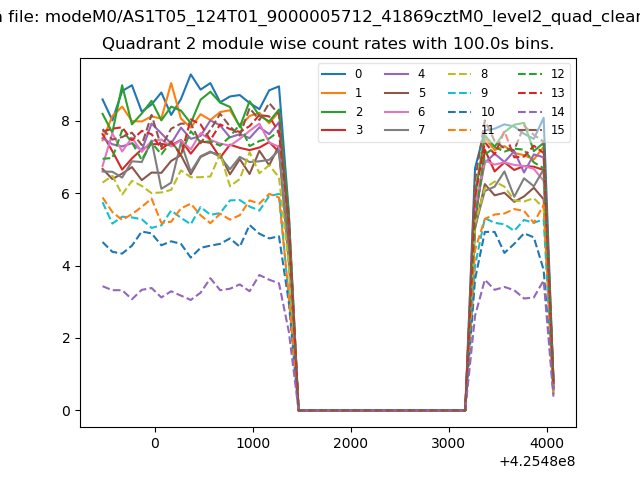
| Module-wise count rates for Quadrant B Data is divided into 100 sec bins |
 |
 |
| Module-wise count rates for Quadrant C Data is divided into 100 sec bins |
 |
 |
| Module-wise count rates for Quadrant D Data is divided into 100 sec bins |
 |
 |
| Parameter | Plot |
|---|---|
| CZT HV Monitor |  |
| D_VDD | 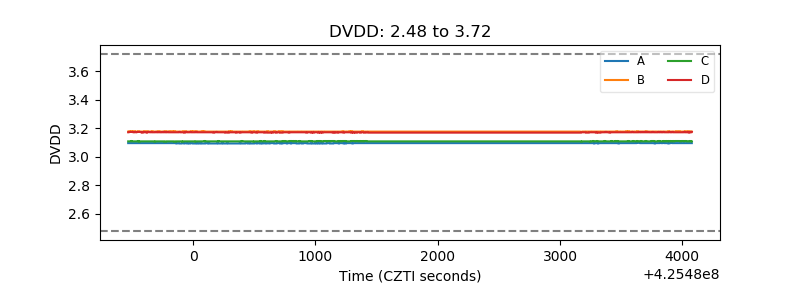 |
| Temperature 1 | 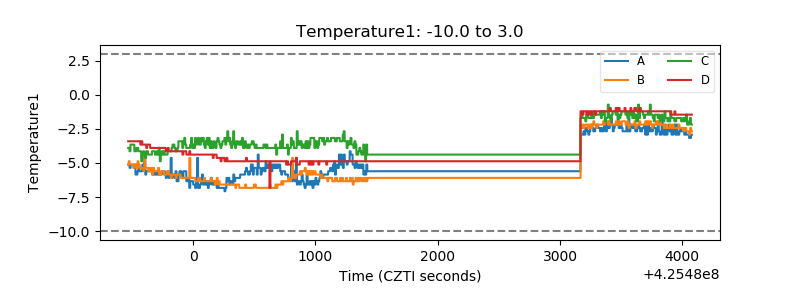 |
| Veto HV Monitor | 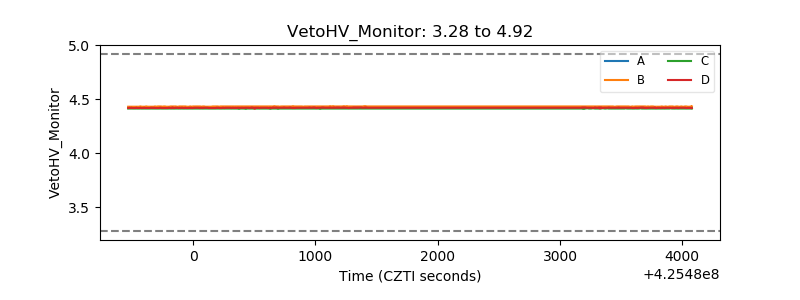 |
| Veto LLD | 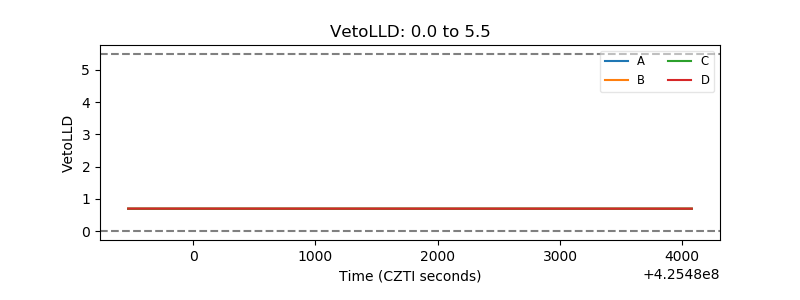 |
| Alpha Counter | 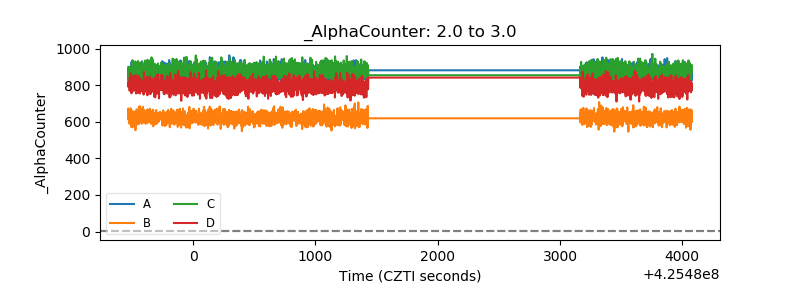 |
| _CPM_Rate | 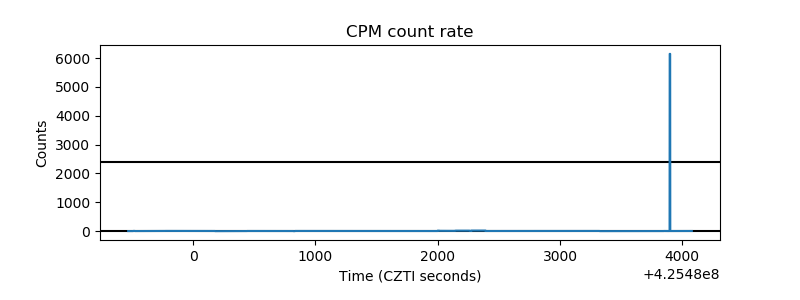 |
| CZT Counter | 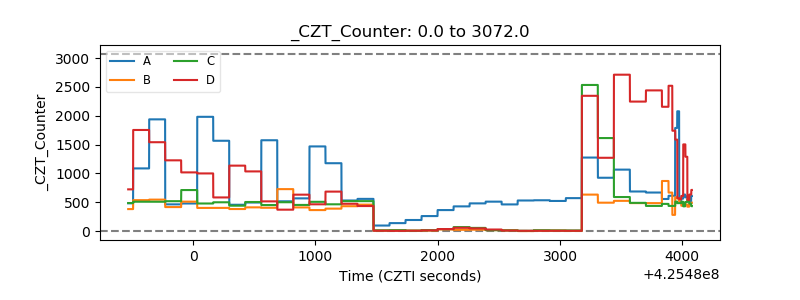 |
| +2.5 Volts monitor | 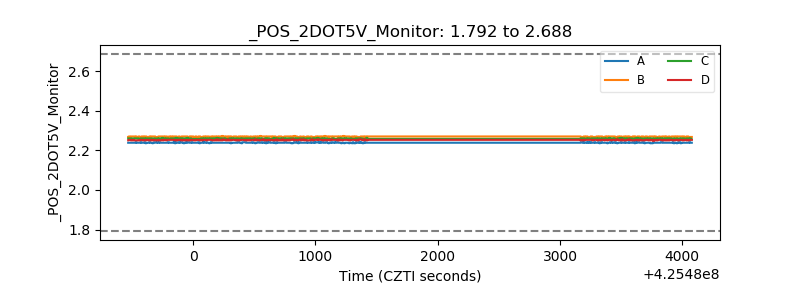 |
| +5 Volts monitor | 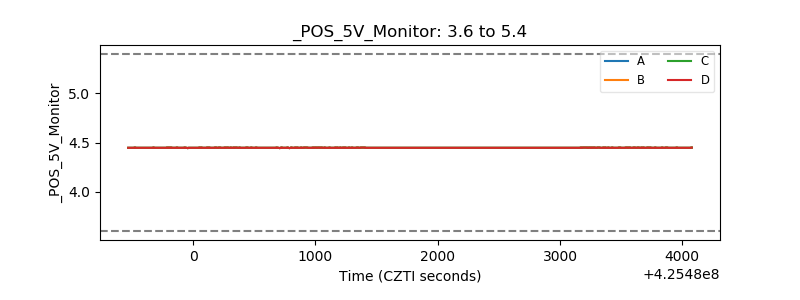 |
| _ROLL_ROT | 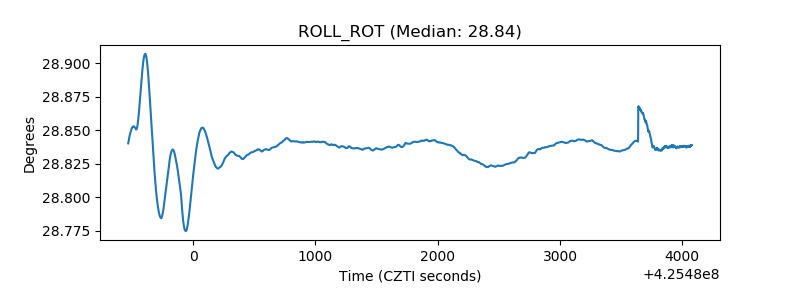 |
| _Roll_DEC |  |
| _Roll_RA | 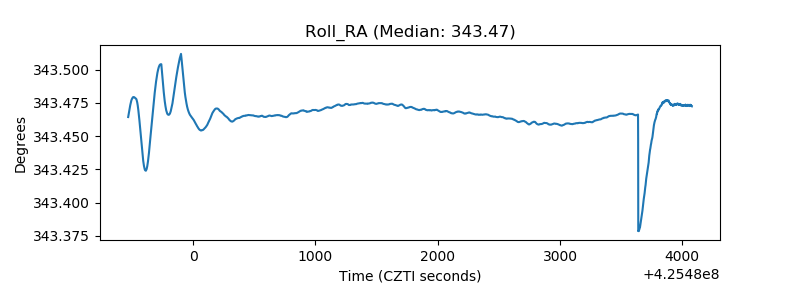 |
| Veto Counter | 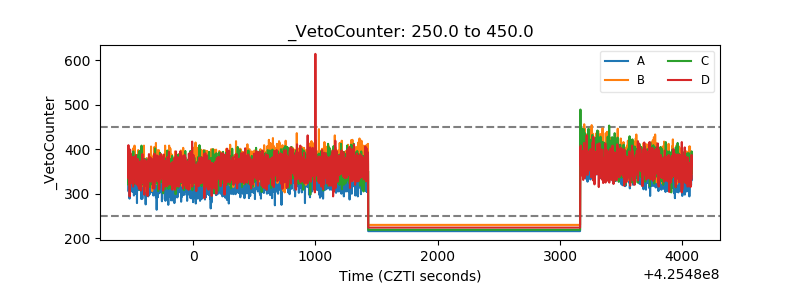 |