| Param | Original file | Final file |
|---|---|---|
| Filename | modeM0/AS1T05_124T01_9000005712_41870cztM0_level2.fits | modeM0/AS1T05_124T01_9000005712_41870cztM0_level2_quad_clean.evt |
| Size (bytes) | 518,581,440 | 87,387,840 |
| Size | 494.6 MB | 83.3 MB |
| Events in quadrant A | 5,675,109 | 563,007 |
| Events in quadrant B | 2,655,035 | 642,818 |
| Events in quadrant C | 3,427,659 | 570,902 |
| Events in quadrant D | 6,993,810 | 468,842 |
| Mode SS | |||
|---|---|---|---|
| Quadrant | BADHDUFLAG | Total packets | Discarded packets |
| A | 0 | 116 | 0 |
| B | 0 | 116 | 0 |
| C | 0 | 116 | 0 |
| D | 0 | 116 | 0 |
| Mode M9 | |||
|---|---|---|---|
| Quadrant | BADHDUFLAG | Total packets | Discarded packets |
| A | 0 | 23 | 0 |
| B | 0 | 23 | 0 |
| C | 0 | 24 | 0 |
| D | 0 | 24 | 0 |
| Mode M0 | |||
|---|---|---|---|
| Quadrant | BADHDUFLAG | Total packets | Discarded packets |
| A | 0 | 20756 | 2 |
| B | 0 | 11787 | 3 |
| C | 0 | 13546 | 2 |
| D | 0 | 24715 | 2 |
| Quadrant | Total seconds | Saturated seconds | Saturation percentage |
|---|---|---|---|
| A | 5726 | 805 | 14.058680% |
| B | 5725 | 23 | 0.401747% |
| C | 5725 | 254 | 4.436681% |
| D | 5725 | 1230 | 21.484716% |
Noise dominated data is calculated using 1-second bins in cleaned event files. If a bin has >2000 counts, and if more than 50% of those come from <1% of pixels, then it is considered to be noise-dominated and hence unusable.
| Quadrant | # 1 sec bins | Bins with >0 counts | Bins with >2000 counts | High rate bins dominated by noise | Noise dominated (total time) | Noise dominated (detector-on time) | Marked lightcurve |
|---|---|---|---|---|---|---|---|
| A | 7159 | 5727 | 612 | 612 | 8.55% | 10.69% | 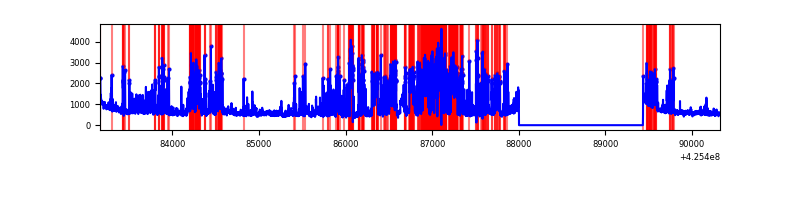 |
| B | 7158 | 5726 | 8 | 8 | 0.11% | 0.14% | 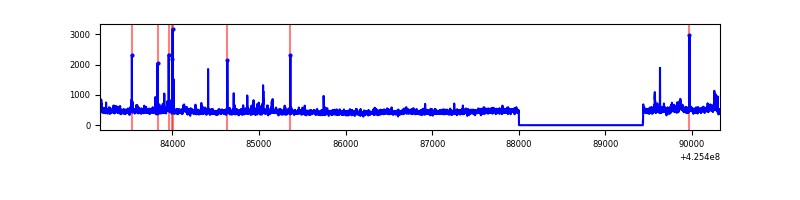 |
| C | 7158 | 5726 | 246 | 246 | 3.44% | 4.30% | 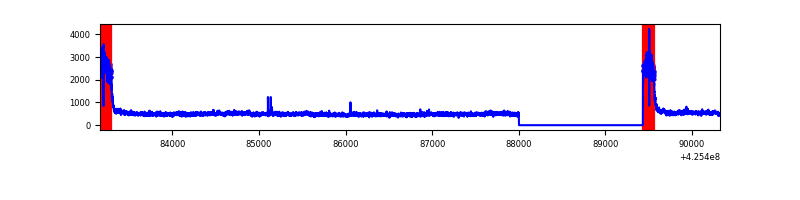 |
| D | 7158 | 5726 | 1256 | 1256 | 17.55% | 21.94% | 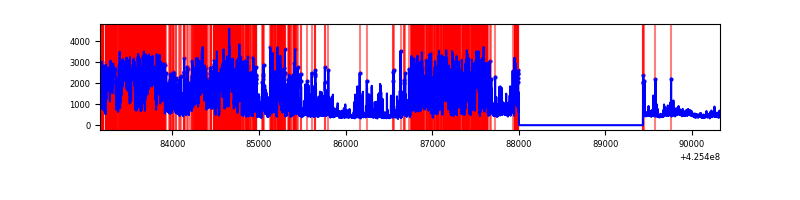 |
Top three noisy pixels from each quadrant. If the there are fewer than three noisy pixels in the level2.evt file, extra rows are filled as -1
| Pixel properties | Quadrant properties | ||||||
|---|---|---|---|---|---|---|---|
| Quadrant | DetID | PixID | Counts | Sigma | Mean | Median | Sigma |
| A | 14 | 24 | 2729285 | 21931.64 | 601 | 589 | 124.4 |
| A | 10 | 83 | 552750 | 4437.94 | 601 | 589 | 124.4 |
| A | 2 | 79 | 54320 | 431.86 | 601 | 589 | 124.4 |
| B | 0 | 186 | 49380 | 398.41 | 628 | 611 | 122.4 |
| B | 0 | 245 | 34518 | 277.0 | 628 | 611 | 122.4 |
| B | 0 | 156 | 34192 | 274.34 | 628 | 611 | 122.4 |
| C | 0 | 10 | 898335 | 6411.11 | 590 | 592 | 140.0 |
| C | 15 | 214 | 222571 | 1585.23 | 590 | 592 | 140.0 |
| C | 14 | 254 | 5699 | 36.47 | 590 | 592 | 140.0 |
| D | 12 | 79 | 4088253 | 28864.79 | 567 | 550 | 141.6 |
| D | 2 | 249 | 400776 | 2826.14 | 567 | 550 | 141.6 |
| D | 5 | 222 | 117027 | 822.49 | 567 | 550 | 141.6 |
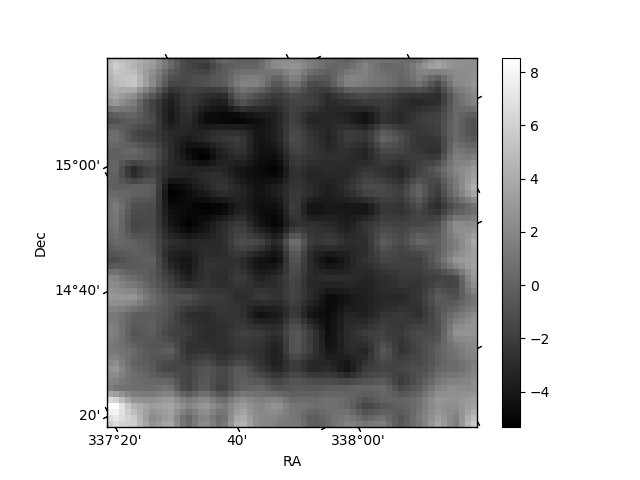
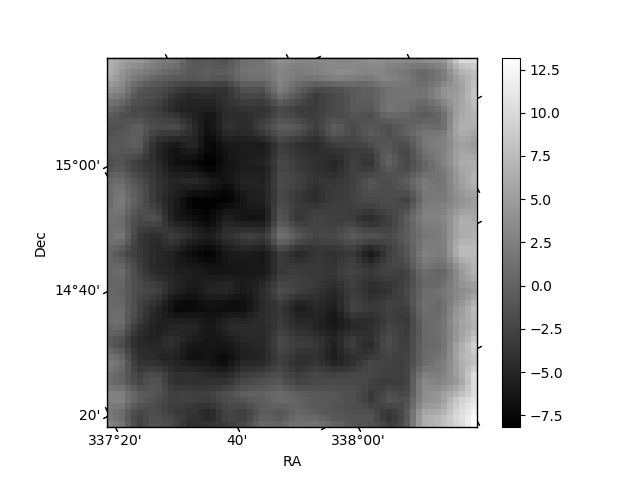
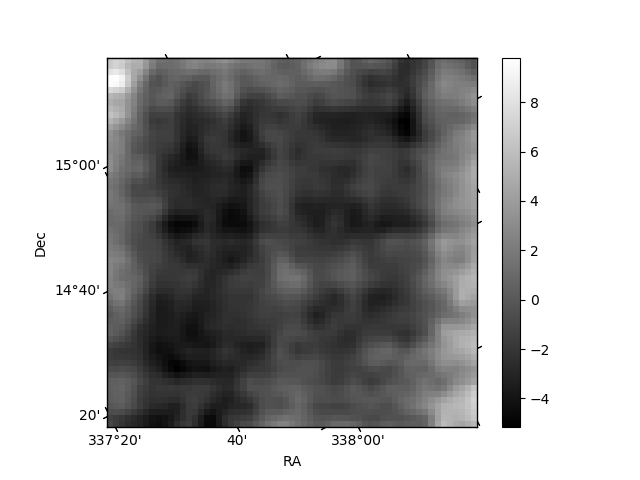
Histogram calculated using DETX and DETY for each event in the final _common_clean file
| Quadrant A | 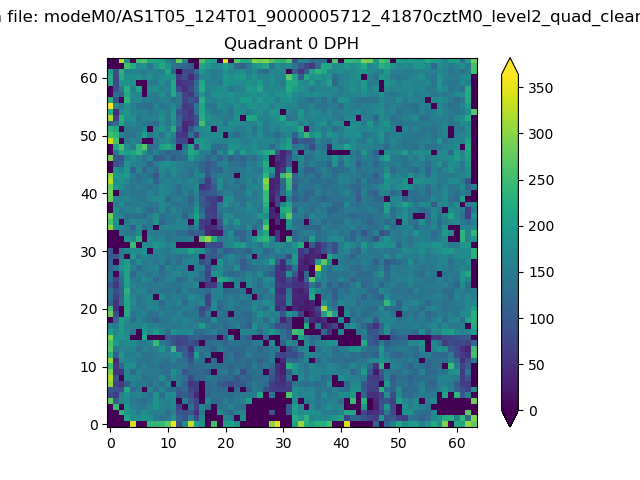 |
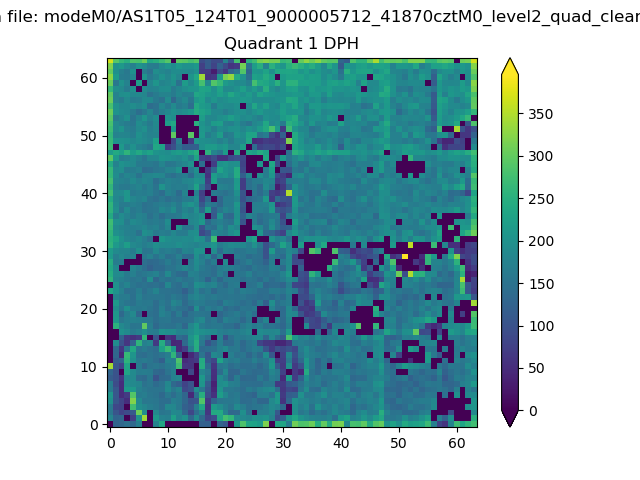 |
Quadrant B |
|---|---|---|---|
| Quadrant D | 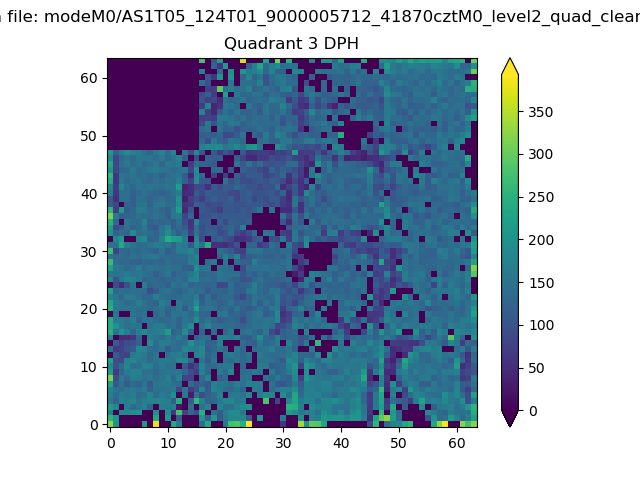 |
 |
Quadrant C |
| Plot type | Count rate plots | Images |
|---|---|---|
| Comparison with Poisson distribution Blue bars denote a histogram of data divided into 1 sec bins. Red curve is a Poisson curve with rate = median count rate of data. |
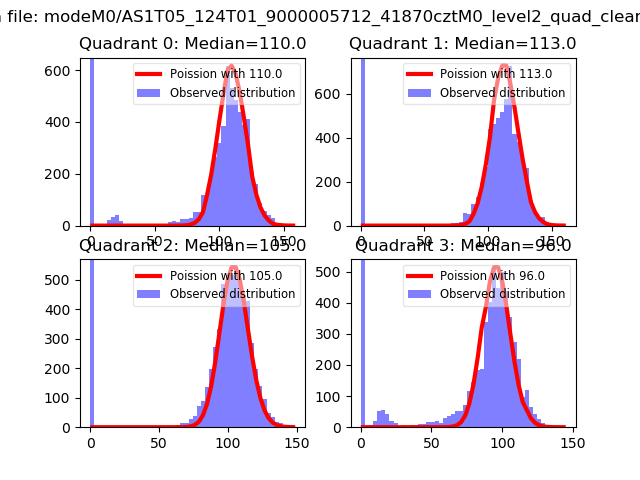 |
 |
| Quadrant-wise count rates Data is divided into 100 sec bins |
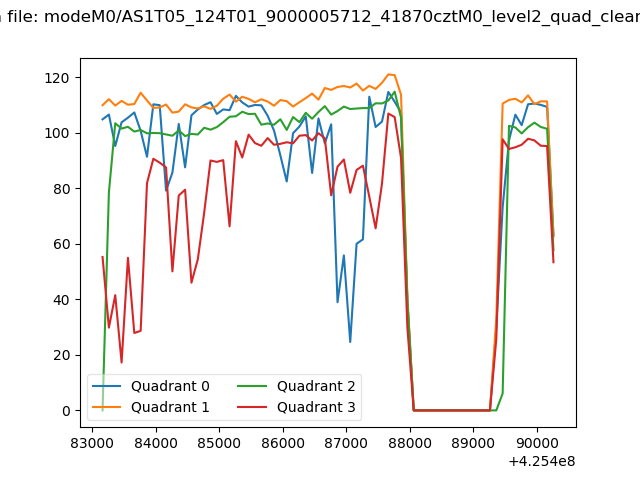 |
|
| Module-wise count rates for Quadrant A Data is divided into 100 sec bins |
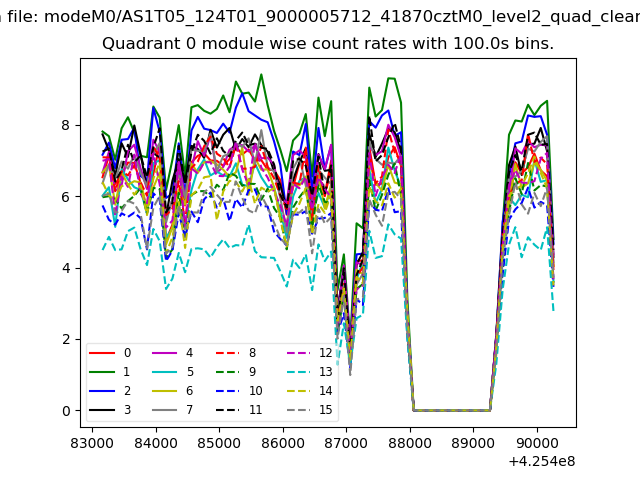 |
 |
| Module-wise count rates for Quadrant B Data is divided into 100 sec bins |
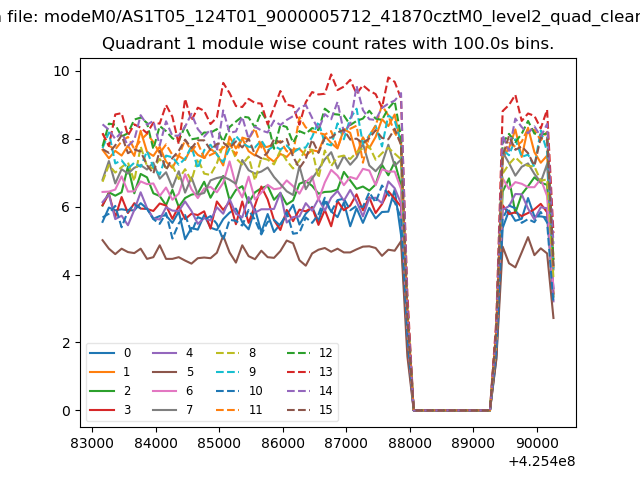 |
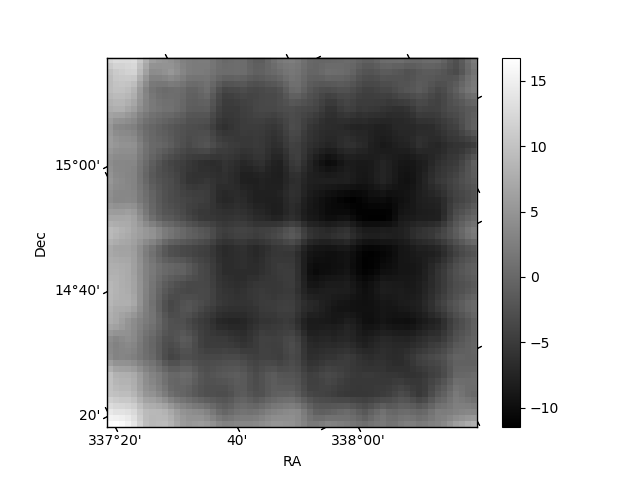 |
| Module-wise count rates for Quadrant C Data is divided into 100 sec bins |
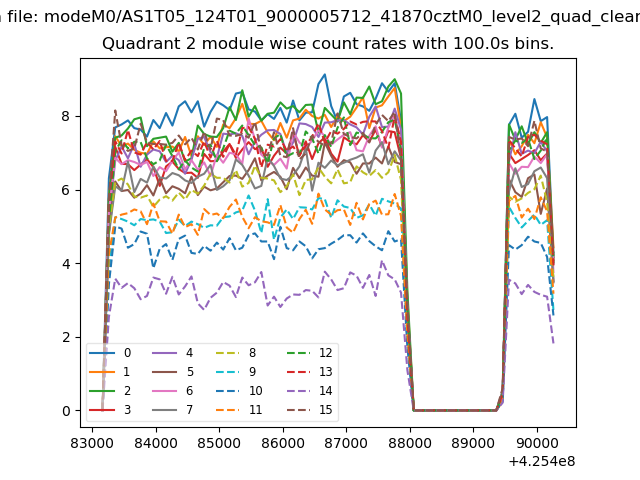 |
 |
| Module-wise count rates for Quadrant D Data is divided into 100 sec bins |
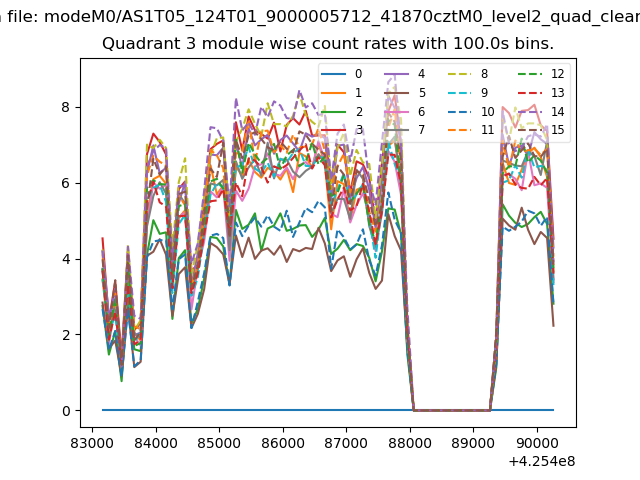 |
 |
| Parameter | Plot |
|---|---|
| CZT HV Monitor |  |
| D_VDD | 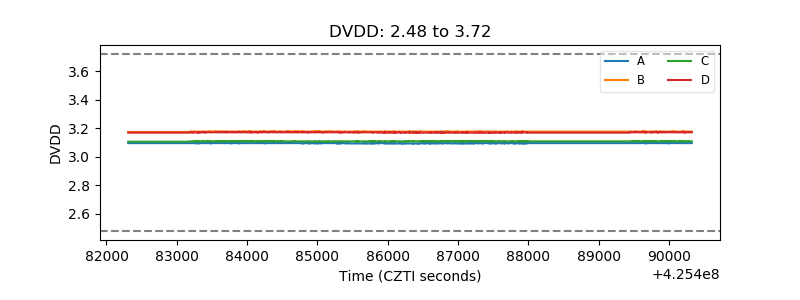 |
| Temperature 1 | 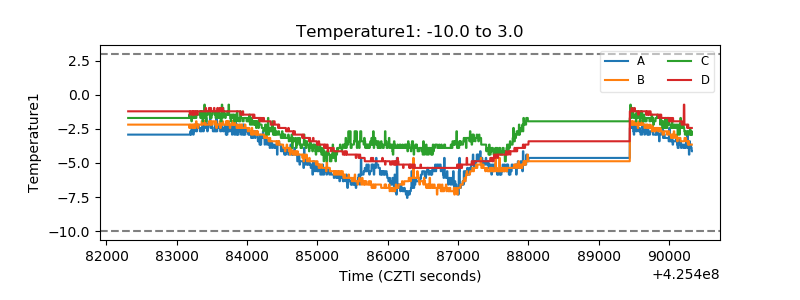 |
| Veto HV Monitor | 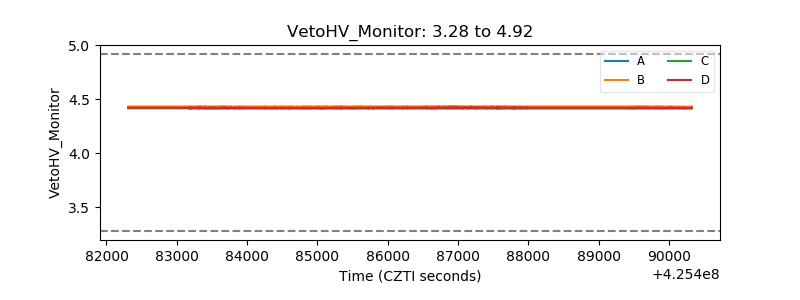 |
| Veto LLD | 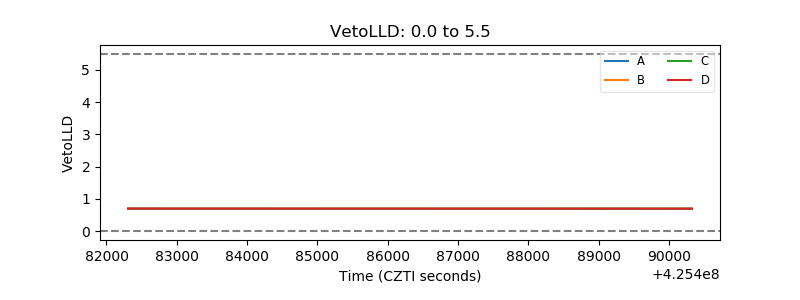 |
| Alpha Counter | 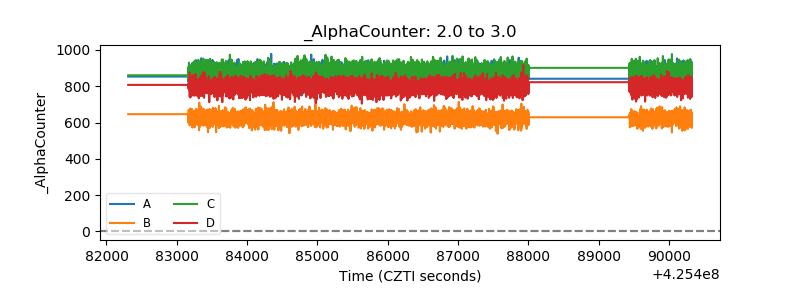 |
| _CPM_Rate | 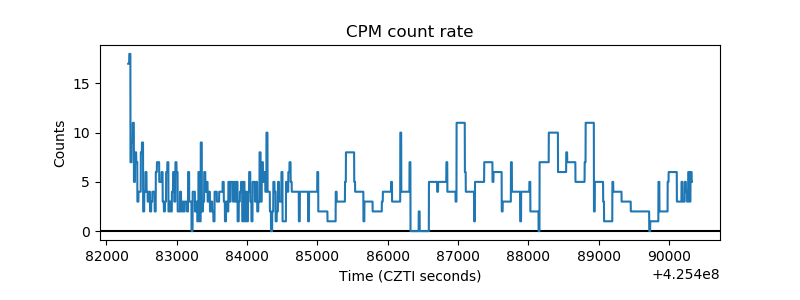 |
| CZT Counter |  |
| +2.5 Volts monitor | 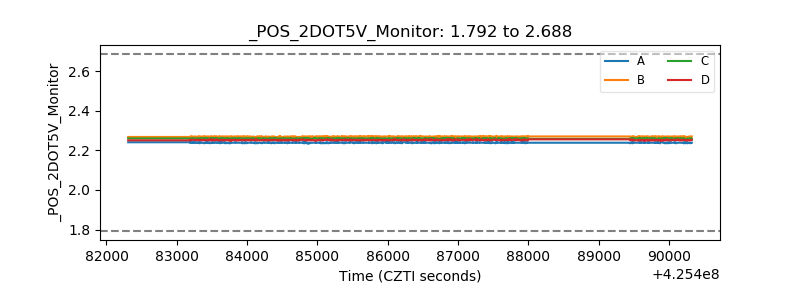 |
| +5 Volts monitor | 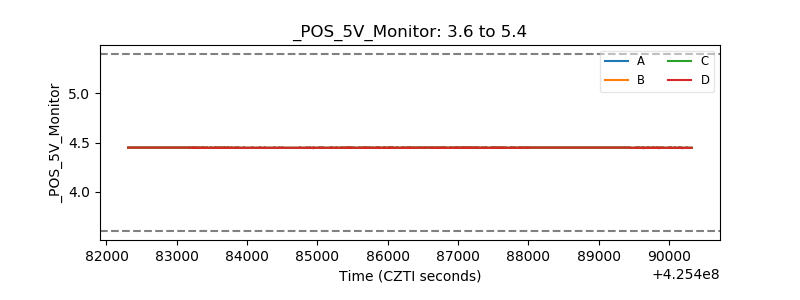 |
| _ROLL_ROT | 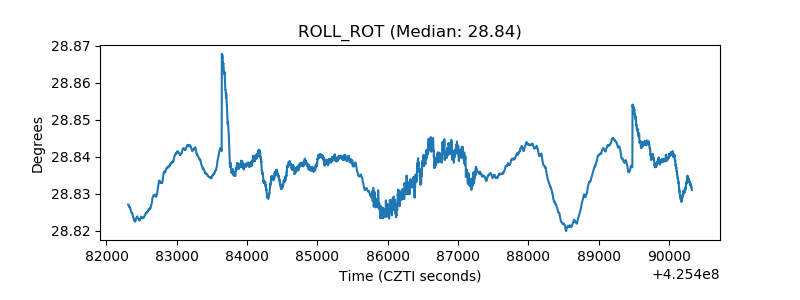 |
| _Roll_DEC | 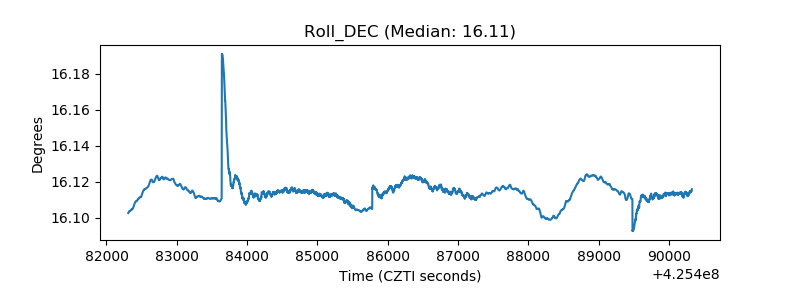 |
| _Roll_RA | 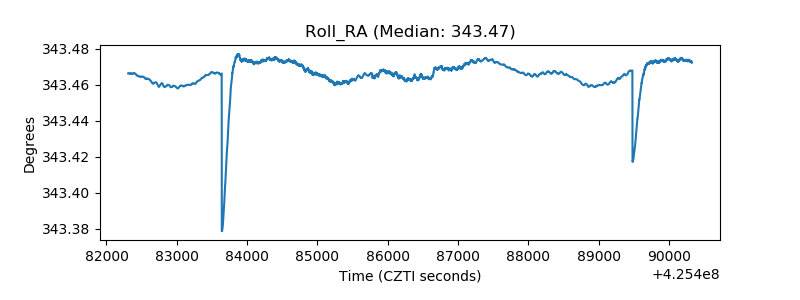 |
| Veto Counter | 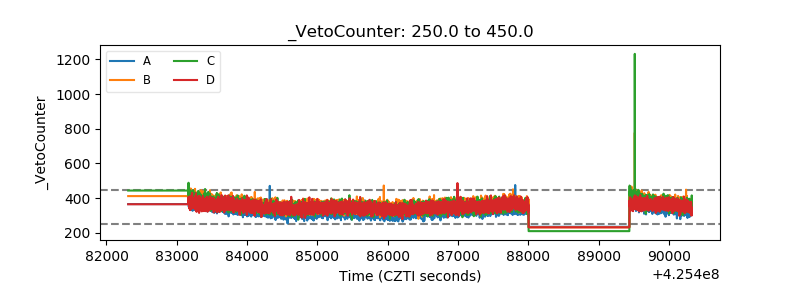 |