| Param | Original file | Final file |
|---|---|---|
| Filename | modeM0/AS1T05_124T01_9000005712_41871cztM0_level2.fits | modeM0/AS1T05_124T01_9000005712_41871cztM0_level2_quad_clean.evt |
| Size (bytes) | 463,933,440 | 94,622,400 |
| Size | 442.4 MB | 90.2 MB |
| Events in quadrant A | 5,023,205 | 604,287 |
| Events in quadrant B | 2,918,620 | 672,642 |
| Events in quadrant C | 3,508,444 | 606,980 |
| Events in quadrant D | 5,253,571 | 559,259 |
| Mode SS | |||
|---|---|---|---|
| Quadrant | BADHDUFLAG | Total packets | Discarded packets |
| A | 0 | 124 | 0 |
| B | 0 | 124 | 0 |
| C | 0 | 124 | 0 |
| D | 0 | 124 | 0 |
| Mode M9 | |||
|---|---|---|---|
| Quadrant | BADHDUFLAG | Total packets | Discarded packets |
| A | 0 | 28 | 0 |
| B | 0 | 28 | 0 |
| C | 0 | 28 | 0 |
| D | 0 | 28 | 0 |
| Mode M0 | |||
|---|---|---|---|
| Quadrant | BADHDUFLAG | Total packets | Discarded packets |
| A | 0 | 18848 | 3 |
| B | 0 | 12880 | 2 |
| C | 0 | 14033 | 2 |
| D | 0 | 19778 | 2 |
| Quadrant | Total seconds | Saturated seconds | Saturation percentage |
|---|---|---|---|
| A | 6042 | 645 | 10.675273% |
| B | 6042 | 42 | 0.695134% |
| C | 6043 | 239 | 3.954989% |
| D | 6043 | 375 | 6.205527% |
Noise dominated data is calculated using 1-second bins in cleaned event files. If a bin has >2000 counts, and if more than 50% of those come from <1% of pixels, then it is considered to be noise-dominated and hence unusable.
| Quadrant | # 1 sec bins | Bins with >0 counts | Bins with >2000 counts | High rate bins dominated by noise | Noise dominated (total time) | Noise dominated (detector-on time) | Marked lightcurve |
|---|---|---|---|---|---|---|---|
| A | 8789 | 6044 | 534 | 534 | 6.08% | 8.84% | 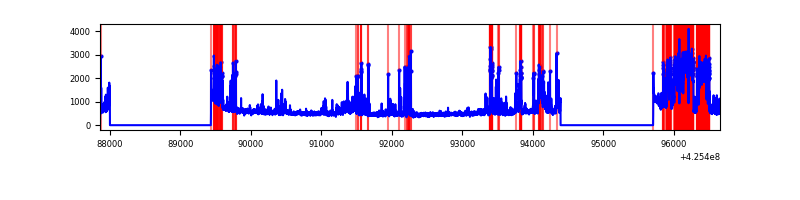 |
| B | 8789 | 6044 | 31 | 31 | 0.35% | 0.51% | 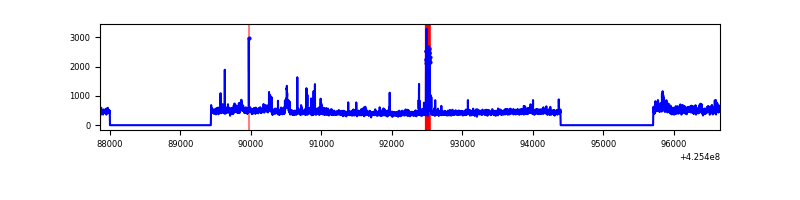 |
| C | 8790 | 6045 | 228 | 228 | 2.59% | 3.77% | 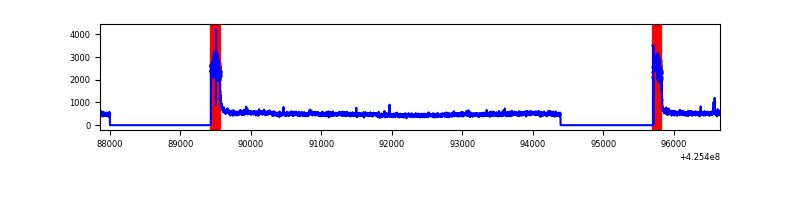 |
| D | 8790 | 6045 | 380 | 380 | 4.32% | 6.29% | 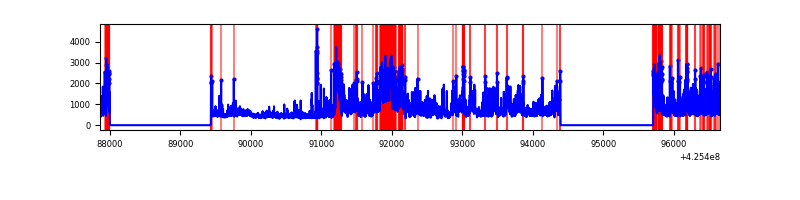 |
Top three noisy pixels from each quadrant. If the there are fewer than three noisy pixels in the level2.evt file, extra rows are filled as -1
| Pixel properties | Quadrant properties | ||||||
|---|---|---|---|---|---|---|---|
| Quadrant | DetID | PixID | Counts | Sigma | Mean | Median | Sigma |
| A | 14 | 24 | 1933423 | 14761.34 | 635 | 625 | 130.9 |
| A | 10 | 83 | 562017 | 4287.51 | 635 | 625 | 130.9 |
| A | 2 | 79 | 46914 | 353.52 | 635 | 625 | 130.9 |
| B | 3 | 112 | 129116 | 989.8 | 661 | 642 | 129.8 |
| B | 0 | 156 | 88431 | 676.35 | 661 | 642 | 129.8 |
| B | 15 | 35 | 65570 | 500.22 | 661 | 642 | 129.8 |
| C | 0 | 10 | 831849 | 5641.06 | 623 | 627 | 147.4 |
| C | 15 | 214 | 235248 | 1592.25 | 623 | 627 | 147.4 |
| C | 14 | 254 | 10991 | 70.33 | 623 | 627 | 147.4 |
| D | 12 | 79 | 1023661 | 6512.63 | 634 | 615 | 157.1 |
| D | 2 | 249 | 881968 | 5610.63 | 634 | 615 | 157.1 |
| D | 12 | 217 | 427755 | 2719.14 | 634 | 615 | 157.1 |
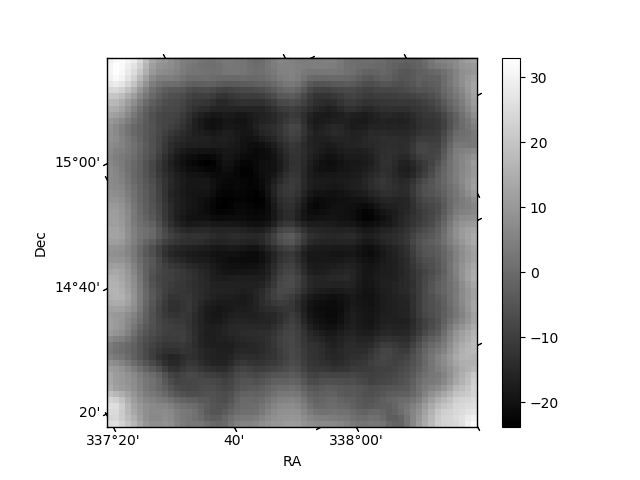
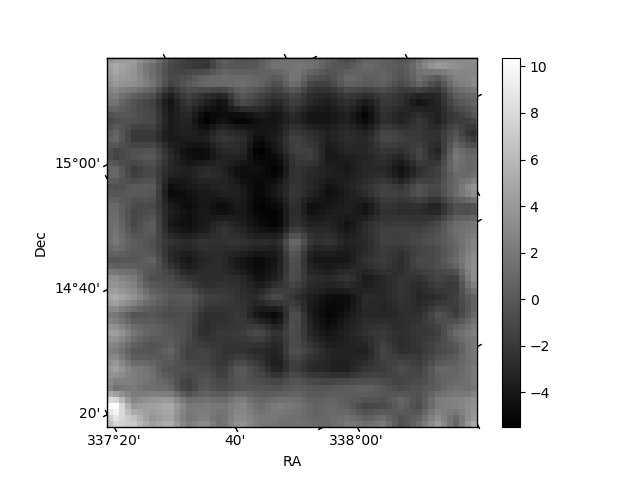
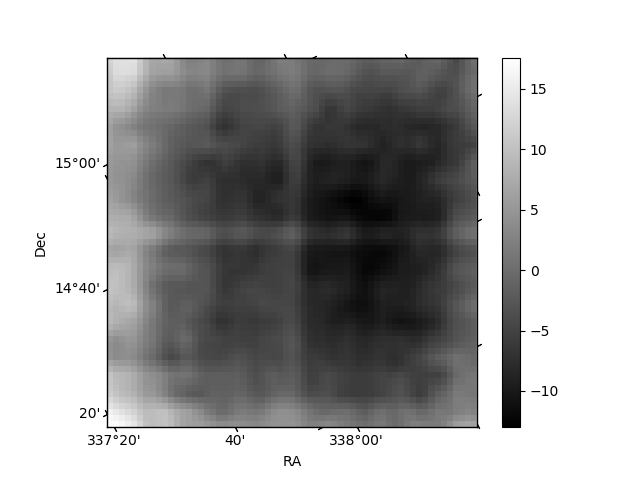
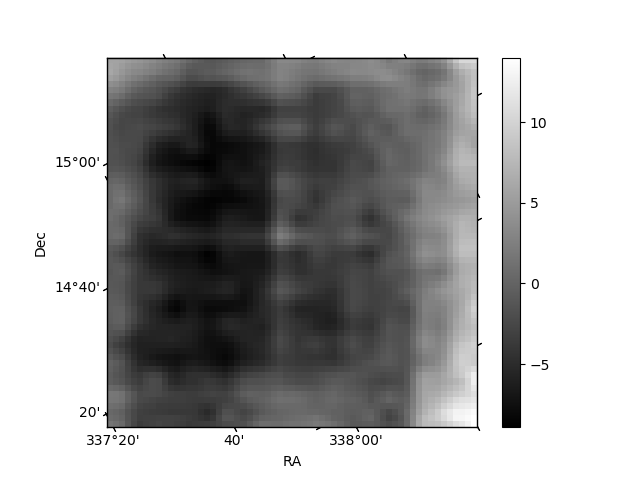
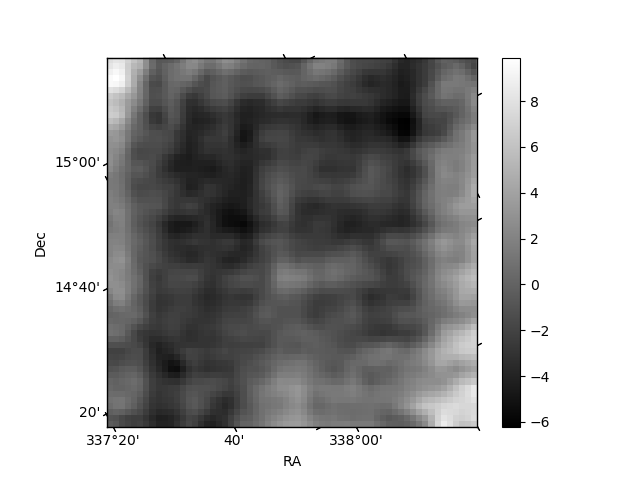
Histogram calculated using DETX and DETY for each event in the final _common_clean file
| Quadrant A | 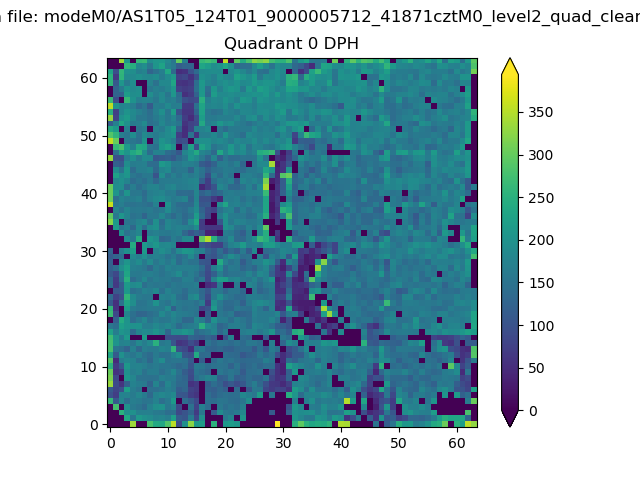 |
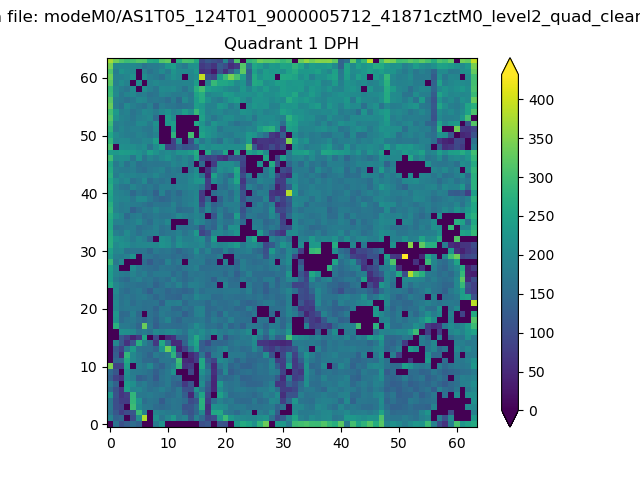 |
Quadrant B |
|---|---|---|---|
| Quadrant D | 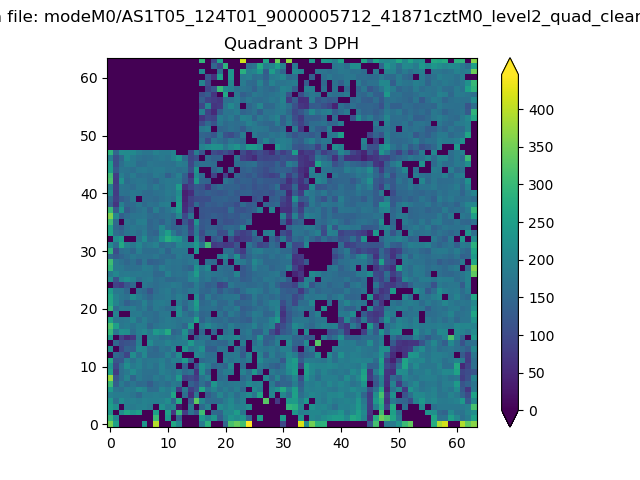 |
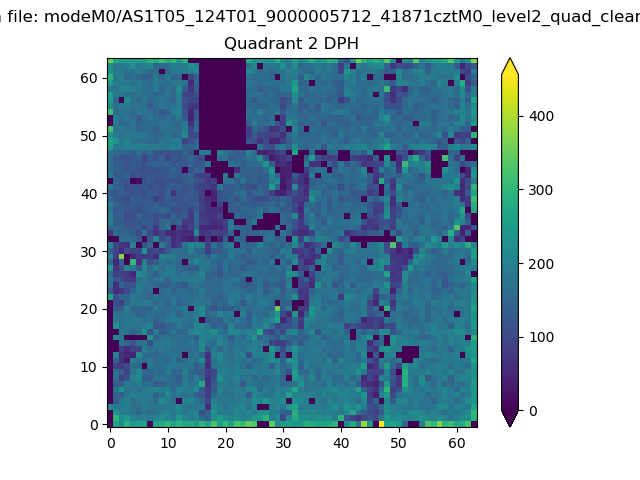 |
Quadrant C |
| Plot type | Count rate plots | Images |
|---|---|---|
| Comparison with Poisson distribution Blue bars denote a histogram of data divided into 1 sec bins. Red curve is a Poisson curve with rate = median count rate of data. |
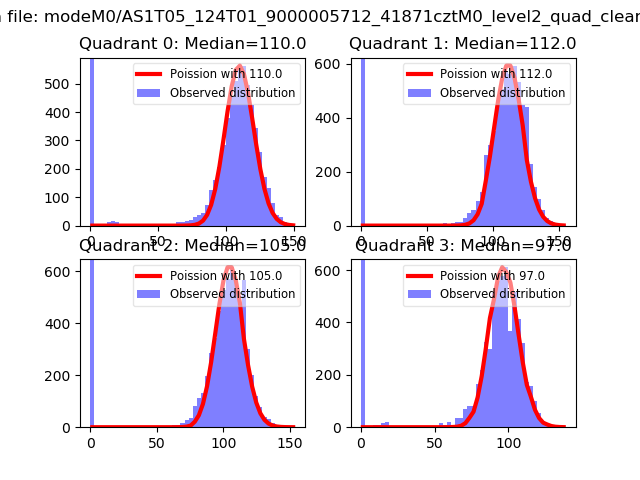 |
 |
| Quadrant-wise count rates Data is divided into 100 sec bins |
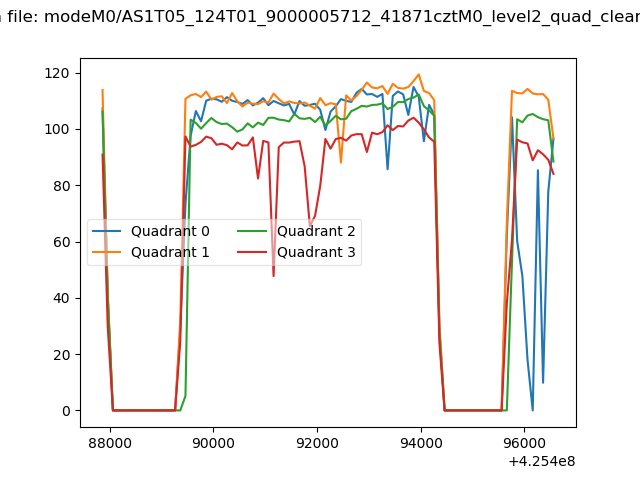 |
|
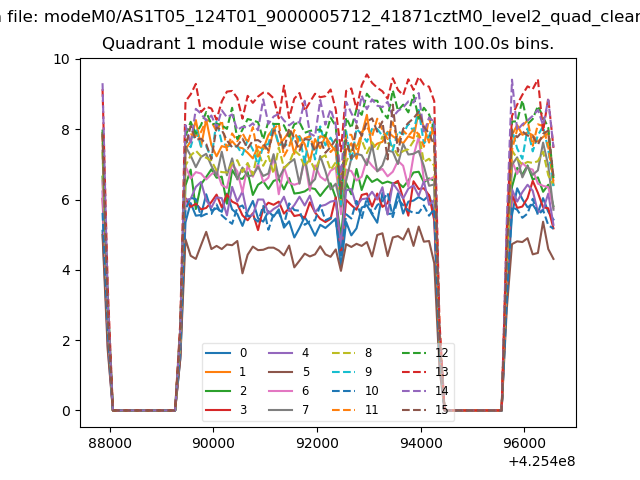
| Module-wise count rates for Quadrant A Data is divided into 100 sec bins |
 |
 |
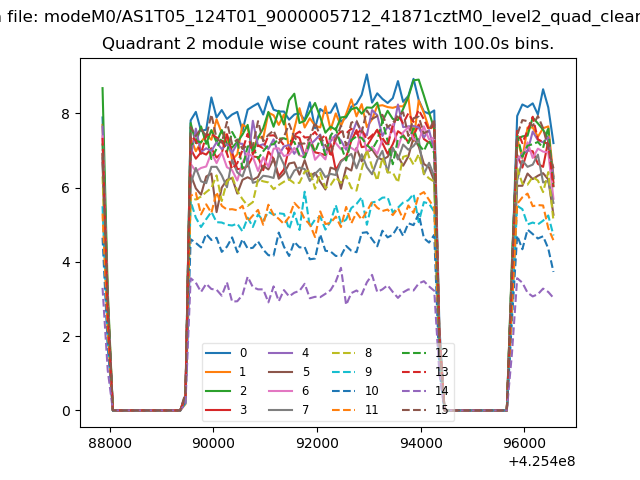
| Module-wise count rates for Quadrant B Data is divided into 100 sec bins |
 |
 |
| Module-wise count rates for Quadrant C Data is divided into 100 sec bins |
 |
 |
| Module-wise count rates for Quadrant D Data is divided into 100 sec bins |
 |
 |
| Parameter | Plot |
|---|---|
| CZT HV Monitor | 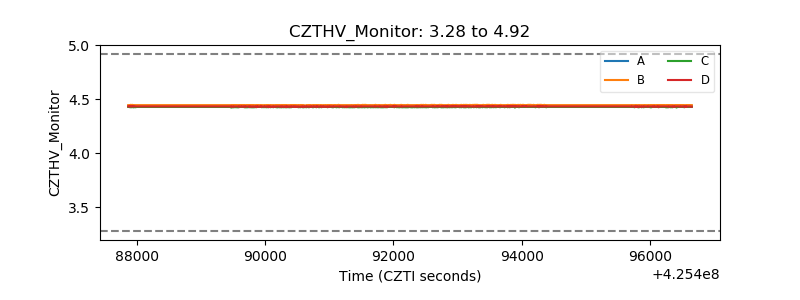 |
| D_VDD | 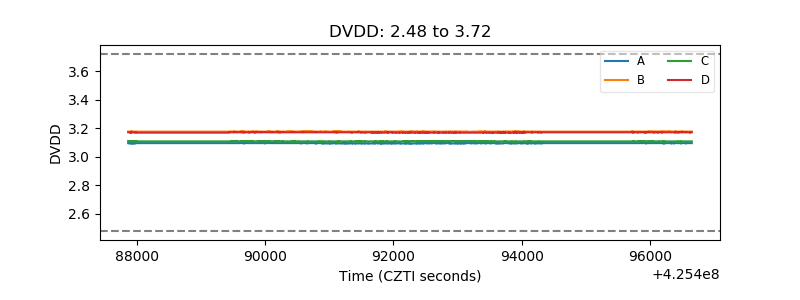 |
| Temperature 1 | 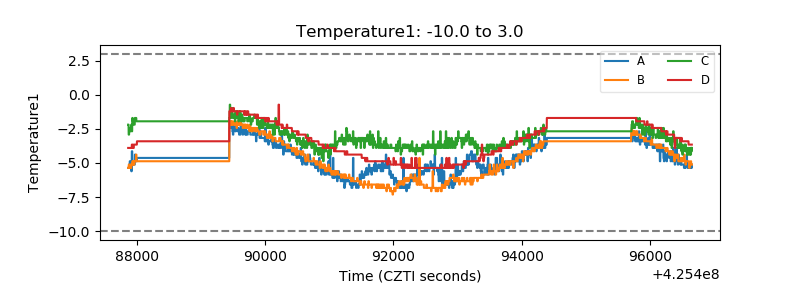 |
| Veto HV Monitor | 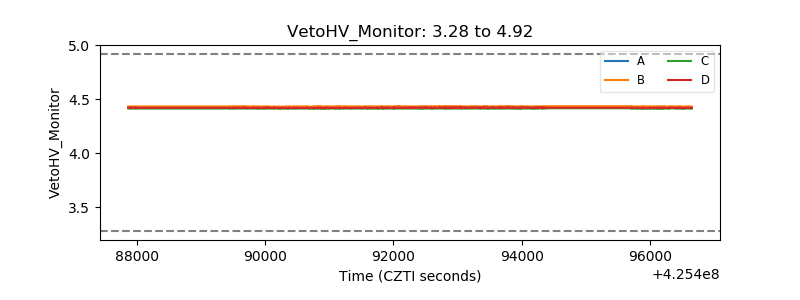 |
| Veto LLD | 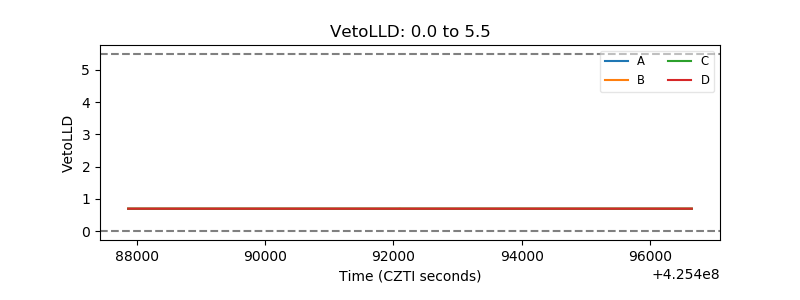 |
| Alpha Counter | 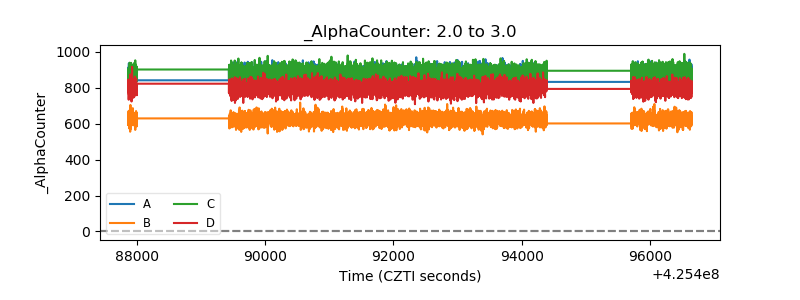 |
| _CPM_Rate | 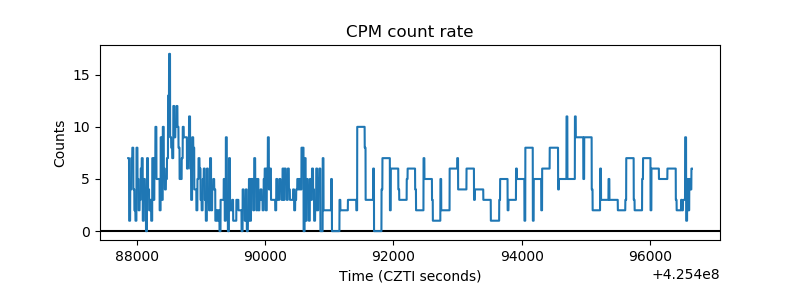 |
| CZT Counter | 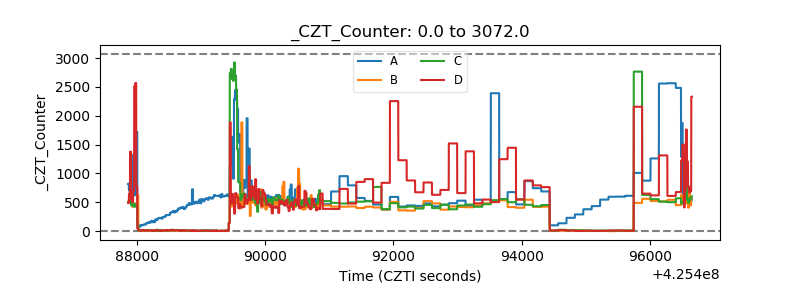 |
| +2.5 Volts monitor | 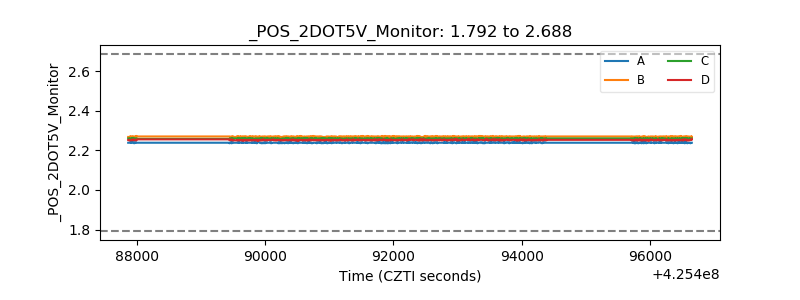 |
| +5 Volts monitor |  |
| _ROLL_ROT | 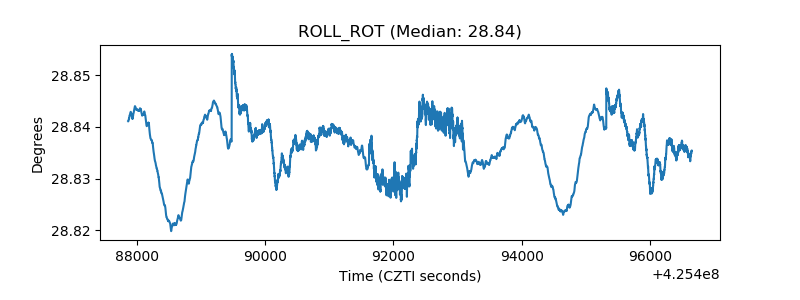 |
| _Roll_DEC | 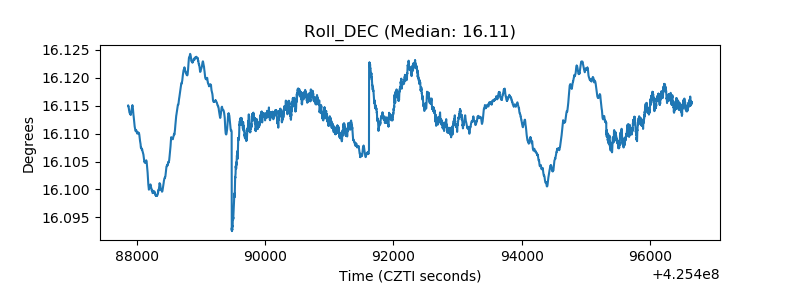 |
| _Roll_RA | 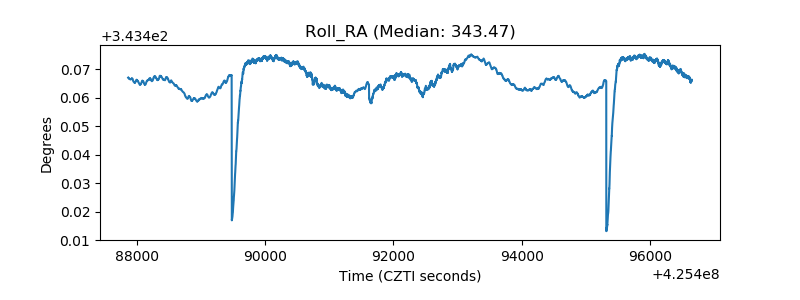 |
| Veto Counter | 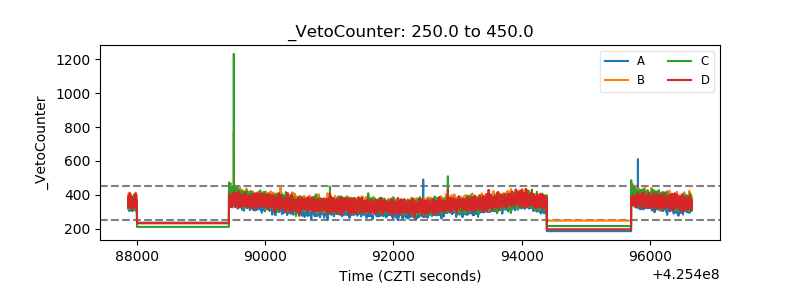 |