| Param | Original file | Final file |
|---|---|---|
| Filename | modeM0/AS1T05_124T01_9000005712_41874cztM0_level2.fits | modeM0/AS1T05_124T01_9000005712_41874cztM0_level2_quad_clean.evt |
| Size (bytes) | 1,148,696,640 | 241,701,120 |
| Size | 1.1 GB | 230.5 MB |
| Events in quadrant A | 11,093,654 | 1,578,980 |
| Events in quadrant B | 7,095,214 | 1,707,907 |
| Events in quadrant C | 8,854,431 | 1,564,565 |
| Events in quadrant D | 14,276,634 | 1,395,151 |
| Mode SS | |||
|---|---|---|---|
| Quadrant | BADHDUFLAG | Total packets | Discarded packets |
| A | 0 | 316 | 0 |
| B | 0 | 316 | 0 |
| C | 0 | 316 | 0 |
| D | 0 | 316 | 0 |
| Mode M9 | |||
|---|---|---|---|
| Quadrant | BADHDUFLAG | Total packets | Discarded packets |
| A | 0 | 42 | 0 |
| B | 0 | 42 | 0 |
| C | 0 | 42 | 0 |
| D | 0 | 42 | 0 |
| Mode M0 | |||
|---|---|---|---|
| Quadrant | BADHDUFLAG | Total packets | Discarded packets |
| A | 0 | 43008 | 3 |
| B | 0 | 32122 | 3 |
| C | 0 | 35803 | 3 |
| D | 0 | 53213 | 3 |
| Quadrant | Total seconds | Saturated seconds | Saturation percentage |
|---|---|---|---|
| A | 15526 | 937 | 6.035038% |
| B | 15527 | 29 | 0.186771% |
| C | 15526 | 499 | 3.213964% |
| D | 15526 | 1382 | 8.901198% |
Noise dominated data is calculated using 1-second bins in cleaned event files. If a bin has >2000 counts, and if more than 50% of those come from <1% of pixels, then it is considered to be noise-dominated and hence unusable.
| Quadrant | # 1 sec bins | Bins with >0 counts | Bins with >2000 counts | High rate bins dominated by noise | Noise dominated (total time) | Noise dominated (detector-on time) | Marked lightcurve |
|---|---|---|---|---|---|---|---|
| A | 19673 | 15529 | 760 | 760 | 3.86% | 4.89% | 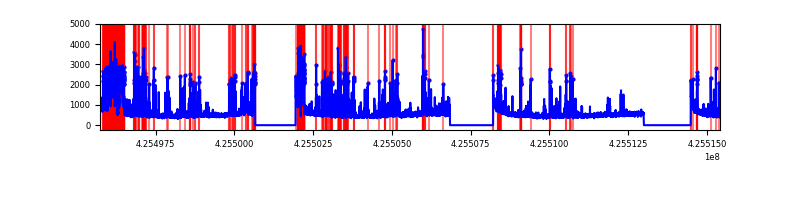 |
| B | 19674 | 15530 | 1 | 1 | 0.01% | 0.01% | 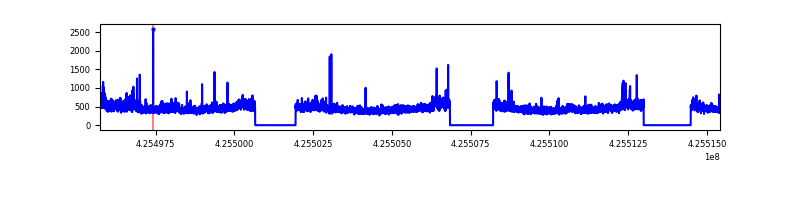 |
| C | 19673 | 15529 | 467 | 467 | 2.37% | 3.01% | 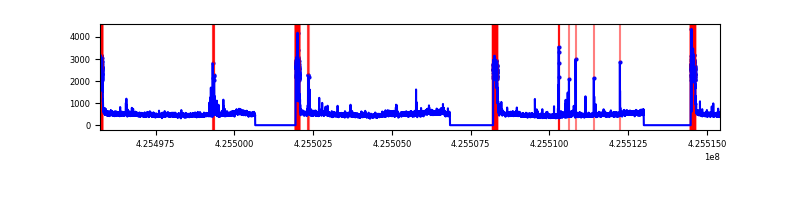 |
| D | 19673 | 15529 | 1351 | 1351 | 6.87% | 8.70% | 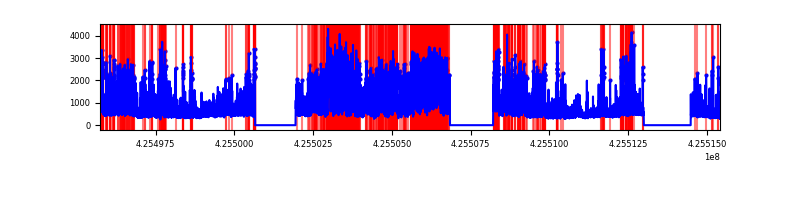 |
Top three noisy pixels from each quadrant. If the there are fewer than three noisy pixels in the level2.evt file, extra rows are filled as -1
| Pixel properties | Quadrant properties | ||||||
|---|---|---|---|---|---|---|---|
| Quadrant | DetID | PixID | Counts | Sigma | Mean | Median | Sigma |
| A | 14 | 24 | 3366207 | 9986.78 | 1645 | 1614 | 336.9 |
| A | 10 | 83 | 1276827 | 3785.09 | 1645 | 1614 | 336.9 |
| A | 14 | 250 | 46900 | 134.42 | 1645 | 1614 | 336.9 |
| B | 0 | 156 | 309470 | 946.07 | 1677 | 1628 | 325.4 |
| B | 12 | 0 | 52861 | 157.45 | 1677 | 1628 | 325.4 |
| B | 0 | 245 | 50387 | 149.85 | 1677 | 1628 | 325.4 |
| C | 0 | 10 | 1761531 | 4683.41 | 1602 | 1610 | 375.8 |
| C | 15 | 214 | 606796 | 1610.49 | 1602 | 1610 | 375.8 |
| C | 14 | 254 | 148080 | 389.78 | 1602 | 1610 | 375.8 |
| D | 12 | 79 | 5249354 | 13516.84 | 1589 | 1544 | 388.2 |
| D | 2 | 249 | 1414537 | 3639.46 | 1589 | 1544 | 388.2 |
| D | 13 | 249 | 944606 | 2429.05 | 1589 | 1544 | 388.2 |
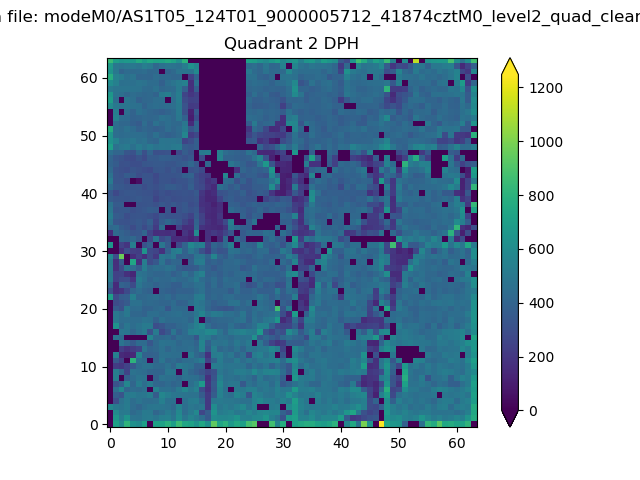
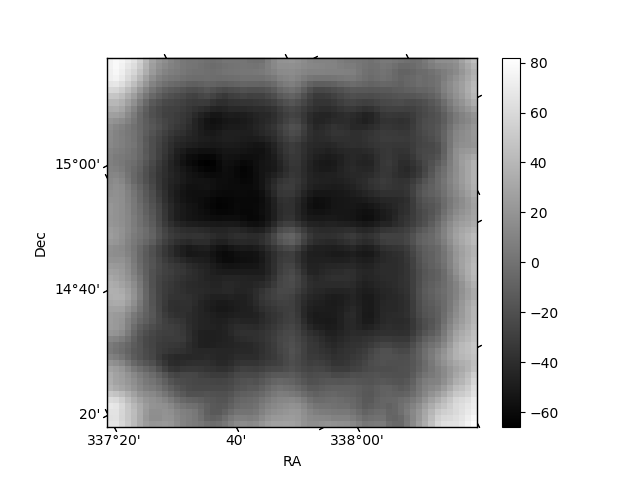
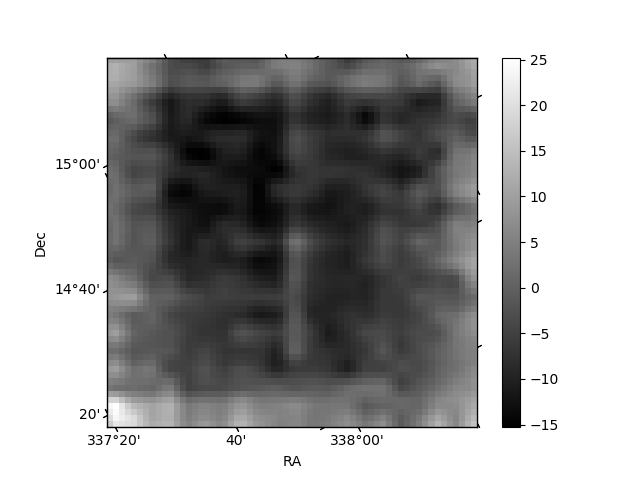
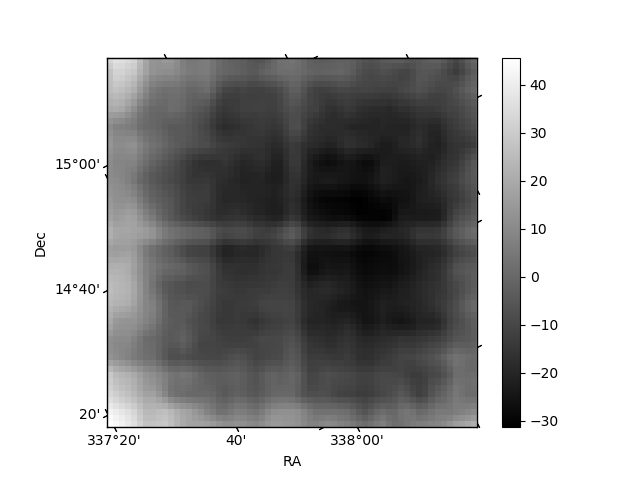
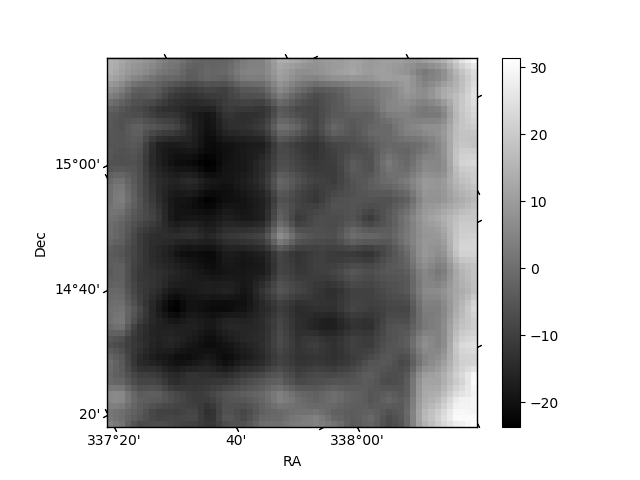
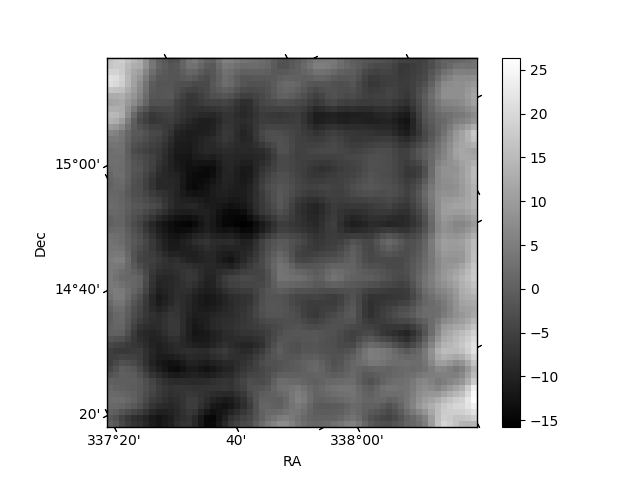
Histogram calculated using DETX and DETY for each event in the final _common_clean file
| Quadrant A | 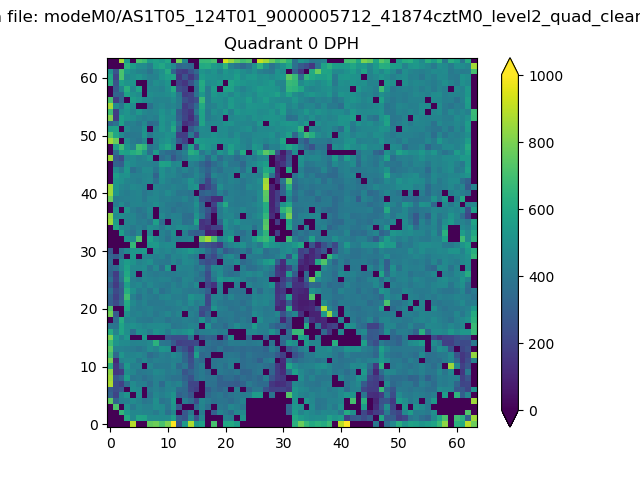 |
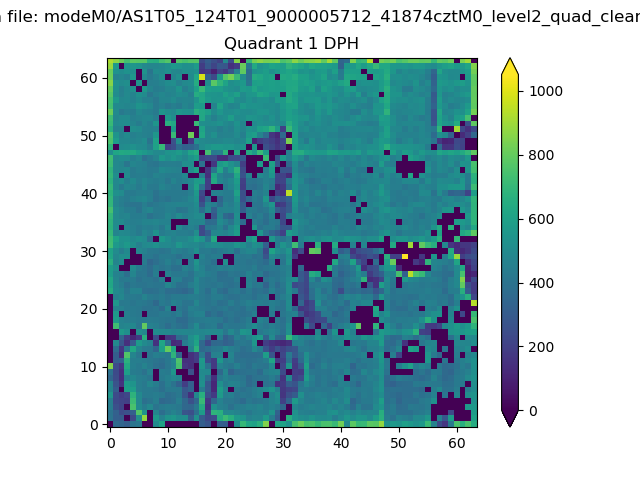 |
Quadrant B |
|---|---|---|---|
| Quadrant D | 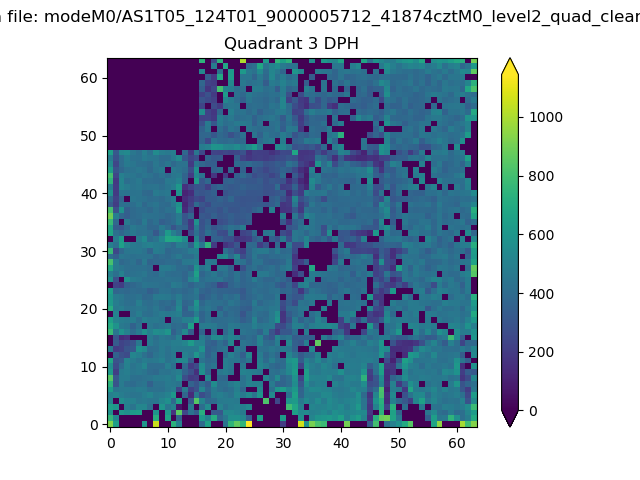 |
 |
Quadrant C |
| Plot type | Count rate plots | Images |
|---|---|---|
| Comparison with Poisson distribution Blue bars denote a histogram of data divided into 1 sec bins. Red curve is a Poisson curve with rate = median count rate of data. |
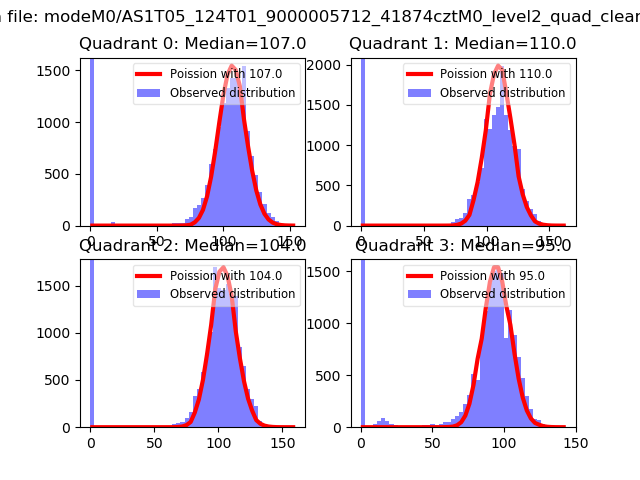 |
 |
| Quadrant-wise count rates Data is divided into 100 sec bins |
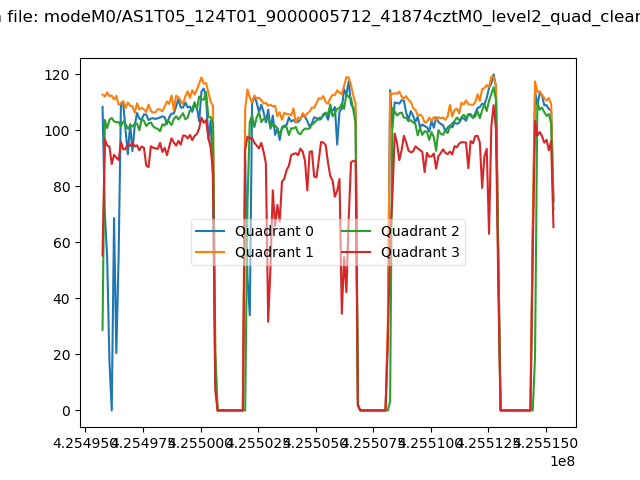 |
|
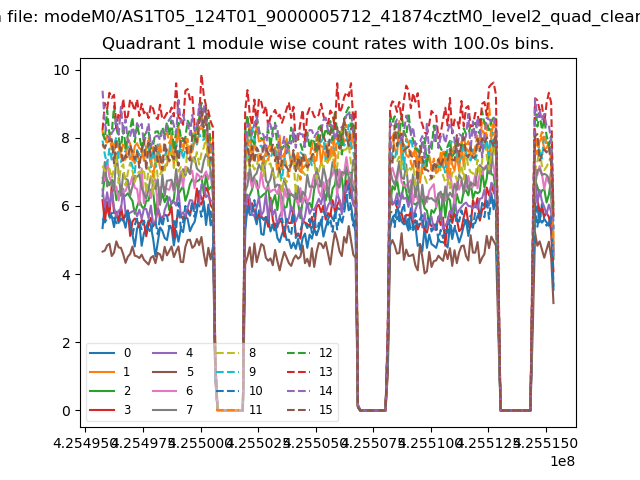
| Module-wise count rates for Quadrant A Data is divided into 100 sec bins |
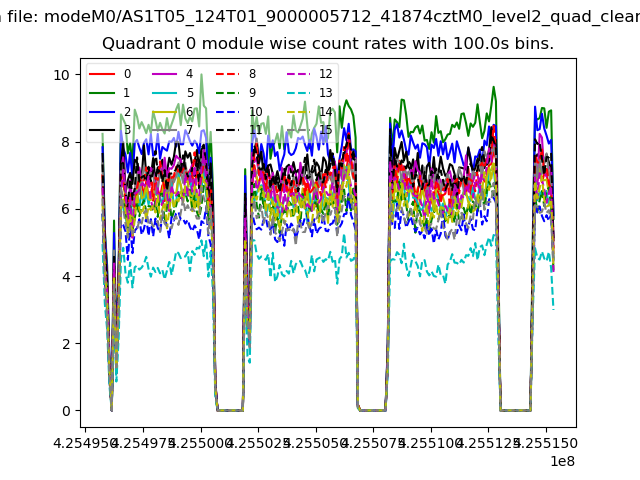 |
 |
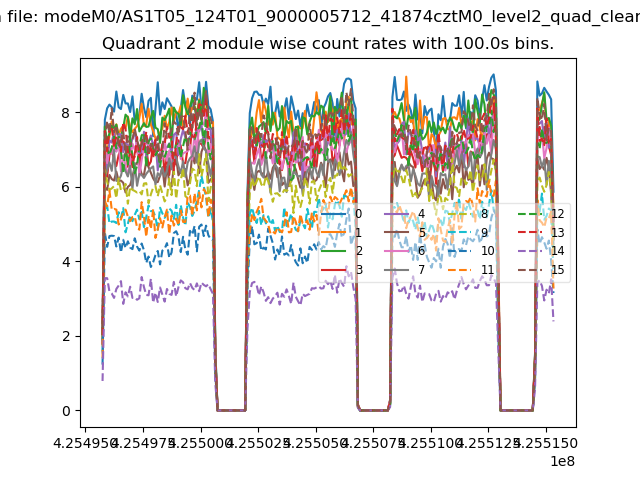
| Module-wise count rates for Quadrant B Data is divided into 100 sec bins |
 |
 |
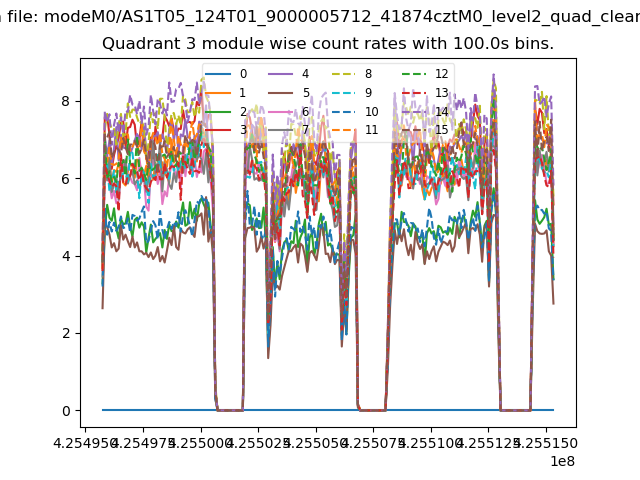
| Module-wise count rates for Quadrant C Data is divided into 100 sec bins |
 |
 |
| Module-wise count rates for Quadrant D Data is divided into 100 sec bins |
 |
 |
| Parameter | Plot |
|---|---|
| CZT HV Monitor |  |
| D_VDD | 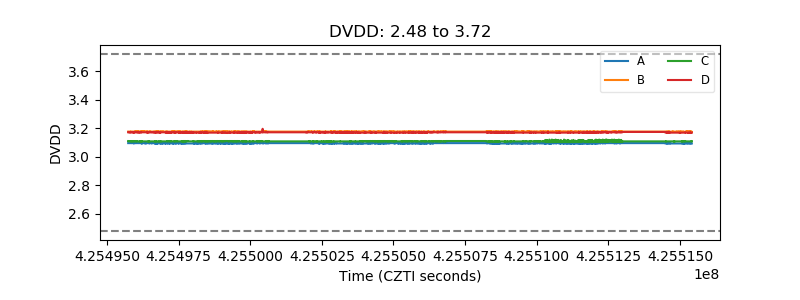 |
| Temperature 1 | 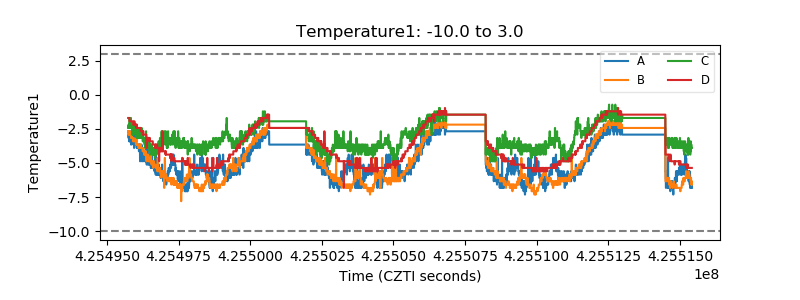 |
| Veto HV Monitor | 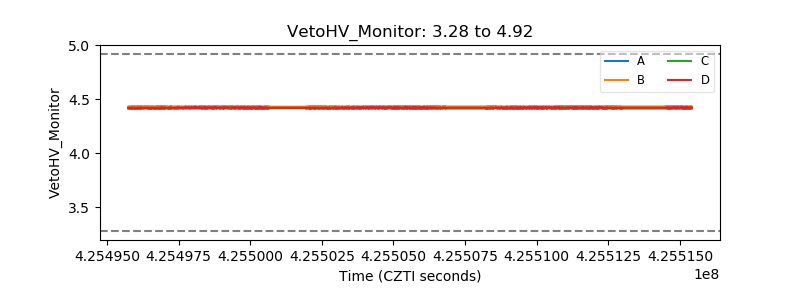 |
| Veto LLD | 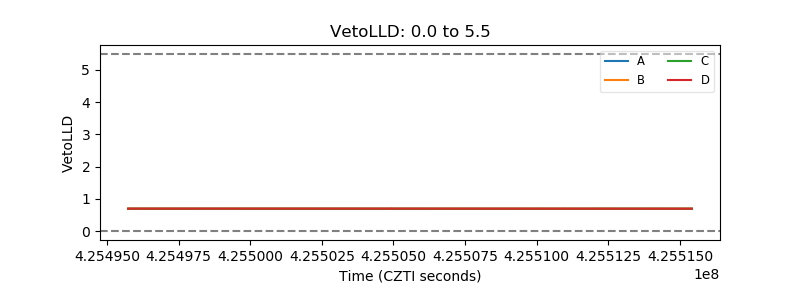 |
| Alpha Counter | 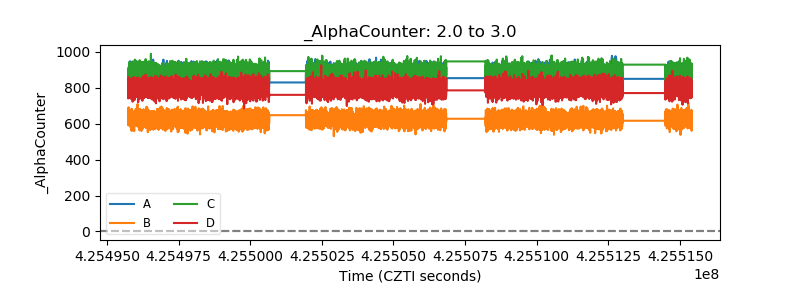 |
| _CPM_Rate | 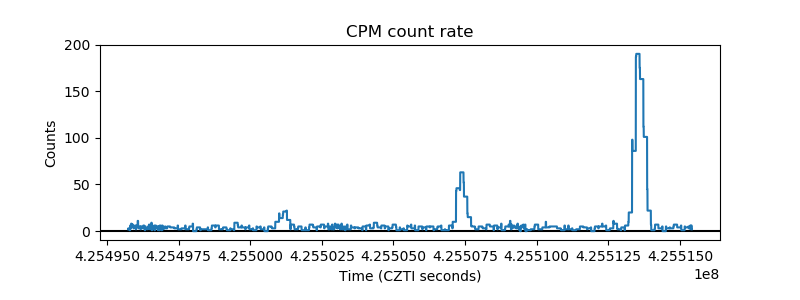 |
| CZT Counter | 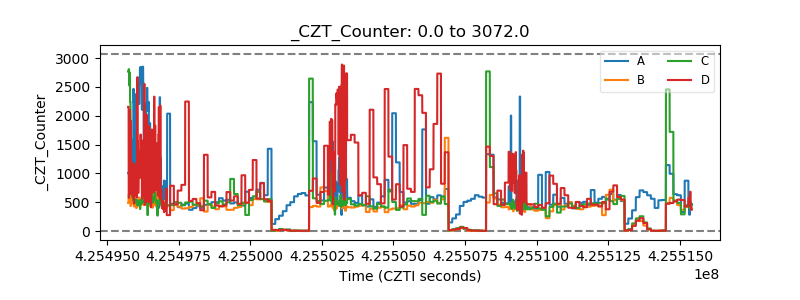 |
| +2.5 Volts monitor | 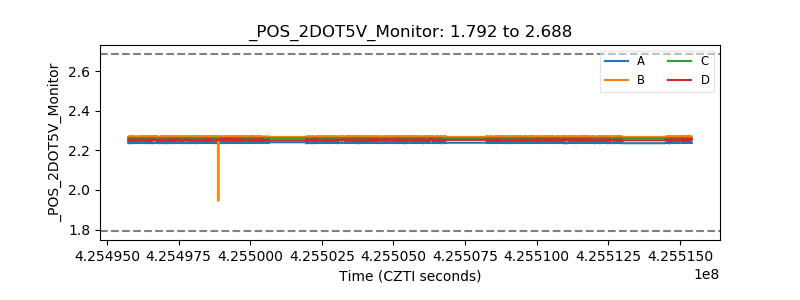 |
| +5 Volts monitor | 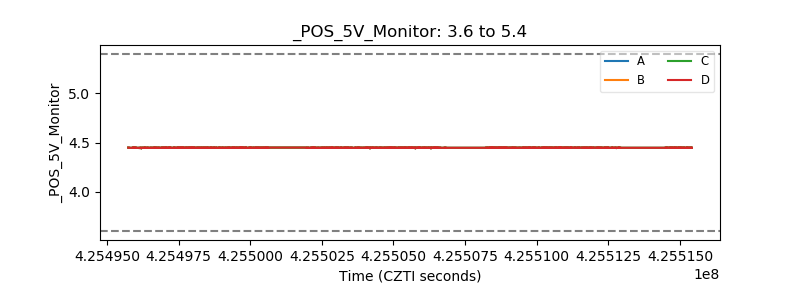 |
| _ROLL_ROT | 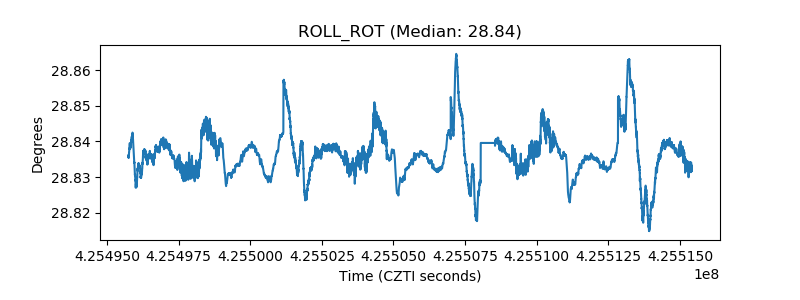 |
| _Roll_DEC | 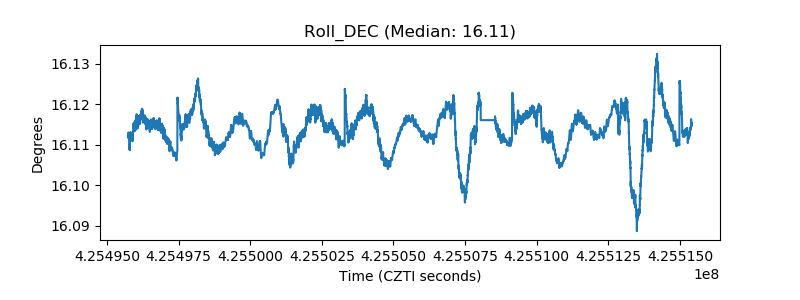 |
| _Roll_RA | 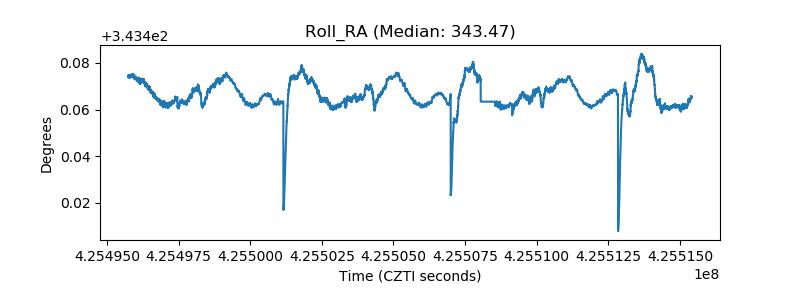 |
| Veto Counter | 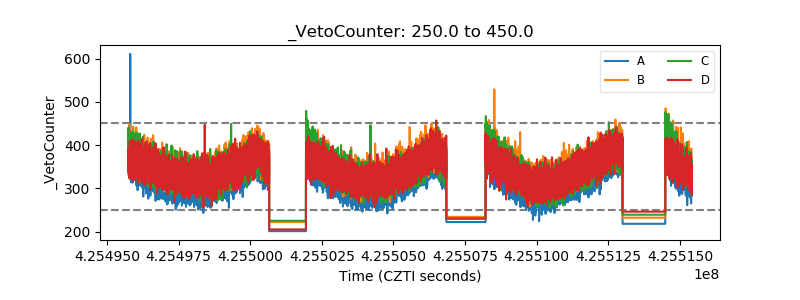 |