| Param | Original file | Final file |
|---|---|---|
| Filename | modeM0/AS1T05_124T01_9000005712_41875cztM0_level2.fits | modeM0/AS1T05_124T01_9000005712_41875cztM0_level2_quad_clean.evt |
| Size (bytes) | 364,380,480 | 87,716,160 |
| Size | 347.5 MB | 83.7 MB |
| Events in quadrant A | 4,104,007 | 578,592 |
| Events in quadrant B | 2,414,330 | 617,135 |
| Events in quadrant C | 3,176,234 | 550,419 |
| Events in quadrant D | 3,363,207 | 523,023 |
| Mode SS | |||
|---|---|---|---|
| Quadrant | BADHDUFLAG | Total packets | Discarded packets |
| A | 0 | 114 | 0 |
| B | 0 | 114 | 0 |
| C | 0 | 114 | 0 |
| D | 0 | 114 | 0 |
| Mode M9 | |||
|---|---|---|---|
| Quadrant | BADHDUFLAG | Total packets | Discarded packets |
| A | 0 | 25 | 0 |
| B | 0 | 25 | 0 |
| C | 0 | 26 | 0 |
| D | 0 | 26 | 0 |
| Mode M0 | |||
|---|---|---|---|
| Quadrant | BADHDUFLAG | Total packets | Discarded packets |
| A | 0 | 15791 | 2 |
| B | 0 | 11237 | 2 |
| C | 0 | 12973 | 2 |
| D | 0 | 14017 | 3 |
| Quadrant | Total seconds | Saturated seconds | Saturation percentage |
|---|---|---|---|
| A | 5523 | 318 | 5.757740% |
| B | 5523 | 9 | 0.162955% |
| C | 5523 | 265 | 4.798117% |
| D | 5522 | 202 | 3.658095% |
Noise dominated data is calculated using 1-second bins in cleaned event files. If a bin has >2000 counts, and if more than 50% of those come from <1% of pixels, then it is considered to be noise-dominated and hence unusable.
| Quadrant | # 1 sec bins | Bins with >0 counts | Bins with >2000 counts | High rate bins dominated by noise | Noise dominated (total time) | Noise dominated (detector-on time) | Marked lightcurve |
|---|---|---|---|---|---|---|---|
| A | 7136 | 5524 | 231 | 231 | 3.24% | 4.18% | 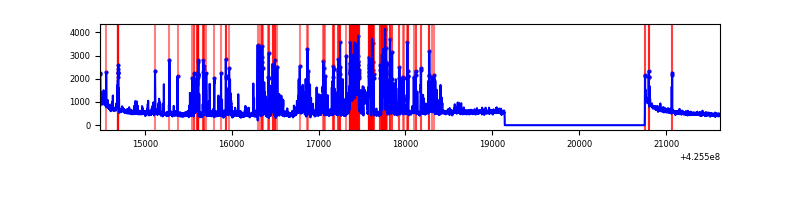 |
| B | 7136 | 5524 | 0 | 0 | 0.00% | 0.00% | 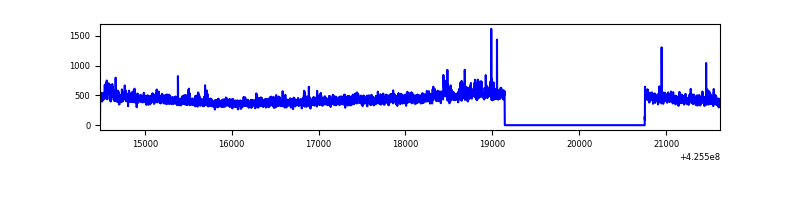 |
| C | 7136 | 5524 | 249 | 249 | 3.49% | 4.51% | 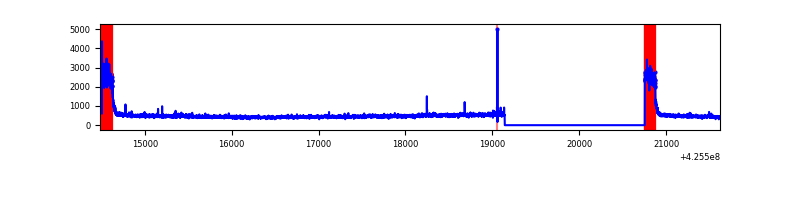 |
| D | 7135 | 5523 | 194 | 194 | 2.72% | 3.51% | 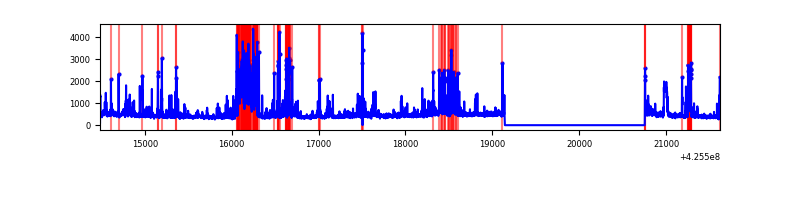 |
Top three noisy pixels from each quadrant. If the there are fewer than three noisy pixels in the level2.evt file, extra rows are filled as -1
| Pixel properties | Quadrant properties | ||||||
|---|---|---|---|---|---|---|---|
| Quadrant | DetID | PixID | Counts | Sigma | Mean | Median | Sigma |
| A | 14 | 24 | 1316175 | 10989.0 | 579 | 567 | 119.7 |
| A | 10 | 83 | 526417 | 4392.31 | 579 | 567 | 119.7 |
| A | 2 | 79 | 11235 | 89.11 | 579 | 567 | 119.7 |
| B | 0 | 156 | 42527 | 359.66 | 591 | 574 | 116.6 |
| B | 0 | 190 | 22040 | 184.03 | 591 | 574 | 116.6 |
| B | 12 | 111 | 14675 | 120.89 | 591 | 574 | 116.6 |
| C | 0 | 10 | 762071 | 5797.98 | 559 | 562 | 131.3 |
| C | 15 | 214 | 216945 | 1647.5 | 559 | 562 | 131.3 |
| C | 15 | 111 | 9891 | 71.03 | 559 | 562 | 131.3 |
| D | 13 | 249 | 541575 | 3856.46 | 569 | 553 | 140.3 |
| D | 2 | 249 | 362122 | 2577.3 | 569 | 553 | 140.3 |
| D | 13 | 112 | 77109 | 545.7 | 569 | 553 | 140.3 |
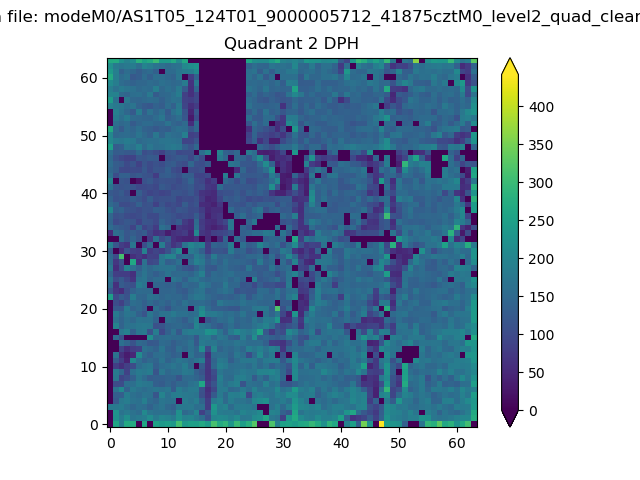
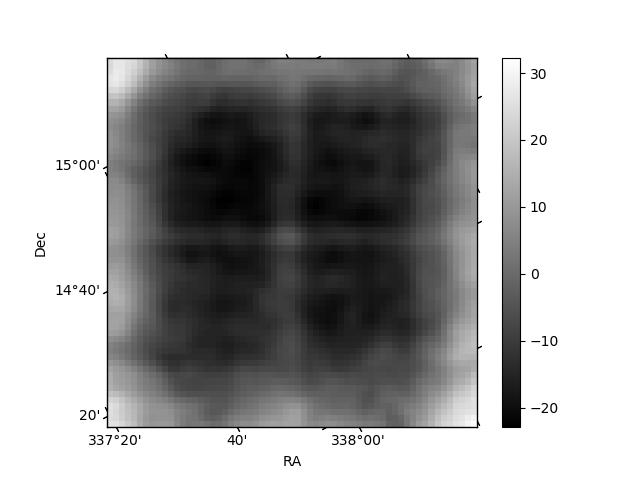
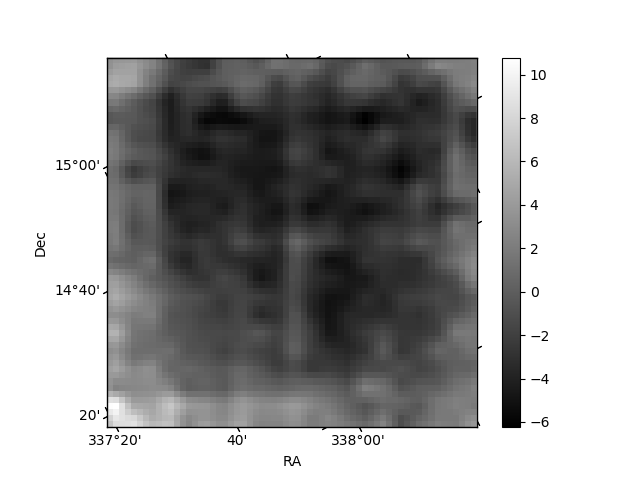
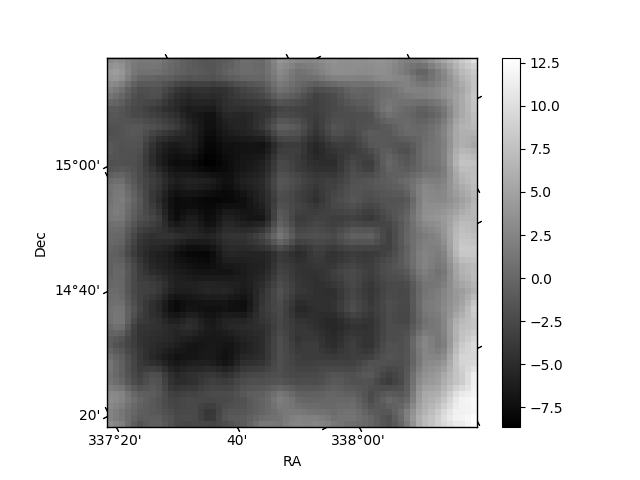
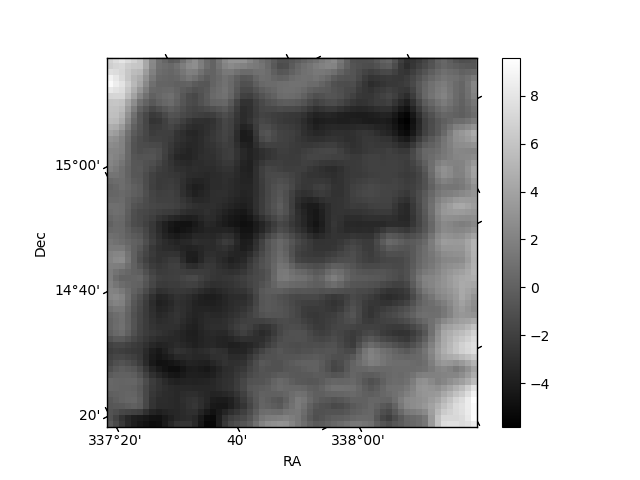
Histogram calculated using DETX and DETY for each event in the final _common_clean file
| Quadrant A | 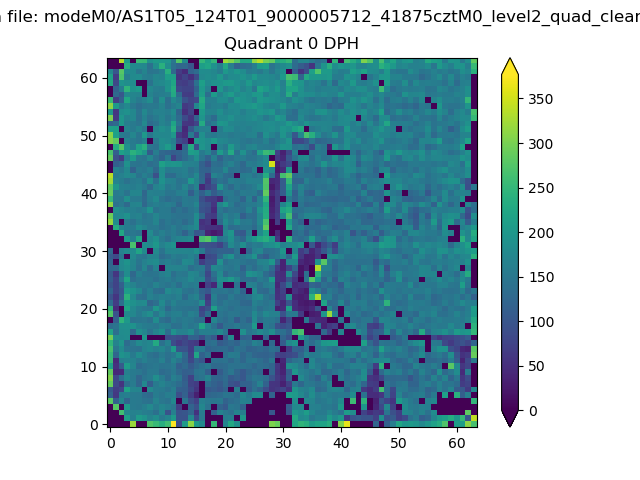 |
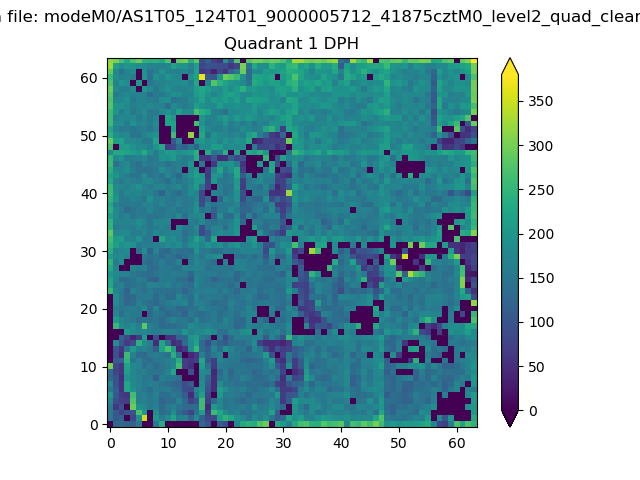 |
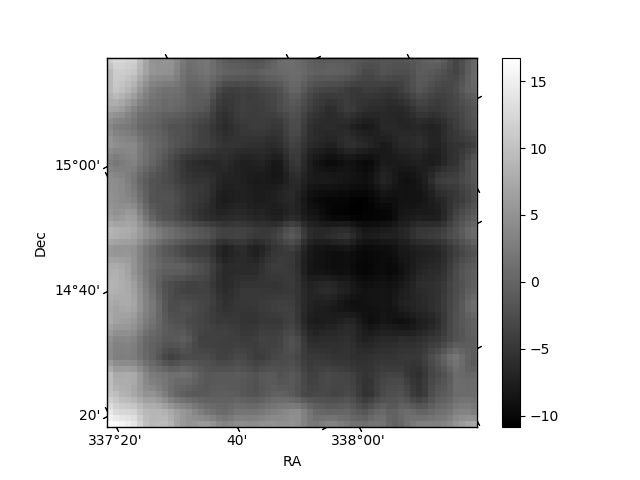
Quadrant B |
|---|---|---|---|
| Quadrant D | 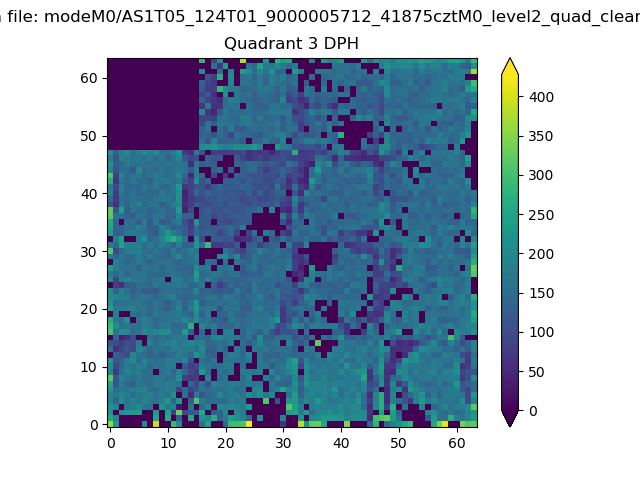 |
 |
Quadrant C |
| Plot type | Count rate plots | Images |
|---|---|---|
| Comparison with Poisson distribution Blue bars denote a histogram of data divided into 1 sec bins. Red curve is a Poisson curve with rate = median count rate of data. |
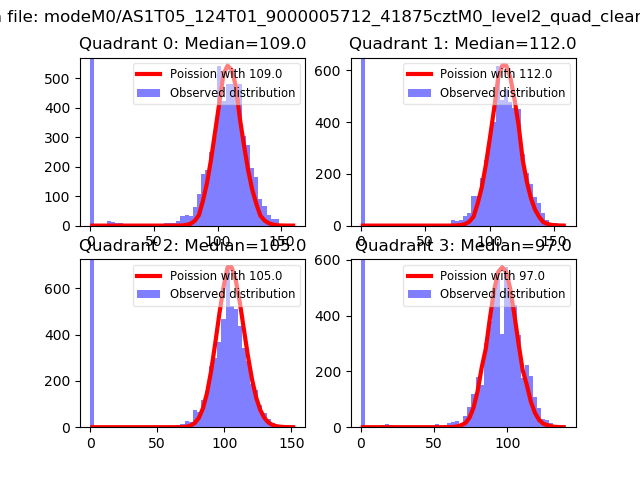 |
 |
| Quadrant-wise count rates Data is divided into 100 sec bins |
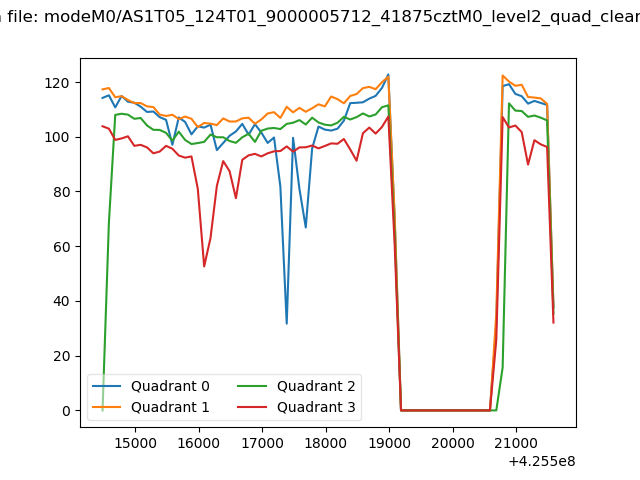 |
|
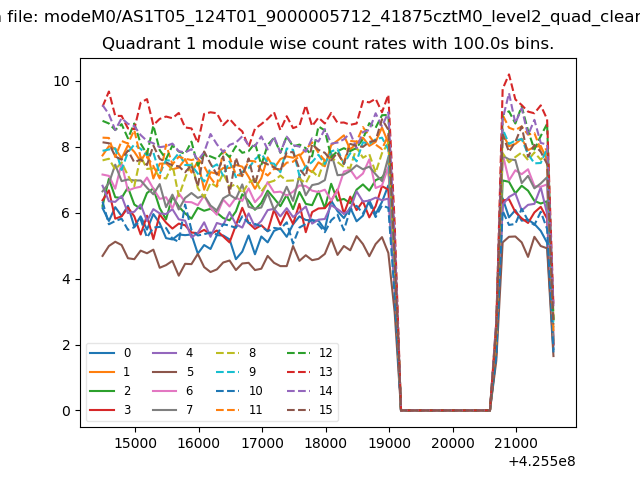
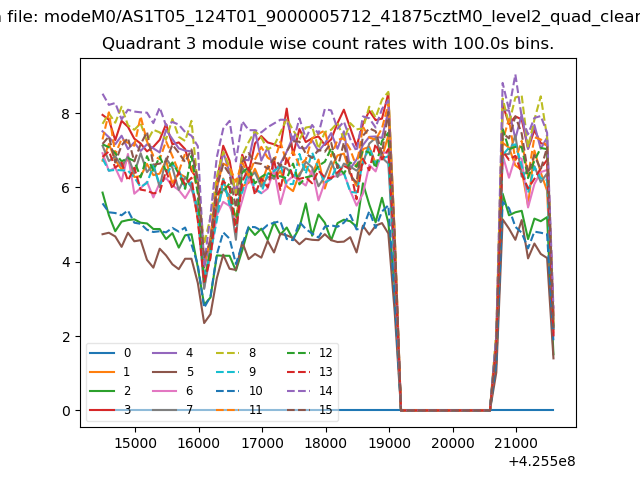
| Module-wise count rates for Quadrant A Data is divided into 100 sec bins |
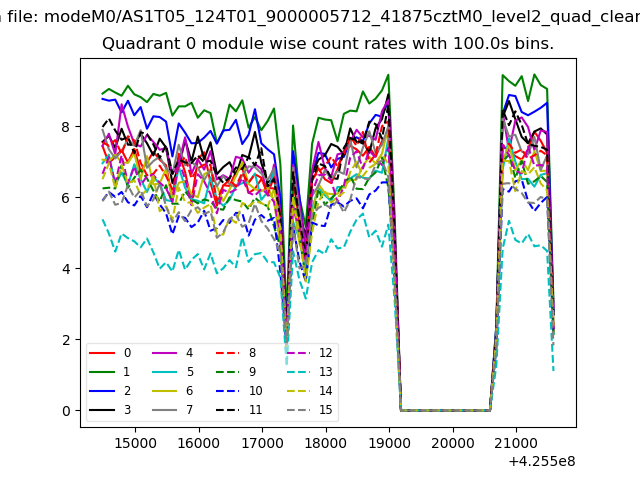 |
 |
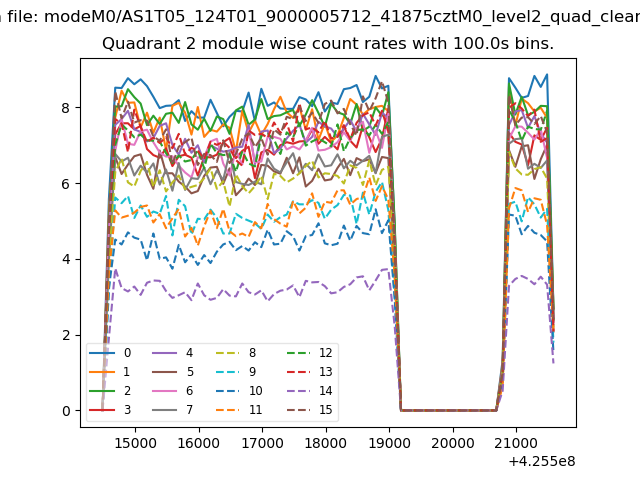
| Module-wise count rates for Quadrant B Data is divided into 100 sec bins |
 |
 |
| Module-wise count rates for Quadrant C Data is divided into 100 sec bins |
 |
 |
| Module-wise count rates for Quadrant D Data is divided into 100 sec bins |
 |
 |
| Parameter | Plot |
|---|---|
| CZT HV Monitor | 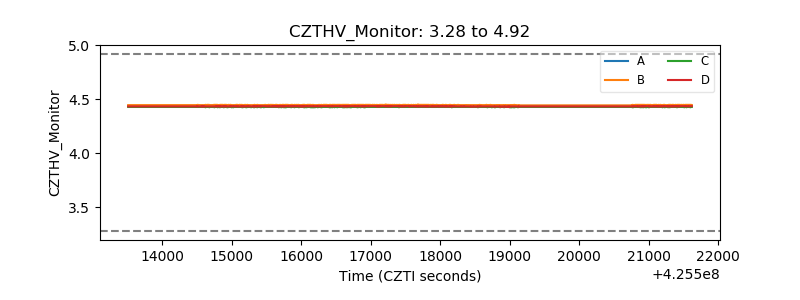 |
| D_VDD | 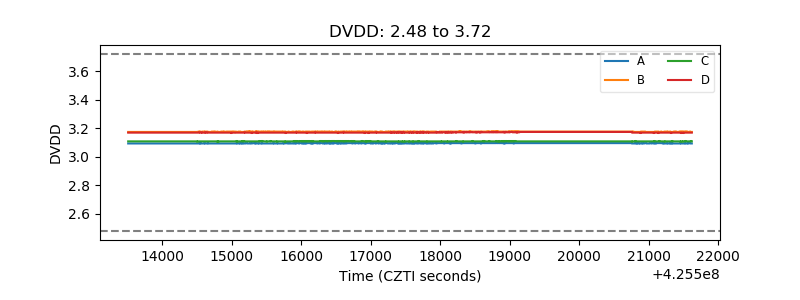 |
| Temperature 1 | 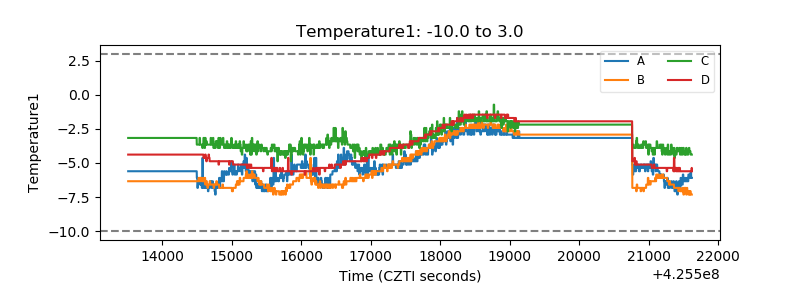 |
| Veto HV Monitor | 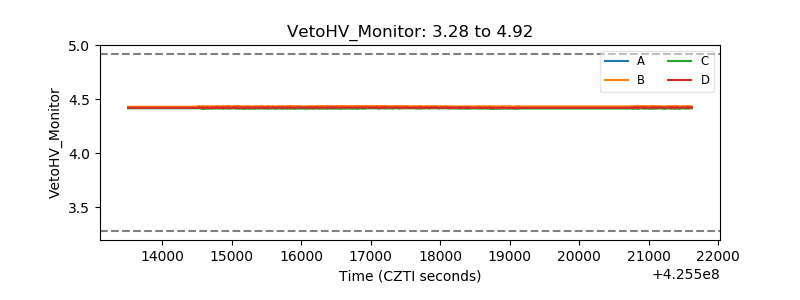 |
| Veto LLD | 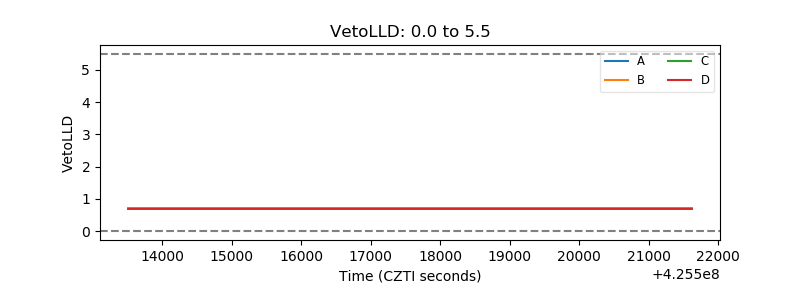 |
| Alpha Counter | 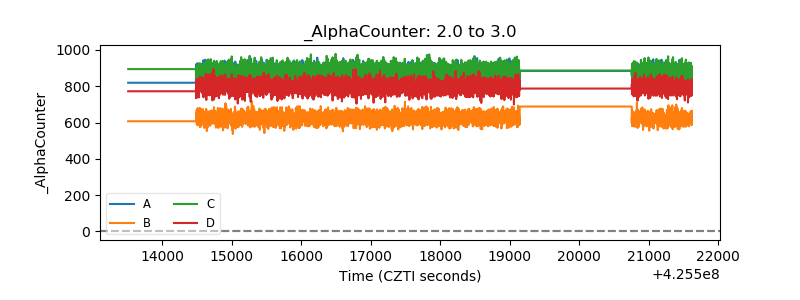 |
| _CPM_Rate | 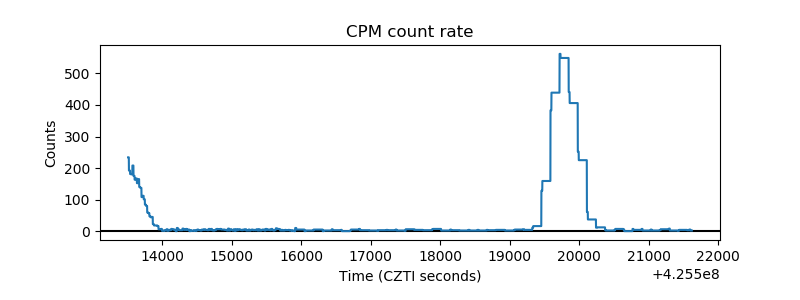 |
| CZT Counter | 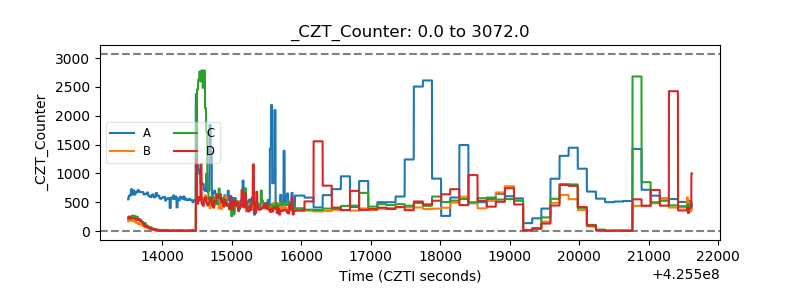 |
| +2.5 Volts monitor | 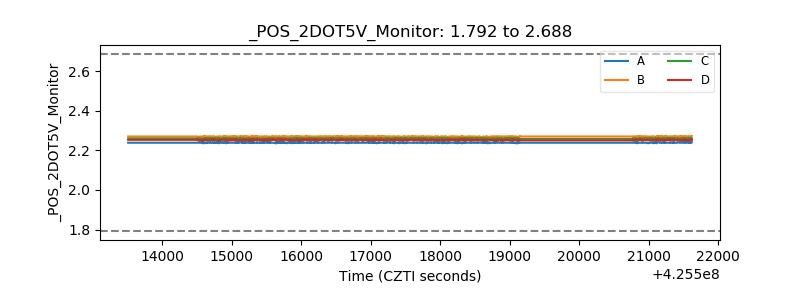 |
| +5 Volts monitor | 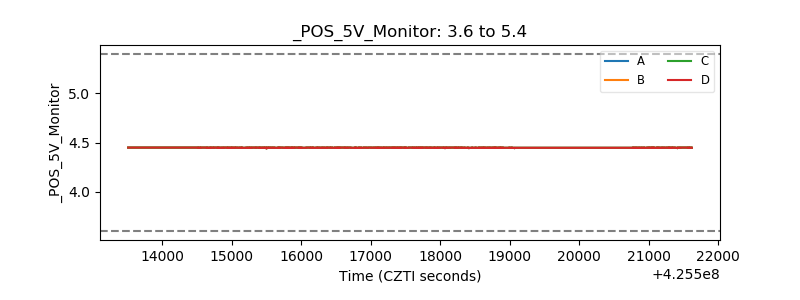 |
| _ROLL_ROT | 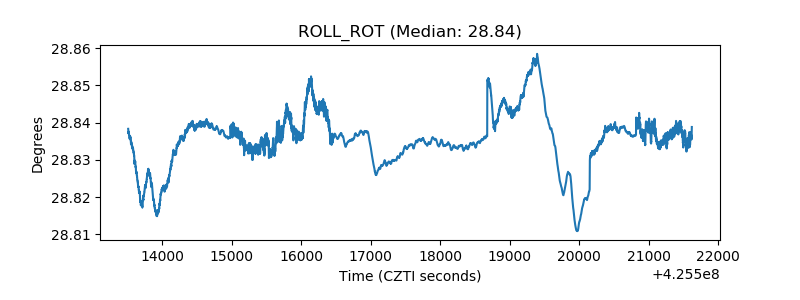 |
| _Roll_DEC |  |
| _Roll_RA | 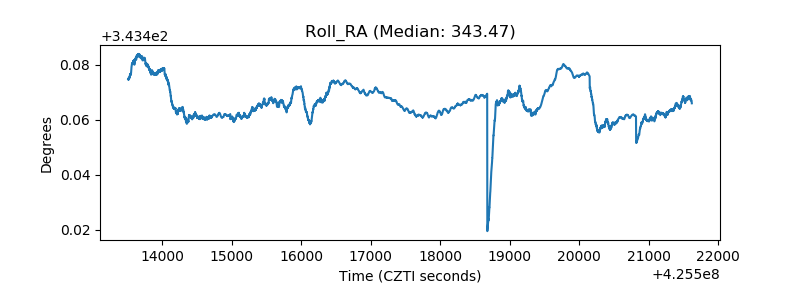 |
| Veto Counter | 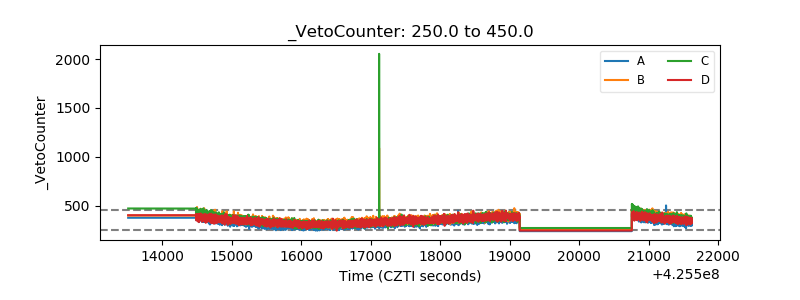 |