| Param | Original file | Final file |
|---|---|---|
| Filename | modeM0/AS1T05_124T01_9000005712_41880cztM0_level2.fits | modeM0/AS1T05_124T01_9000005712_41880cztM0_level2_quad_clean.evt |
| Size (bytes) | 356,328,000 | 88,974,720 |
| Size | 339.8 MB | 84.9 MB |
| Events in quadrant A | 4,106,935 | 594,292 |
| Events in quadrant B | 2,484,726 | 639,934 |
| Events in quadrant C | 3,216,160 | 559,653 |
| Events in quadrant D | 2,986,015 | 543,451 |
| Mode SS | |||
|---|---|---|---|
| Quadrant | BADHDUFLAG | Total packets | Discarded packets |
| A | 0 | 106 | 0 |
| B | 0 | 105 | 1 |
| C | 0 | 105 | 0 |
| D | 0 | 106 | 0 |
| Mode M9 | |||
|---|---|---|---|
| Quadrant | BADHDUFLAG | Total packets | Discarded packets |
| A | 0 | 20 | 0 |
| B | 0 | 20 | 0 |
| C | 0 | 20 | 0 |
| D | 0 | 20 | 0 |
| Mode M0 | |||
|---|---|---|---|
| Quadrant | BADHDUFLAG | Total packets | Discarded packets |
| A | 0 | 15571 | 94 |
| B | 0 | 10646 | 29 |
| C | 0 | 12517 | 46 |
| D | 0 | 12299 | 28 |
| Quadrant | Total seconds | Saturated seconds | Saturation percentage |
|---|---|---|---|
| A | 5083 | 356 | 7.003738% |
| B | 5091 | 10 | 0.196425% |
| C | 5083 | 250 | 4.918355% |
| D | 5096 | 109 | 2.138932% |
Noise dominated data is calculated using 1-second bins in cleaned event files. If a bin has >2000 counts, and if more than 50% of those come from <1% of pixels, then it is considered to be noise-dominated and hence unusable.
| Quadrant | # 1 sec bins | Bins with >0 counts | Bins with >2000 counts | High rate bins dominated by noise | Noise dominated (total time) | Noise dominated (detector-on time) | Marked lightcurve |
|---|---|---|---|---|---|---|---|
| A | 7203 | 5105 | 231 | 231 | 3.21% | 4.52% | 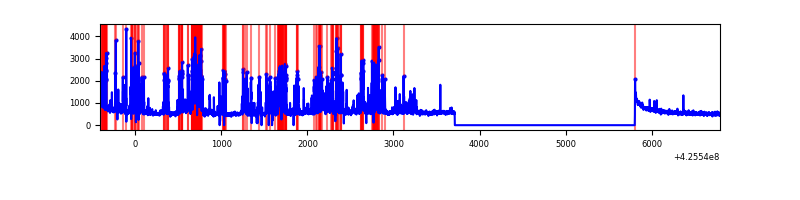 |
| B | 7203 | 5104 | 4 | 4 | 0.06% | 0.08% | 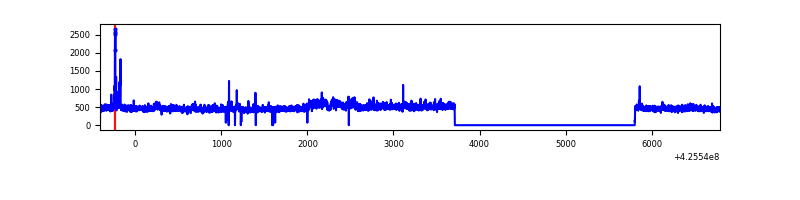 |
| C | 7204 | 5102 | 247 | 247 | 3.43% | 4.84% | 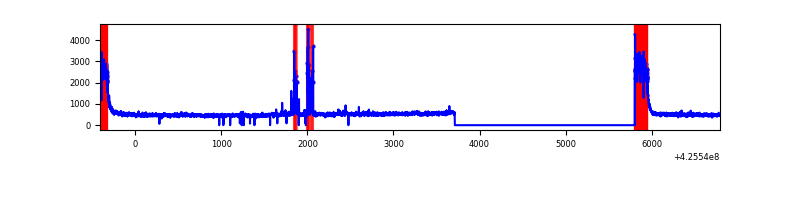 |
| D | 7204 | 5107 | 102 | 102 | 1.42% | 2.00% | 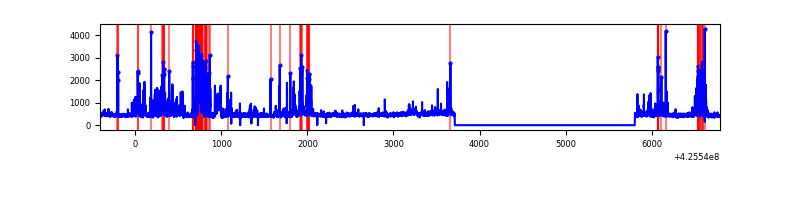 |
Top three noisy pixels from each quadrant. If the there are fewer than three noisy pixels in the level2.evt file, extra rows are filled as -1
| Pixel properties | Quadrant properties | ||||||
|---|---|---|---|---|---|---|---|
| Quadrant | DetID | PixID | Counts | Sigma | Mean | Median | Sigma |
| A | 14 | 24 | 1287980 | 10870.37 | 583 | 572 | 118.4 |
| A | 10 | 83 | 477662 | 4028.36 | 583 | 572 | 118.4 |
| A | 7 | 3 | 84021 | 704.61 | 583 | 572 | 118.4 |
| B | 0 | 156 | 100299 | 874.12 | 591 | 576 | 114.1 |
| B | 3 | 112 | 38451 | 331.99 | 591 | 576 | 114.1 |
| B | 0 | 245 | 23098 | 197.42 | 591 | 576 | 114.1 |
| C | 0 | 10 | 735291 | 5731.35 | 551 | 555 | 128.2 |
| C | 15 | 214 | 200979 | 1563.42 | 551 | 555 | 128.2 |
| C | 14 | 254 | 129437 | 1005.35 | 551 | 555 | 128.2 |
| D | 12 | 6 | 462892 | 3314.78 | 571 | 557 | 139.5 |
| D | 13 | 249 | 145939 | 1042.34 | 571 | 557 | 139.5 |
| D | 5 | 222 | 99807 | 711.58 | 571 | 557 | 139.5 |
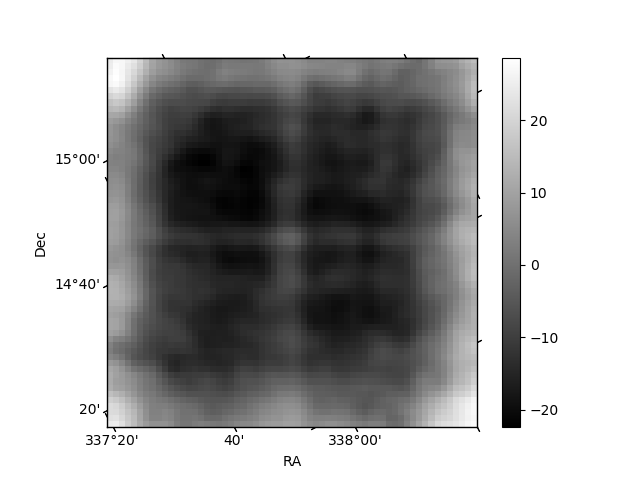
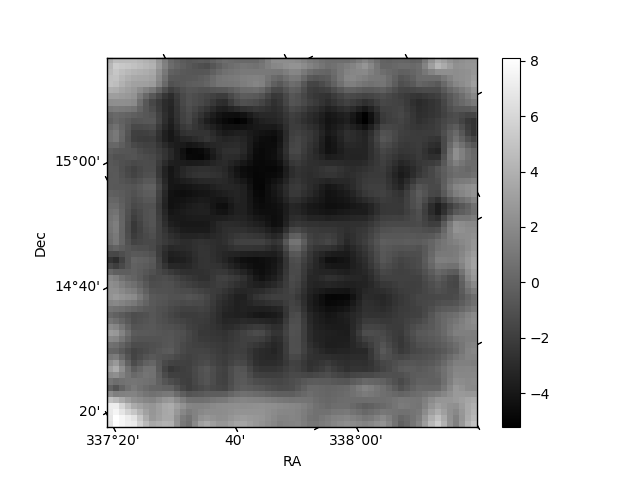
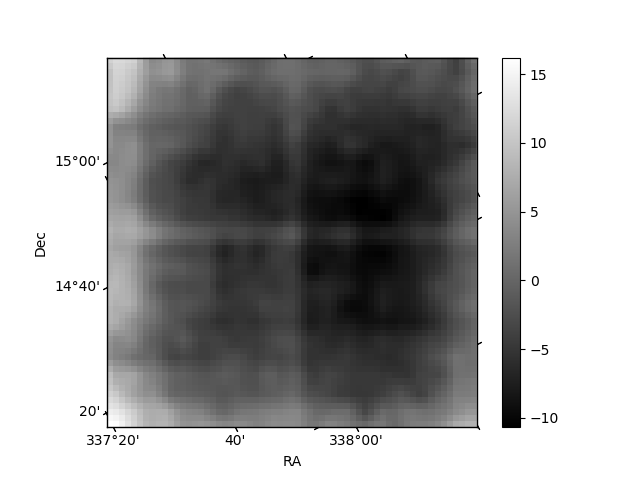
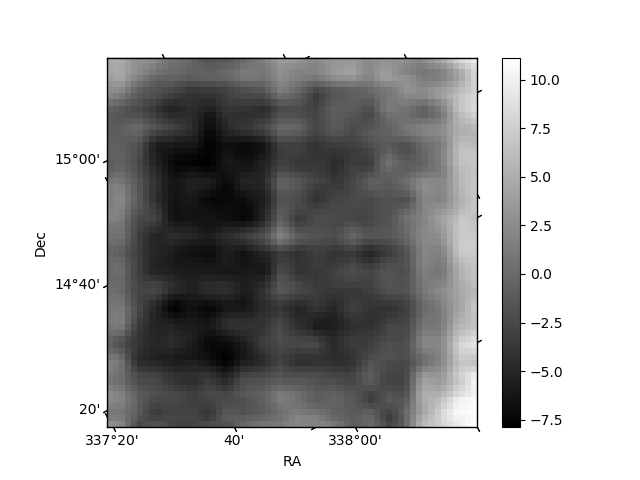
Histogram calculated using DETX and DETY for each event in the final _common_clean file
| Quadrant A | 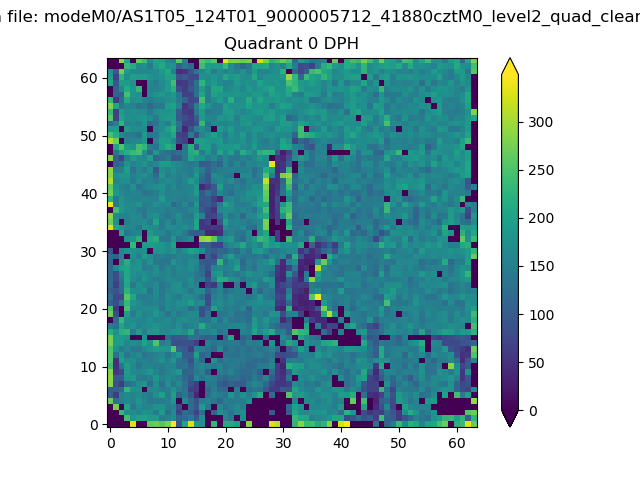 |
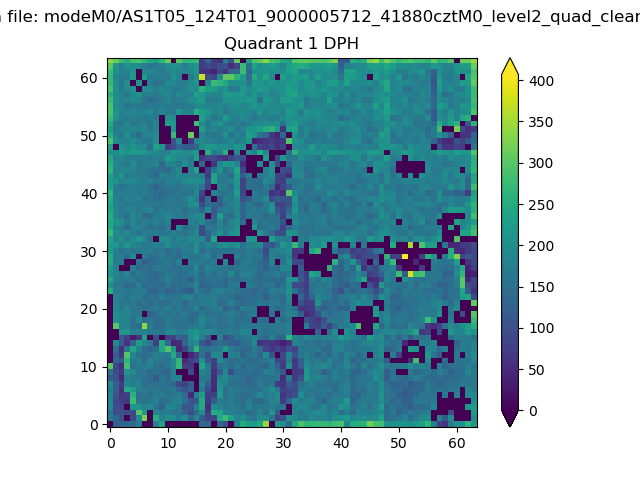 |
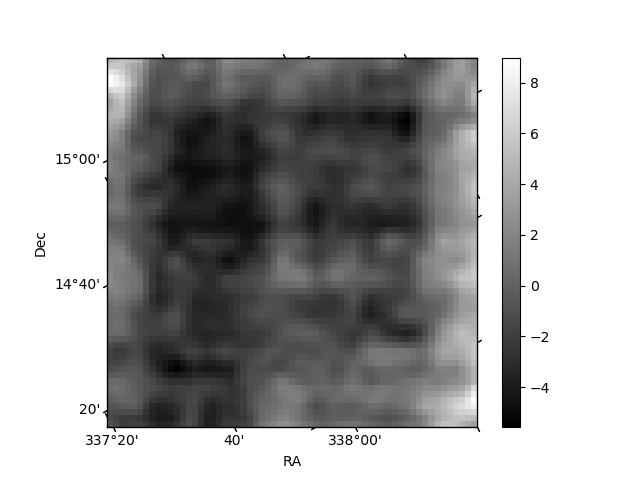
Quadrant B |
|---|---|---|---|
| Quadrant D | 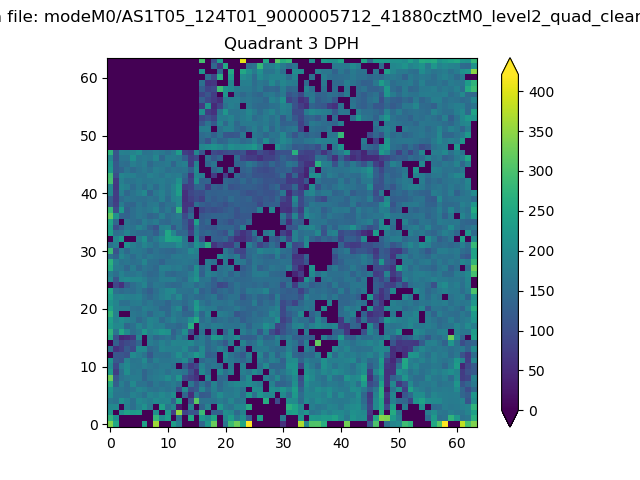 |
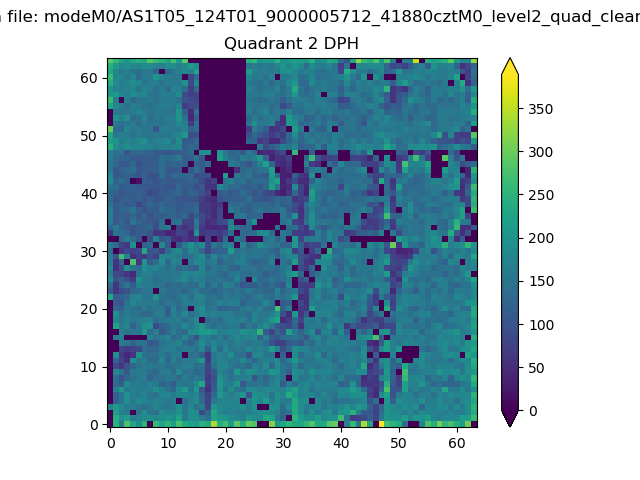 |
Quadrant C |
| Plot type | Count rate plots | Images |
|---|---|---|
| Comparison with Poisson distribution Blue bars denote a histogram of data divided into 1 sec bins. Red curve is a Poisson curve with rate = median count rate of data. |
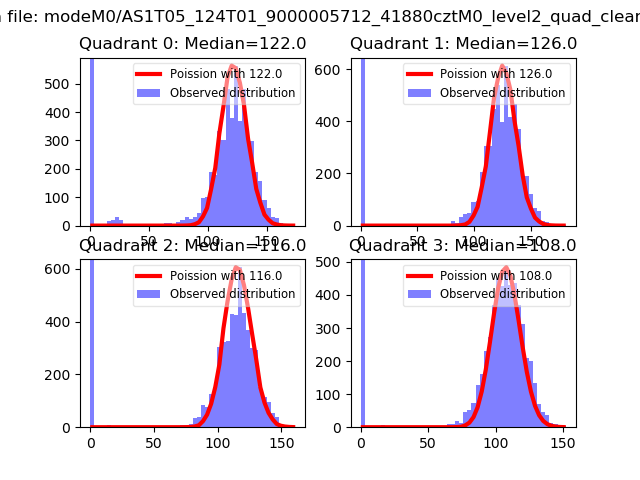 |
 |
| Quadrant-wise count rates Data is divided into 100 sec bins |
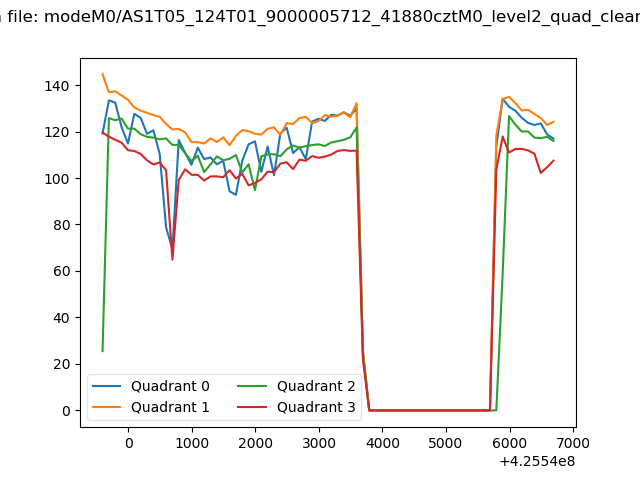 |
|
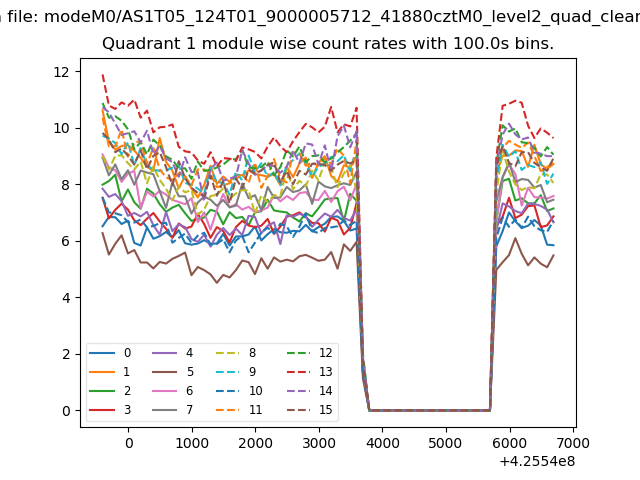
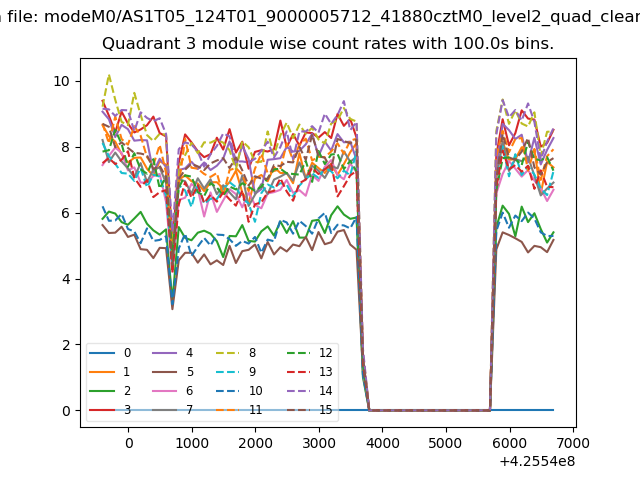
| Module-wise count rates for Quadrant A Data is divided into 100 sec bins |
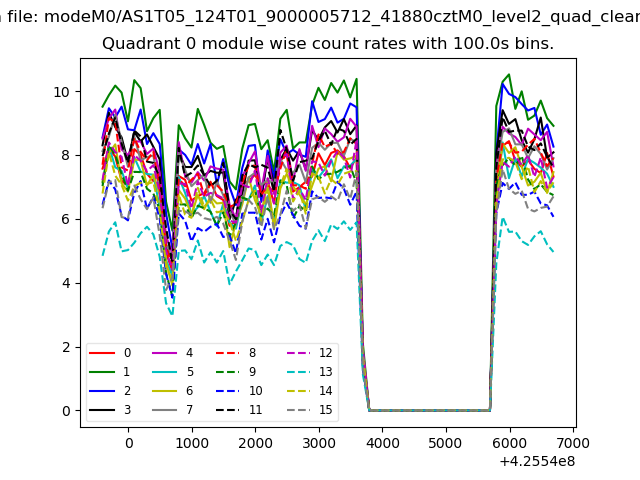 |
 |
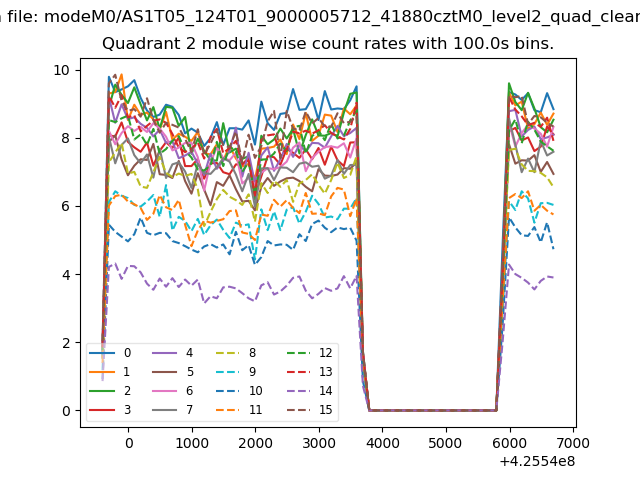
| Module-wise count rates for Quadrant B Data is divided into 100 sec bins |
 |
 |
| Module-wise count rates for Quadrant C Data is divided into 100 sec bins |
 |
 |
| Module-wise count rates for Quadrant D Data is divided into 100 sec bins |
 |
 |
| Parameter | Plot |
|---|---|
| CZT HV Monitor | 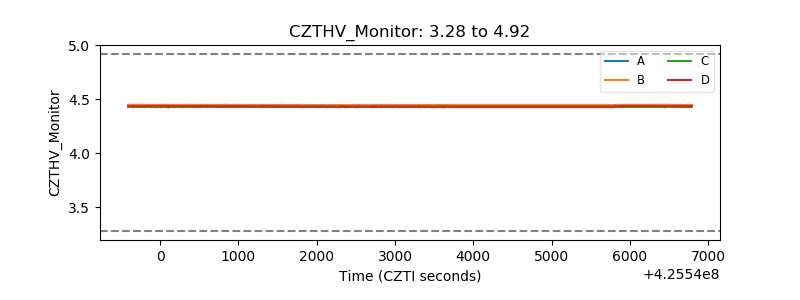 |
| D_VDD | 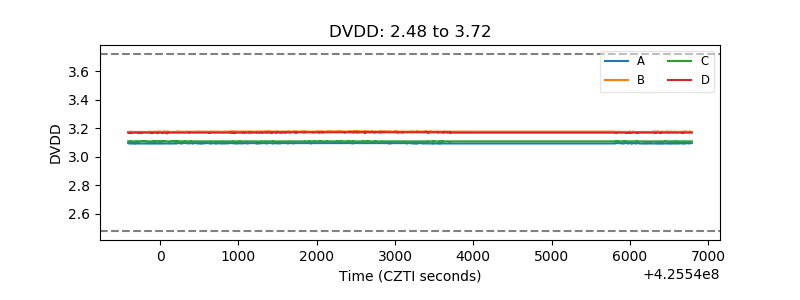 |
| Temperature 1 | 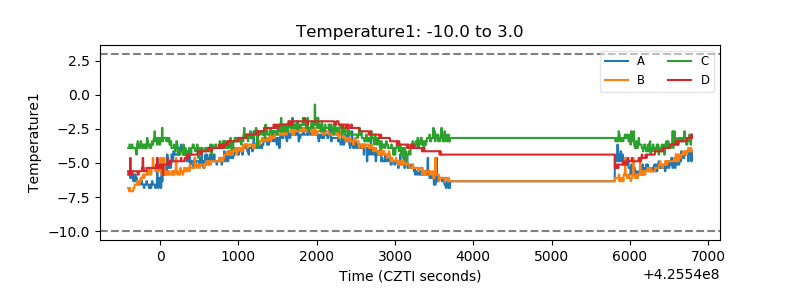 |
| Veto HV Monitor | 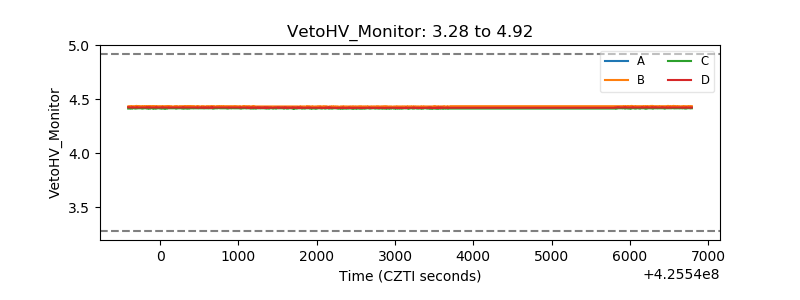 |
| Veto LLD | 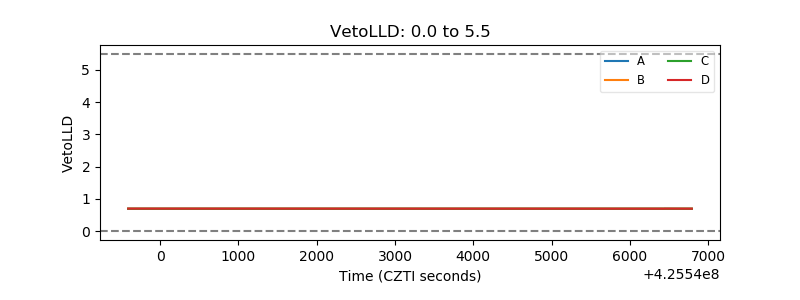 |
| Alpha Counter | 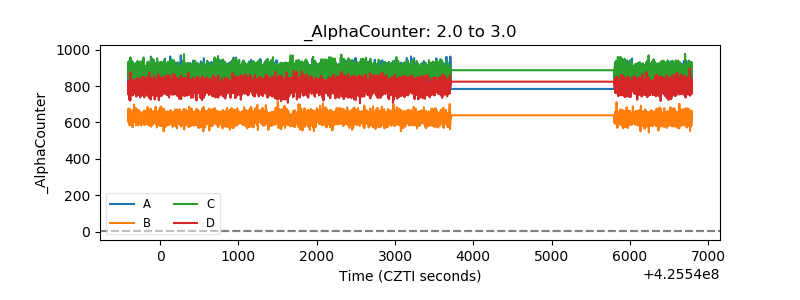 |
| _CPM_Rate | 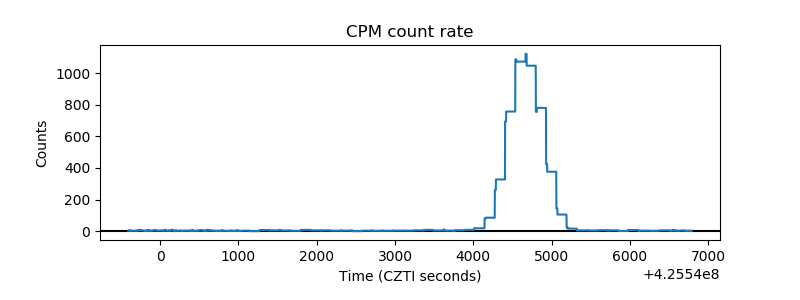 |
| CZT Counter | 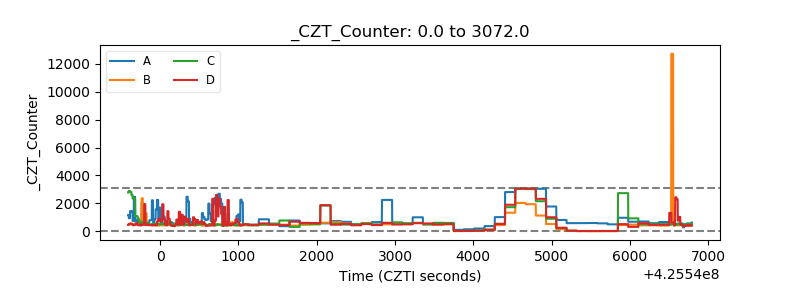 |
| +2.5 Volts monitor |  |
| +5 Volts monitor | 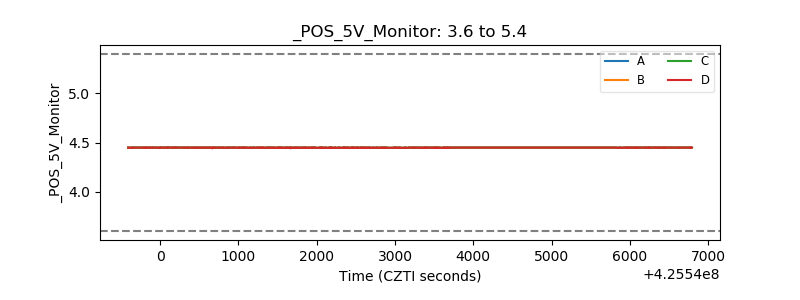 |
| _ROLL_ROT | 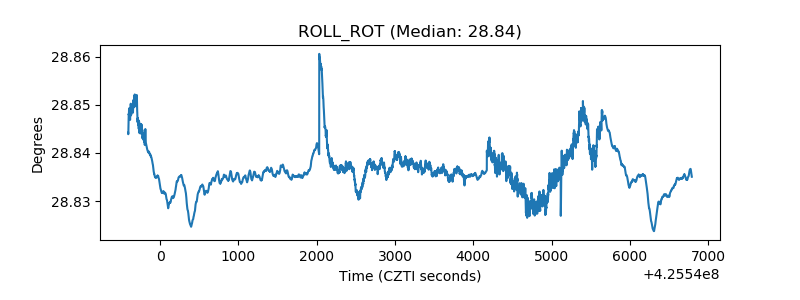 |
| _Roll_DEC | 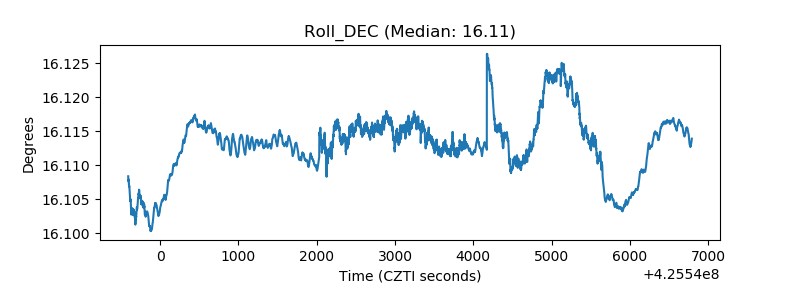 |
| _Roll_RA | 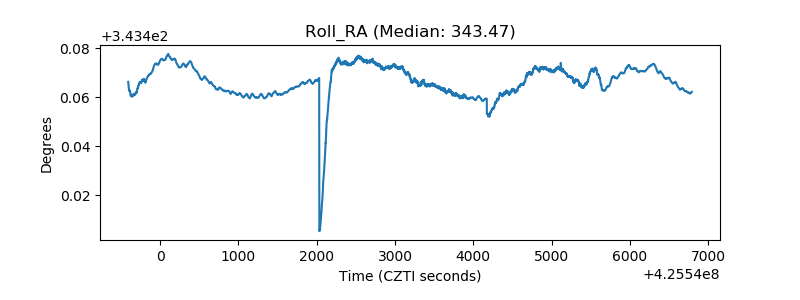 |
| Veto Counter | 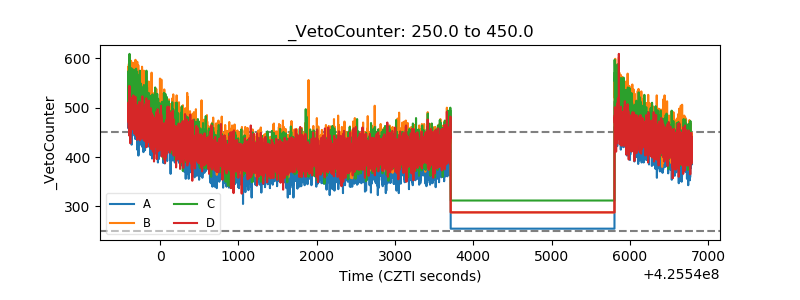 |