| Param | Original file | Final file |
|---|---|---|
| Filename | modeM0/AS1T05_124T01_9000005712_41881cztM0_level2.fits | modeM0/AS1T05_124T01_9000005712_41881cztM0_level2_quad_clean.evt |
| Size (bytes) | 1,197,910,080 | 299,499,840 |
| Size | 1.1 GB | 285.6 MB |
| Events in quadrant A | 14,166,626 | 2,020,750 |
| Events in quadrant B | 8,280,374 | 2,134,377 |
| Events in quadrant C | 9,925,935 | 1,905,981 |
| Events in quadrant D | 10,603,508 | 1,789,541 |
| Mode SS | |||
|---|---|---|---|
| Quadrant | BADHDUFLAG | Total packets | Discarded packets |
| A | 0 | 366 | 0 |
| B | 0 | 366 | 4 |
| C | 0 | 367 | 1 |
| D | 0 | 366 | 0 |
| Mode M9 | |||
|---|---|---|---|
| Quadrant | BADHDUFLAG | Total packets | Discarded packets |
| A | 0 | 80 | 1 |
| B | 0 | 79 | 0 |
| C | 0 | 79 | 0 |
| D | 0 | 80 | 1 |
| Mode M0 | |||
|---|---|---|---|
| Quadrant | BADHDUFLAG | Total packets | Discarded packets |
| A | 0 | 53591 | 217 |
| B | 0 | 36286 | 115 |
| C | 0 | 40459 | 483 |
| D | 0 | 43911 | 234 |
| Quadrant | Total seconds | Saturated seconds | Saturation percentage |
|---|---|---|---|
| A | 17661 | 727 | 4.116415% |
| B | 17681 | 18 | 0.101804% |
| C | 17649 | 533 | 3.020001% |
| D | 17658 | 449 | 2.542757% |
Noise dominated data is calculated using 1-second bins in cleaned event files. If a bin has >2000 counts, and if more than 50% of those come from <1% of pixels, then it is considered to be noise-dominated and hence unusable.
| Quadrant | # 1 sec bins | Bins with >0 counts | Bins with >2000 counts | High rate bins dominated by noise | Noise dominated (total time) | Noise dominated (detector-on time) | Marked lightcurve |
|---|---|---|---|---|---|---|---|
| A | 25779 | 17717 | 362 | 362 | 1.40% | 2.04% | 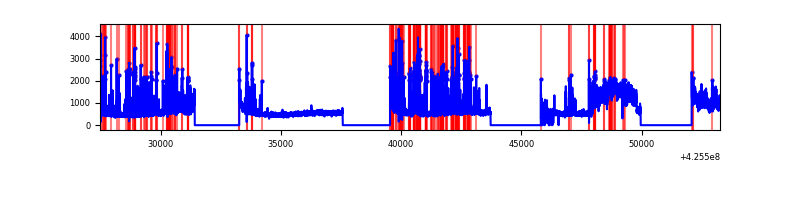 |
| B | 25779 | 17729 | 5 | 5 | 0.02% | 0.03% | 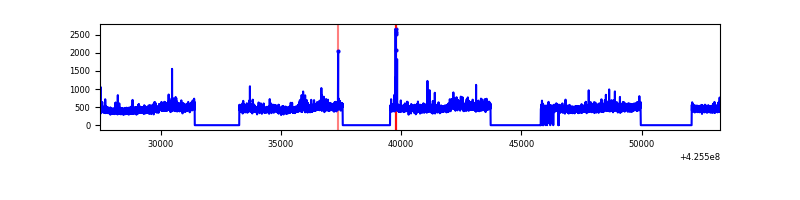 |
| C | 25779 | 17704 | 517 | 517 | 2.01% | 2.92% | 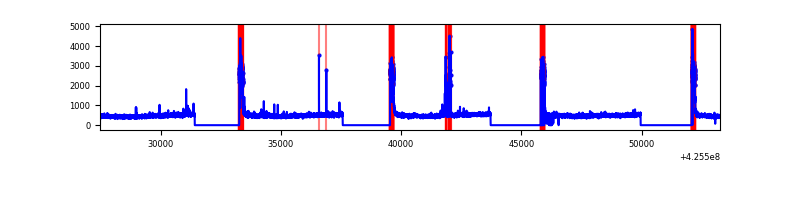 |
| D | 25779 | 17719 | 385 | 385 | 1.49% | 2.17% | 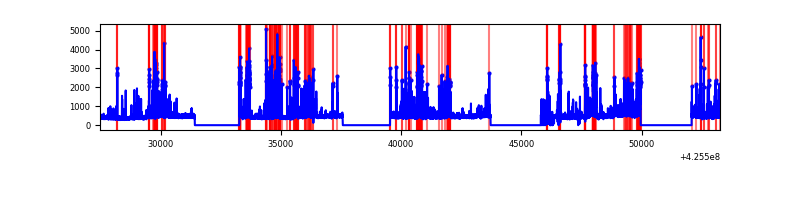 |
Top three noisy pixels from each quadrant. If the there are fewer than three noisy pixels in the level2.evt file, extra rows are filled as -1
| Pixel properties | Quadrant properties | ||||||
|---|---|---|---|---|---|---|---|
| Quadrant | DetID | PixID | Counts | Sigma | Mean | Median | Sigma |
| A | 14 | 24 | 4800417 | 11963.95 | 2006 | 1970 | 401.1 |
| A | 10 | 83 | 1491057 | 3712.73 | 2006 | 1970 | 401.1 |
| A | 7 | 3 | 86641 | 211.11 | 2006 | 1970 | 401.1 |
| B | 0 | 156 | 239327 | 623.91 | 2007 | 1955 | 380.5 |
| B | 0 | 245 | 67335 | 171.84 | 2007 | 1955 | 380.5 |
| B | 0 | 190 | 55069 | 139.6 | 2007 | 1955 | 380.5 |
| C | 0 | 10 | 1657515 | 3798.1 | 1896 | 1909 | 435.9 |
| C | 15 | 214 | 687424 | 1572.63 | 1896 | 1909 | 435.9 |
| C | 14 | 254 | 172229 | 390.73 | 1896 | 1909 | 435.9 |
| D | 13 | 249 | 1074695 | 2264.47 | 1941 | 1891 | 473.8 |
| D | 12 | 6 | 675710 | 1422.29 | 1941 | 1891 | 473.8 |
| D | 2 | 249 | 452823 | 951.82 | 1941 | 1891 | 473.8 |
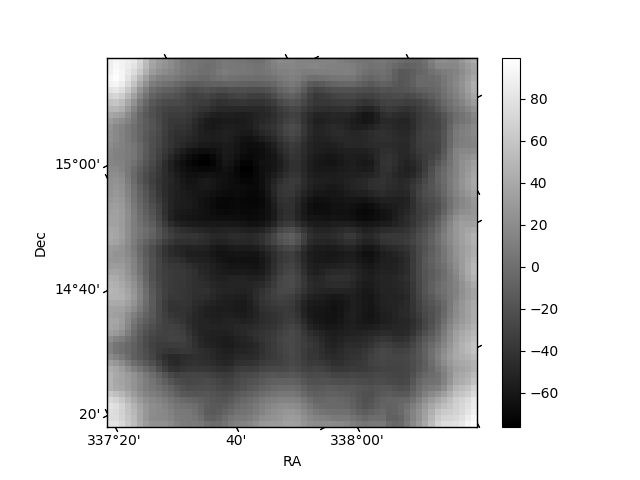
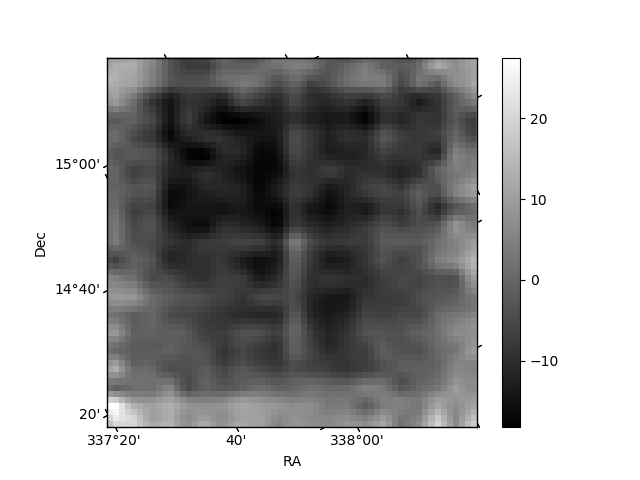
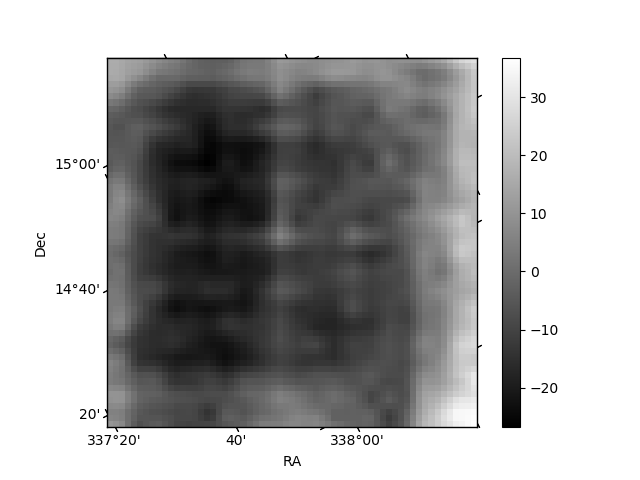
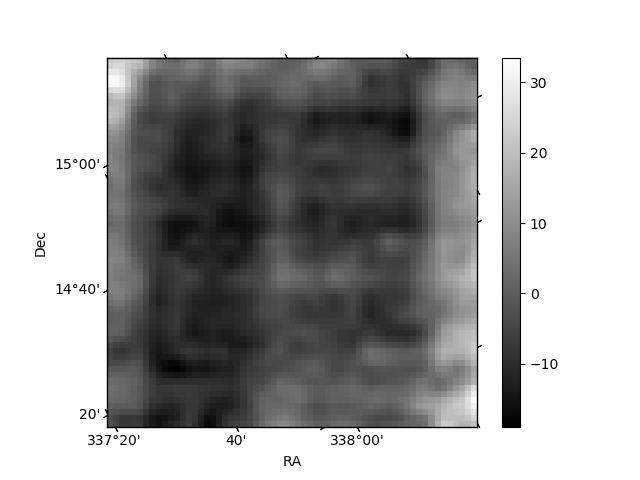
Histogram calculated using DETX and DETY for each event in the final _common_clean file
| Quadrant A | 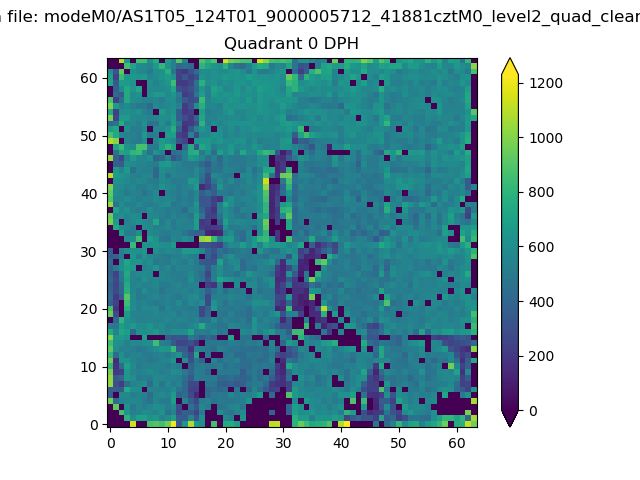 |
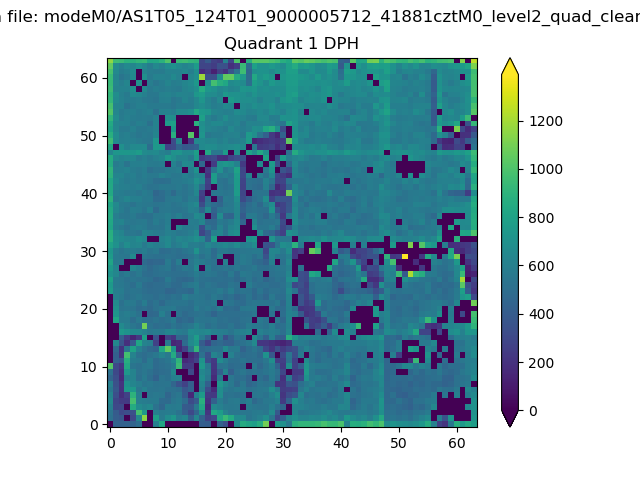 |
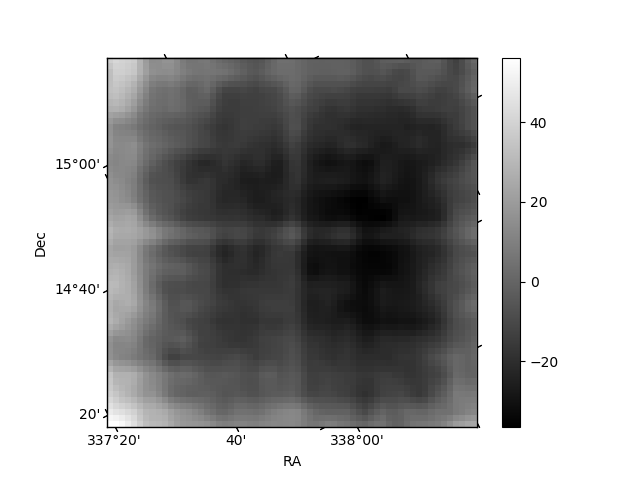
Quadrant B |
|---|---|---|---|
| Quadrant D | 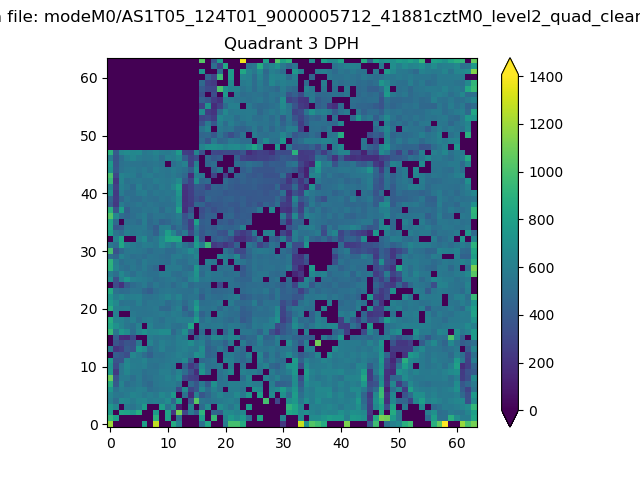 |
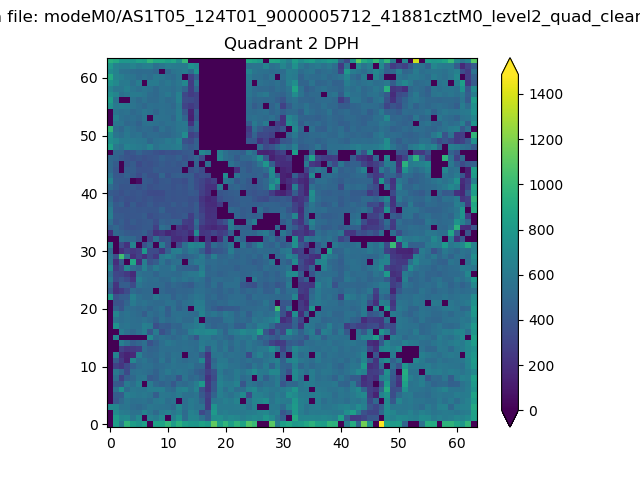 |
Quadrant C |
| Plot type | Count rate plots | Images |
|---|---|---|
| Comparison with Poisson distribution Blue bars denote a histogram of data divided into 1 sec bins. Red curve is a Poisson curve with rate = median count rate of data. |
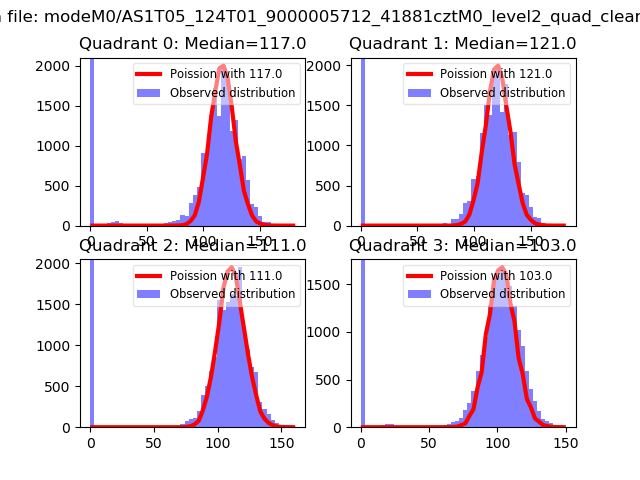 |
 |
| Quadrant-wise count rates Data is divided into 100 sec bins |
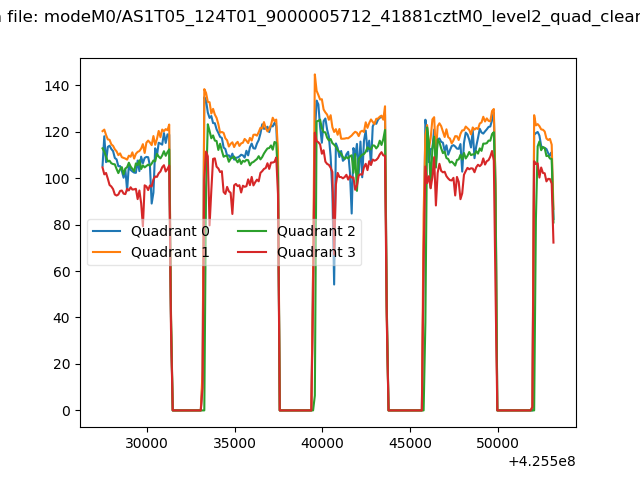 |
|
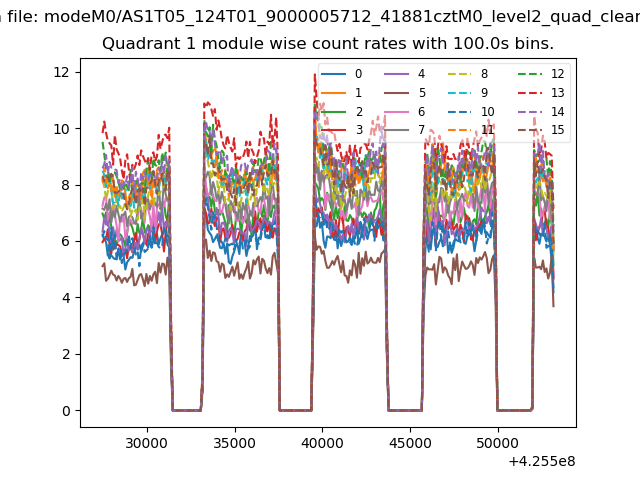
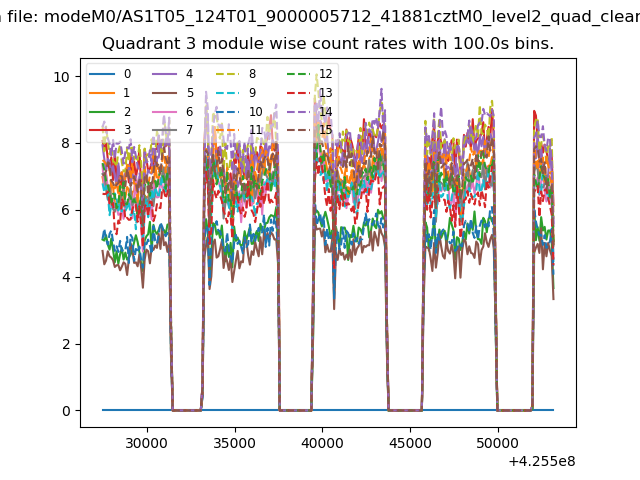
| Module-wise count rates for Quadrant A Data is divided into 100 sec bins |
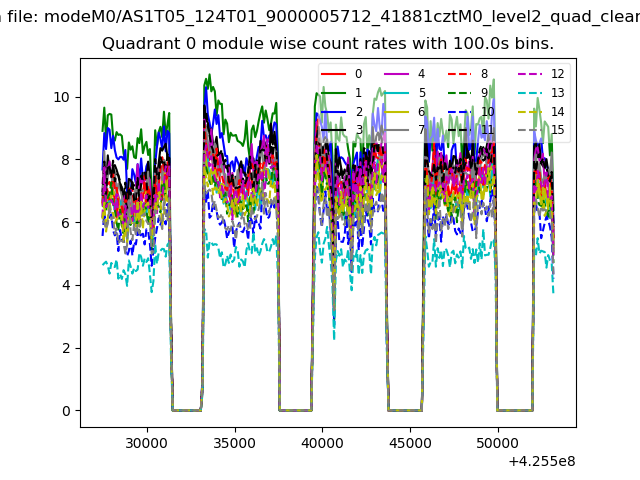 |
 |
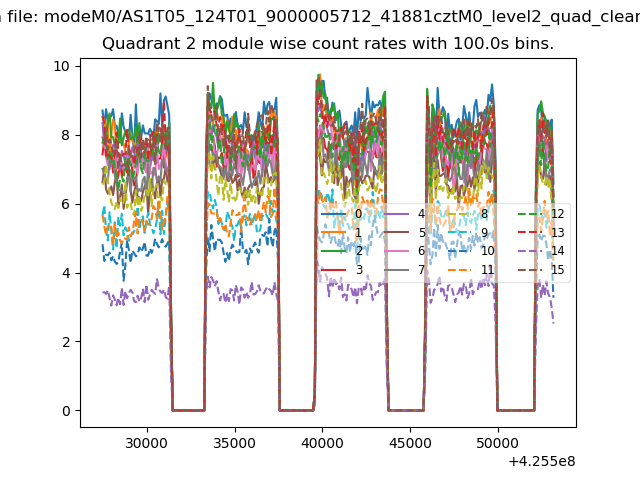
| Module-wise count rates for Quadrant B Data is divided into 100 sec bins |
 |
 |
| Module-wise count rates for Quadrant C Data is divided into 100 sec bins |
 |
 |
| Module-wise count rates for Quadrant D Data is divided into 100 sec bins |
 |
 |
| Parameter | Plot |
|---|---|
| CZT HV Monitor | 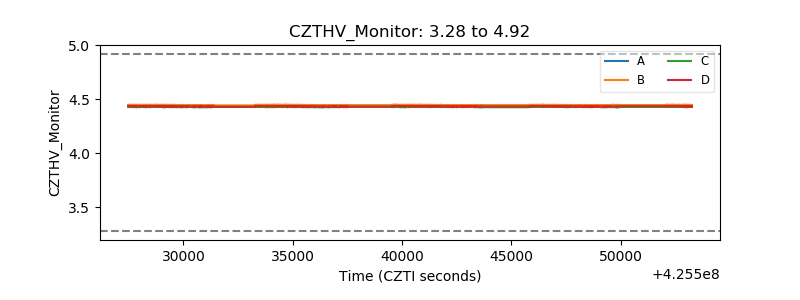 |
| D_VDD | 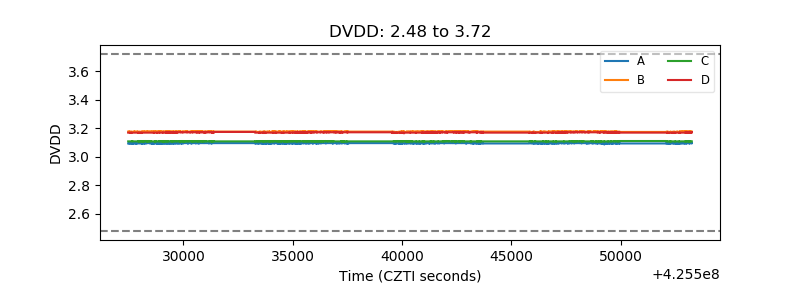 |
| Temperature 1 | 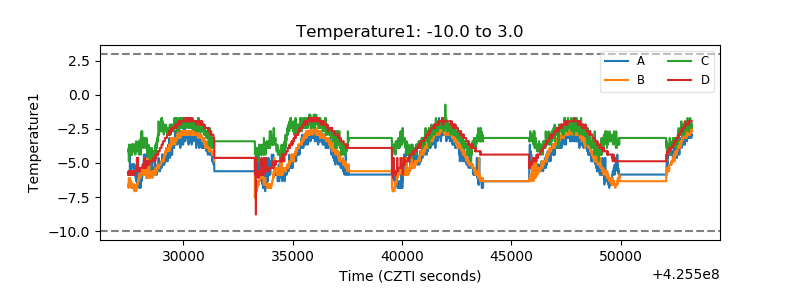 |
| Veto HV Monitor | 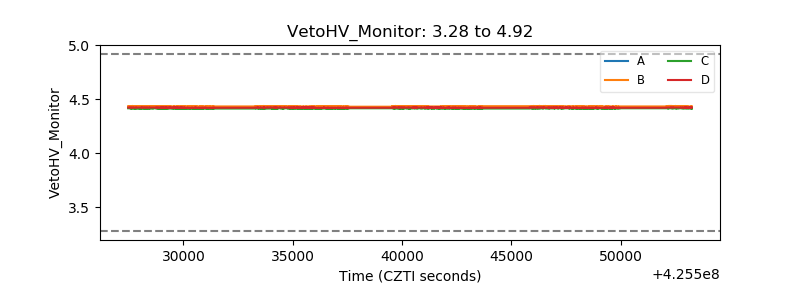 |
| Veto LLD | 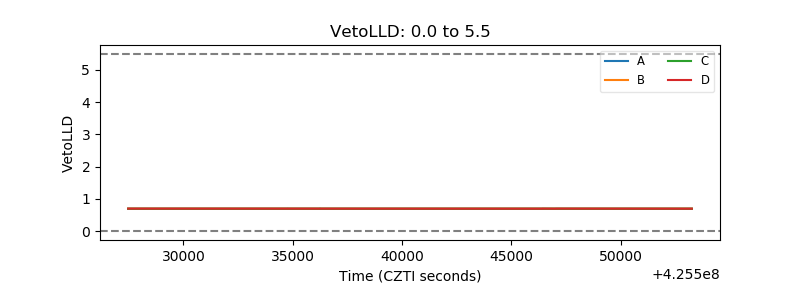 |
| Alpha Counter | 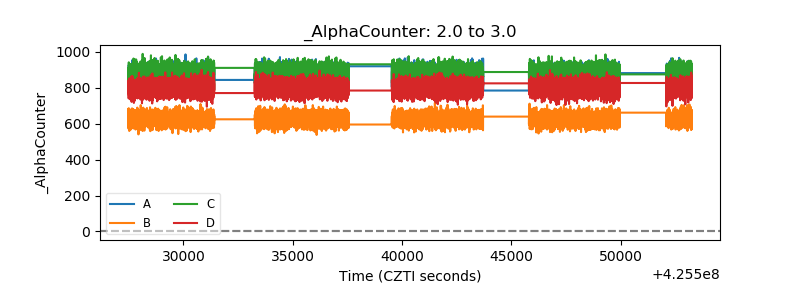 |
| _CPM_Rate | 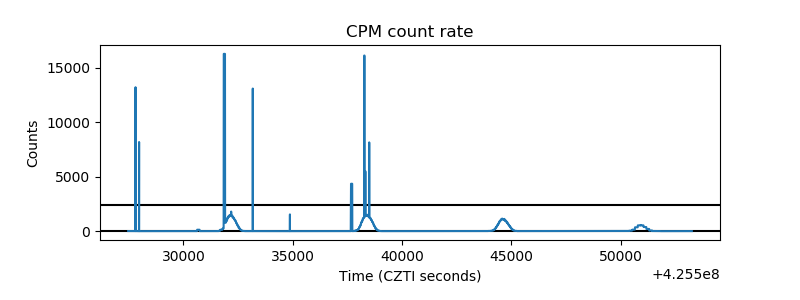 |
| CZT Counter | 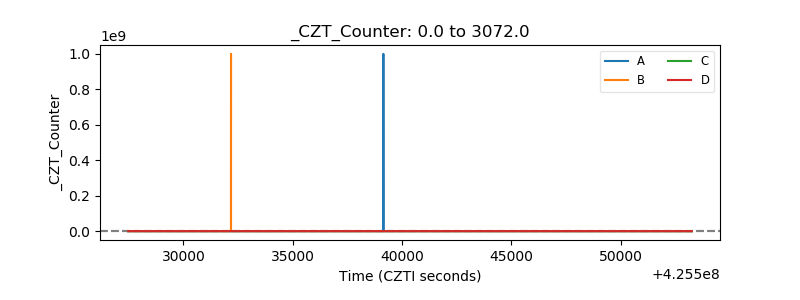 |
| +2.5 Volts monitor | 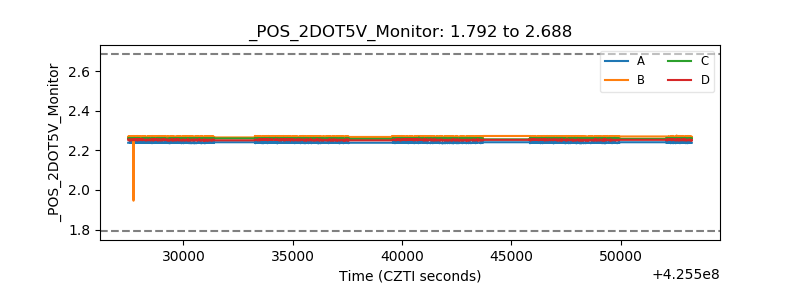 |
| +5 Volts monitor | 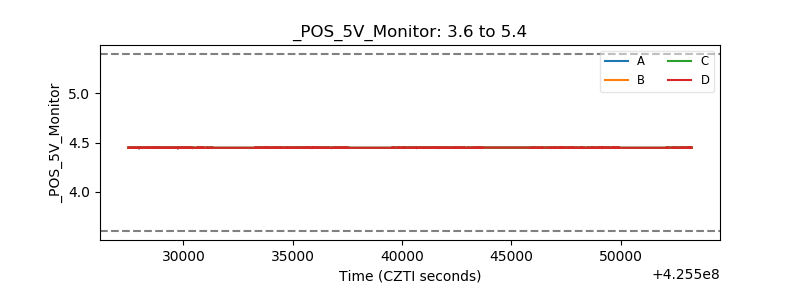 |
| _ROLL_ROT | 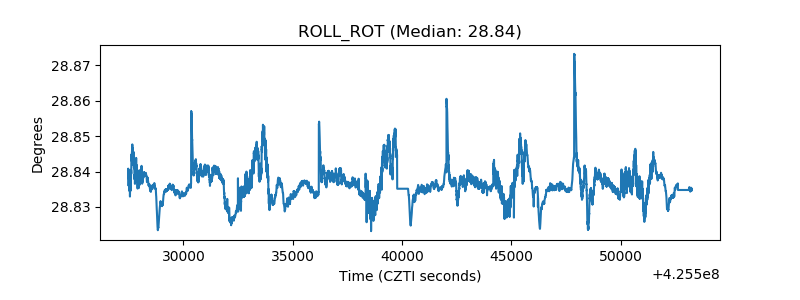 |
| _Roll_DEC | 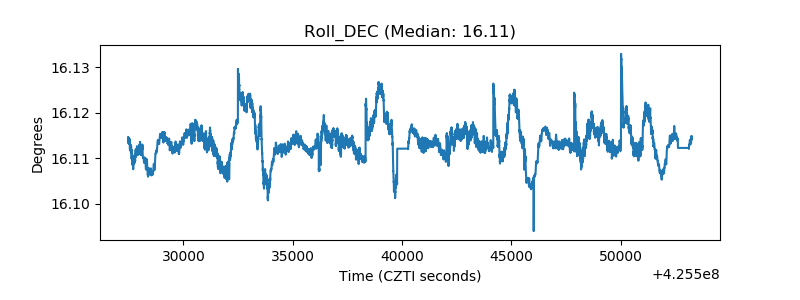 |
| _Roll_RA | 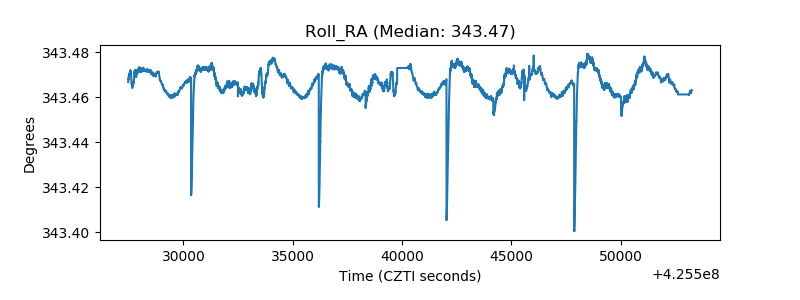 |
| Veto Counter | 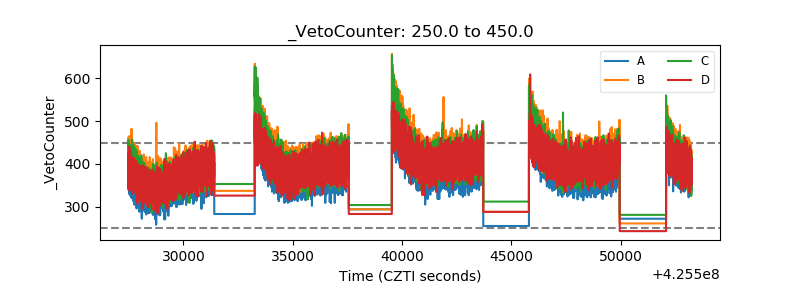 |