| Param | Original file | Final file |
|---|---|---|
| Filename | modeM0/AS1T05_124T01_9000005712_41882cztM0_level2.fits | modeM0/AS1T05_124T01_9000005712_41882cztM0_level2_quad_clean.evt |
| Size (bytes) | 421,908,480 | 81,313,920 |
| Size | 402.4 MB | 77.5 MB |
| Events in quadrant A | 5,080,271 | 509,789 |
| Events in quadrant B | 2,340,521 | 597,749 |
| Events in quadrant C | 3,110,937 | 525,203 |
| Events in quadrant D | 4,692,466 | 474,807 |
| Mode SS | |||
|---|---|---|---|
| Quadrant | BADHDUFLAG | Total packets | Discarded packets |
| A | 0 | 104 | 0 |
| B | 0 | 104 | 0 |
| C | 0 | 104 | 0 |
| D | 0 | 104 | 0 |
| Mode M9 | |||
|---|---|---|---|
| Quadrant | BADHDUFLAG | Total packets | Discarded packets |
| A | 0 | 27 | 0 |
| B | 0 | 27 | 0 |
| C | 0 | 28 | 0 |
| D | 0 | 28 | 0 |
| Mode M0 | |||
|---|---|---|---|
| Quadrant | BADHDUFLAG | Total packets | Discarded packets |
| A | 0 | 18394 | 2 |
| B | 0 | 10298 | 2 |
| C | 0 | 12243 | 2 |
| D | 0 | 17350 | 2 |
| Quadrant | Total seconds | Saturated seconds | Saturation percentage |
|---|---|---|---|
| A | 5057 | 729 | 14.415661% |
| B | 5057 | 8 | 0.158197% |
| C | 5057 | 281 | 5.556654% |
| D | 5057 | 557 | 11.014435% |
Noise dominated data is calculated using 1-second bins in cleaned event files. If a bin has >2000 counts, and if more than 50% of those come from <1% of pixels, then it is considered to be noise-dominated and hence unusable.
| Quadrant | # 1 sec bins | Bins with >0 counts | Bins with >2000 counts | High rate bins dominated by noise | Noise dominated (total time) | Noise dominated (detector-on time) | Marked lightcurve |
|---|---|---|---|---|---|---|---|
| A | 7180 | 5058 | 627 | 627 | 8.73% | 12.40% | 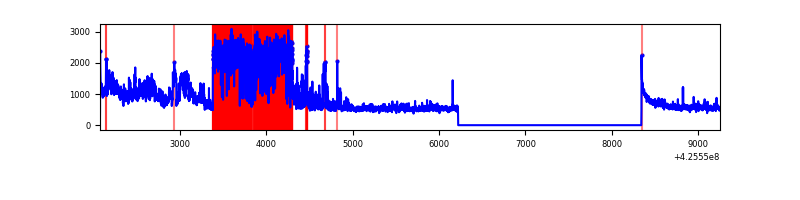 |
| B | 7180 | 5058 | 2 | 2 | 0.03% | 0.04% | 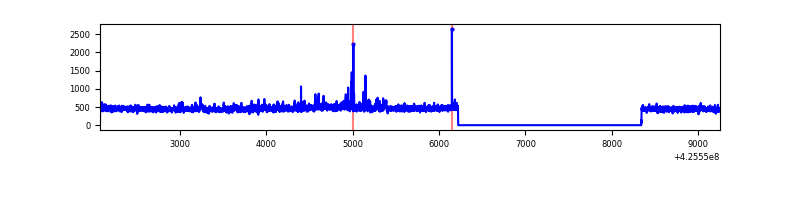 |
| C | 7180 | 5058 | 279 | 279 | 3.89% | 5.52% | 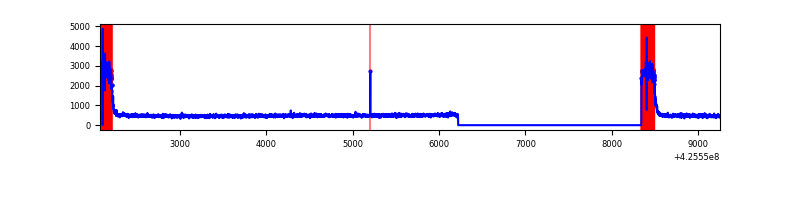 |
| D | 7180 | 5058 | 485 | 485 | 6.75% | 9.59% | 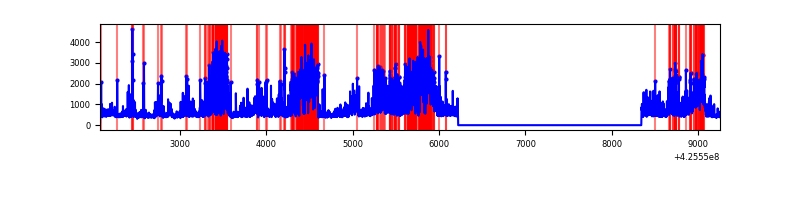 |
Top three noisy pixels from each quadrant. If the there are fewer than three noisy pixels in the level2.evt file, extra rows are filled as -1
| Pixel properties | Quadrant properties | ||||||
|---|---|---|---|---|---|---|---|
| Quadrant | DetID | PixID | Counts | Sigma | Mean | Median | Sigma |
| A | 14 | 24 | 2422197 | 21279.97 | 553 | 542 | 113.8 |
| A | 10 | 83 | 507074 | 4451.08 | 553 | 542 | 113.8 |
| A | 7 | 3 | 6974 | 56.52 | 553 | 542 | 113.8 |
| B | 0 | 156 | 54411 | 481.48 | 568 | 551 | 111.9 |
| B | 0 | 245 | 50691 | 448.22 | 568 | 551 | 111.9 |
| B | 12 | 111 | 13953 | 119.8 | 568 | 551 | 111.9 |
| C | 0 | 10 | 837685 | 6707.11 | 529 | 530 | 124.8 |
| C | 15 | 214 | 197788 | 1580.39 | 529 | 530 | 124.8 |
| C | 0 | 15 | 8031 | 60.1 | 529 | 530 | 124.8 |
| D | 12 | 79 | 1089993 | 8191.93 | 534 | 518 | 133.0 |
| D | 13 | 249 | 660197 | 4960.23 | 534 | 518 | 133.0 |
| D | 5 | 222 | 559336 | 4201.84 | 534 | 518 | 133.0 |
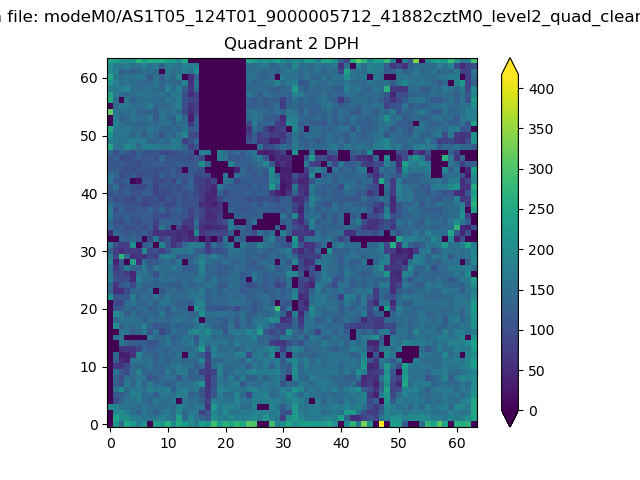
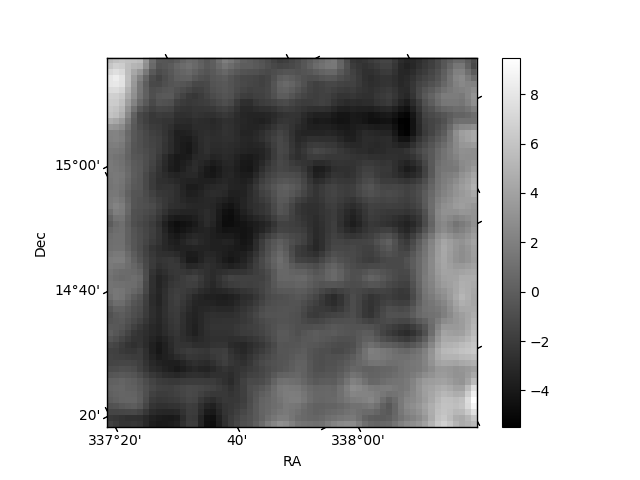
Histogram calculated using DETX and DETY for each event in the final _common_clean file
| Quadrant A | 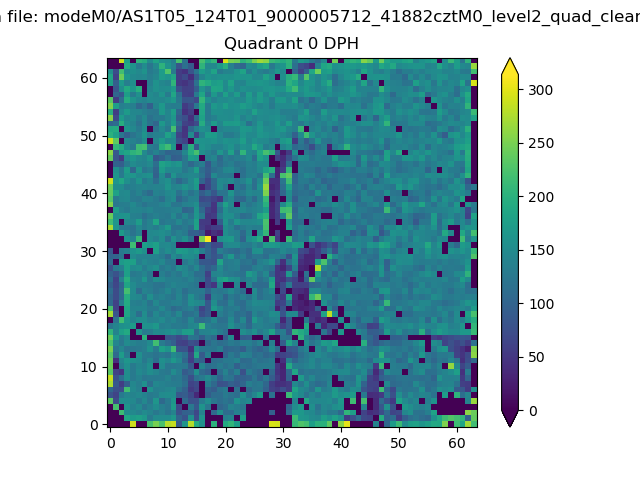 |
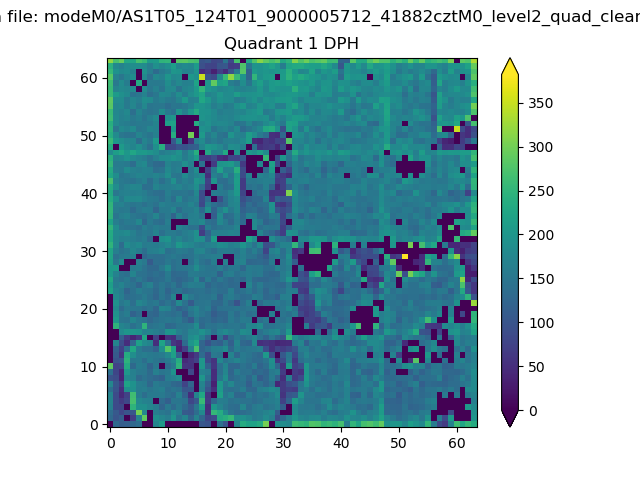 |
Quadrant B |
|---|---|---|---|
| Quadrant D | 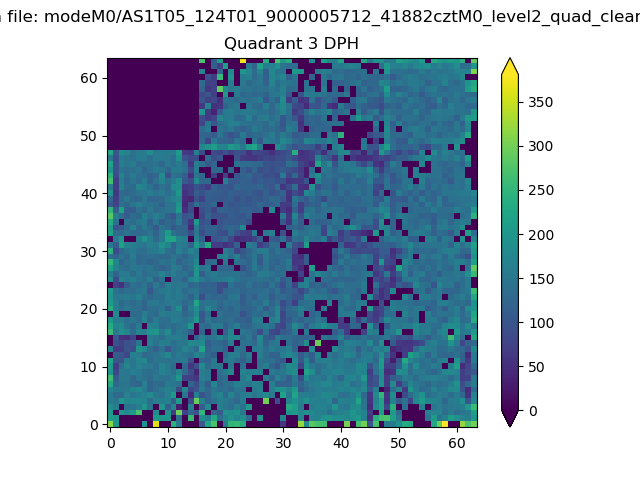 |
 |
Quadrant C |
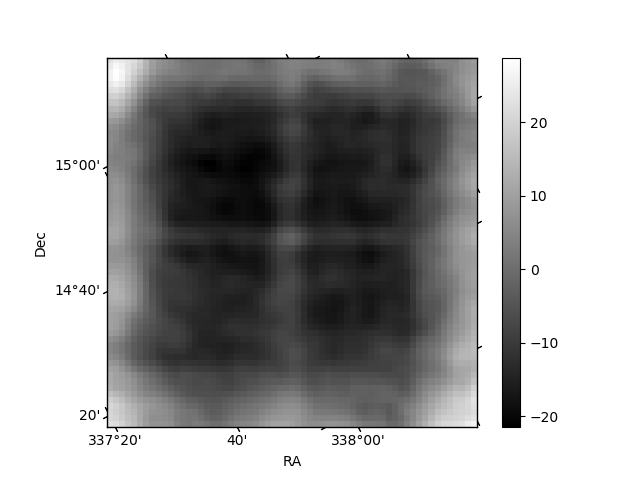
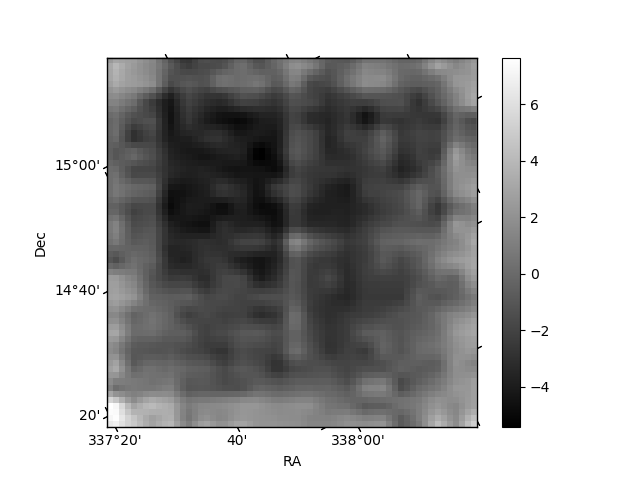
| Plot type | Count rate plots | Images |
|---|---|---|
| Comparison with Poisson distribution Blue bars denote a histogram of data divided into 1 sec bins. Red curve is a Poisson curve with rate = median count rate of data. |
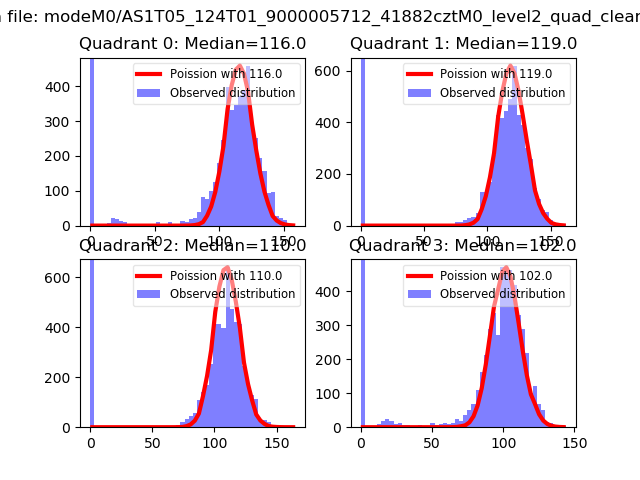 |
 |
| Quadrant-wise count rates Data is divided into 100 sec bins |
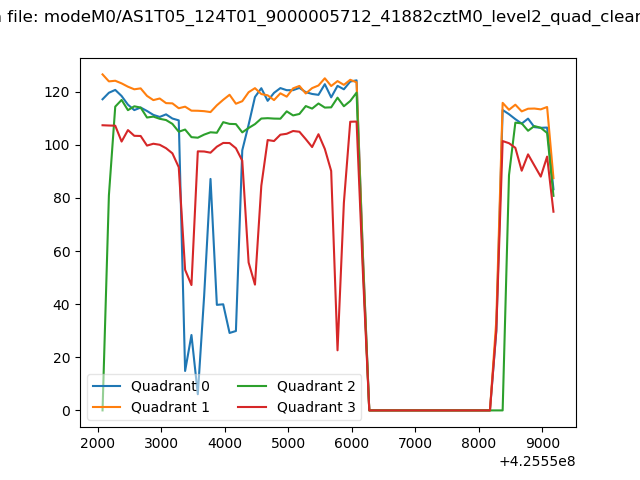 |
|
| Module-wise count rates for Quadrant A Data is divided into 100 sec bins |
 |
 |
| Module-wise count rates for Quadrant B Data is divided into 100 sec bins |
 |
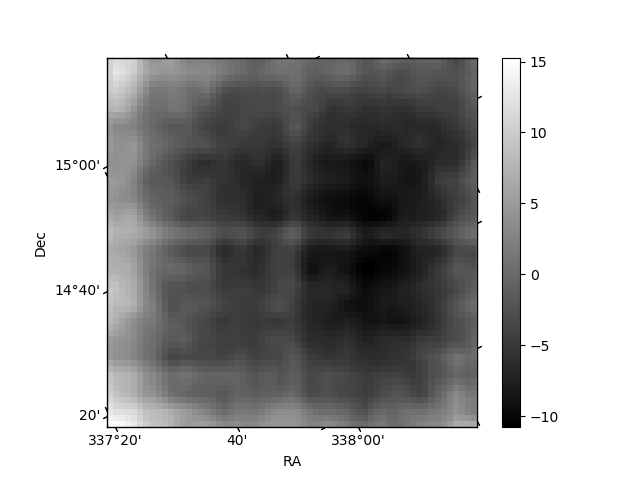 |
| Module-wise count rates for Quadrant C Data is divided into 100 sec bins |
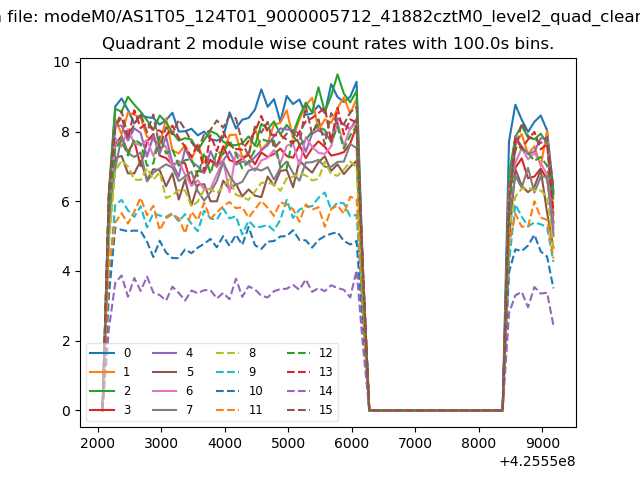 |
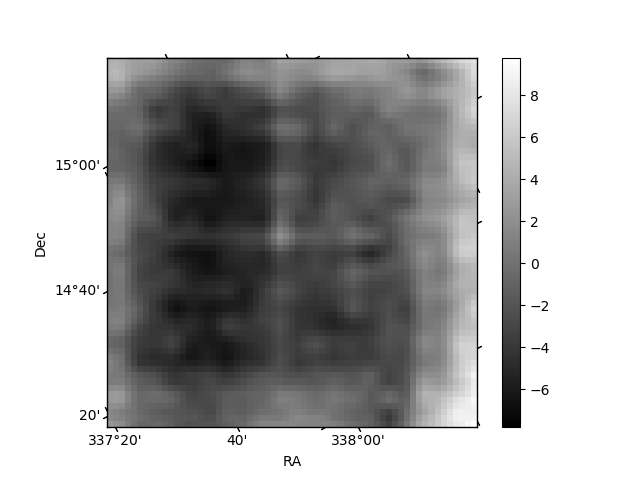 |
| Module-wise count rates for Quadrant D Data is divided into 100 sec bins |
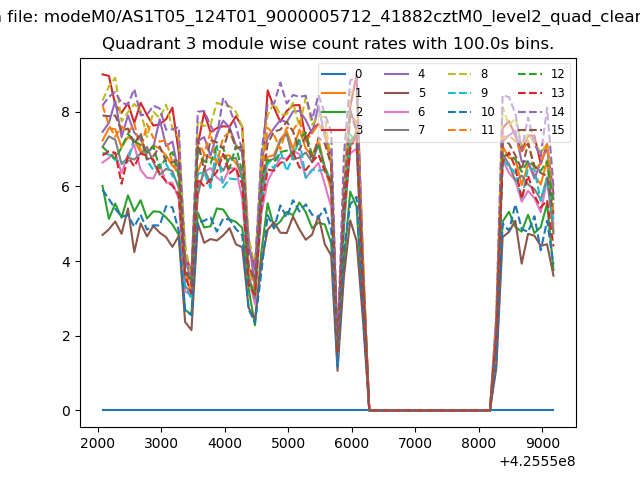 |
 |
| Parameter | Plot |
|---|---|
| CZT HV Monitor | 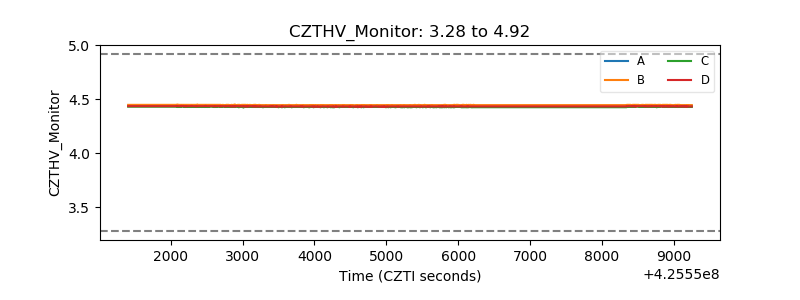 |
| D_VDD | 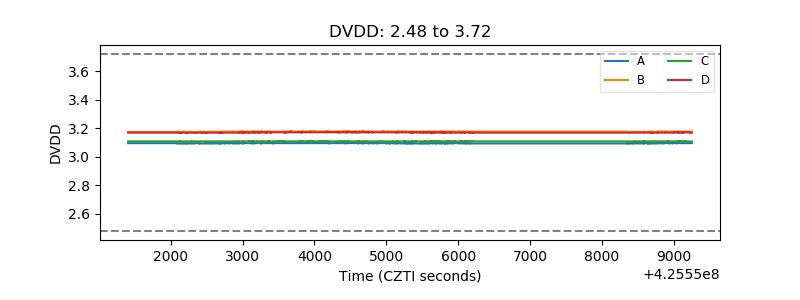 |
| Temperature 1 | 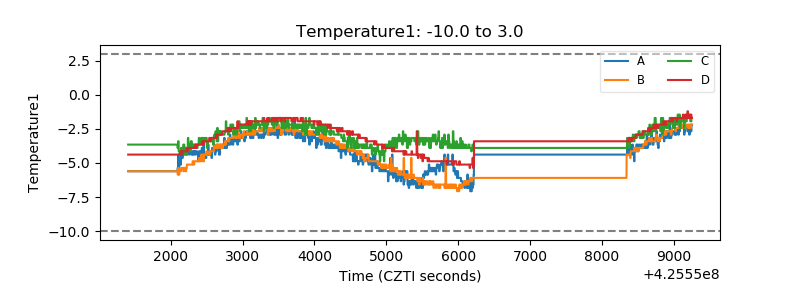 |
| Veto HV Monitor | 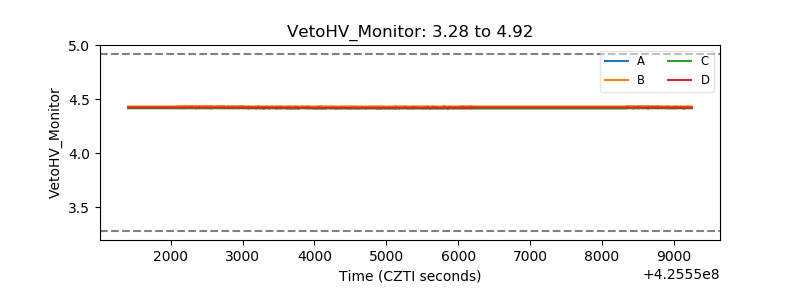 |
| Veto LLD | 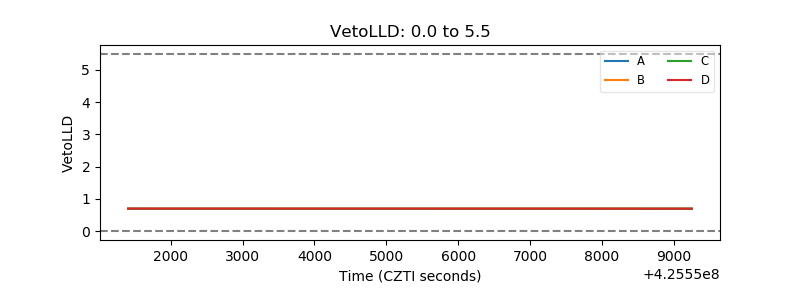 |
| Alpha Counter | 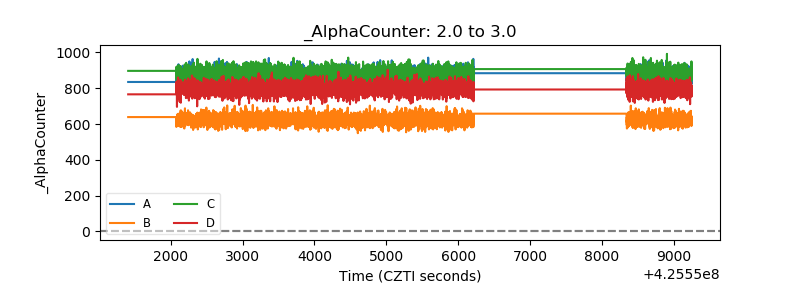 |
| _CPM_Rate | 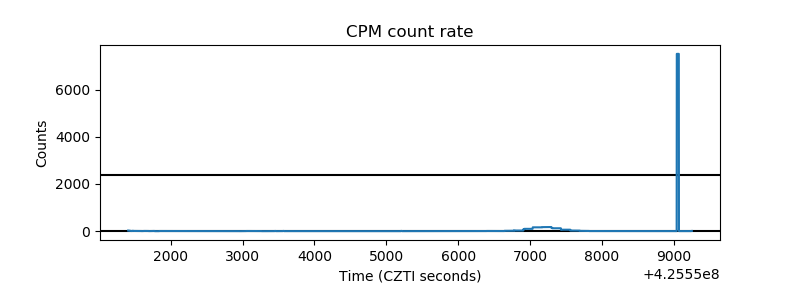 |
| CZT Counter | 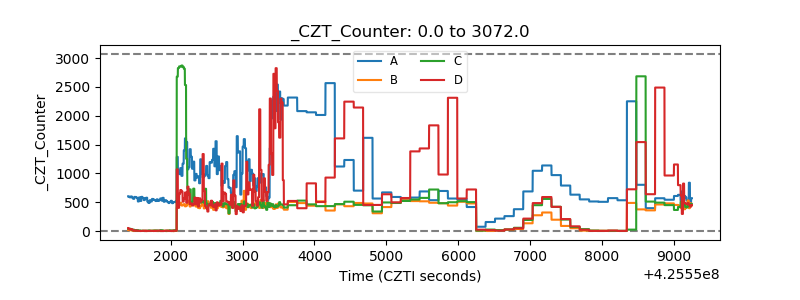 |
| +2.5 Volts monitor | 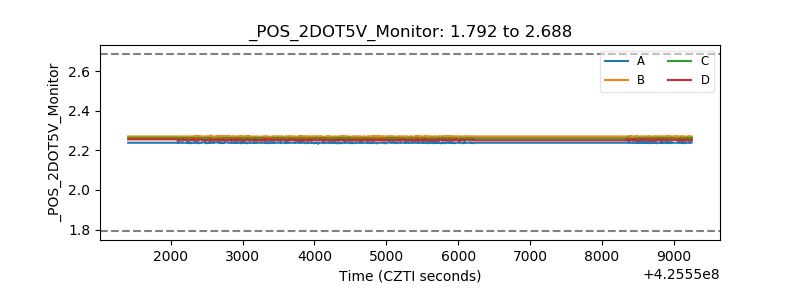 |
| +5 Volts monitor |  |
| _ROLL_ROT | 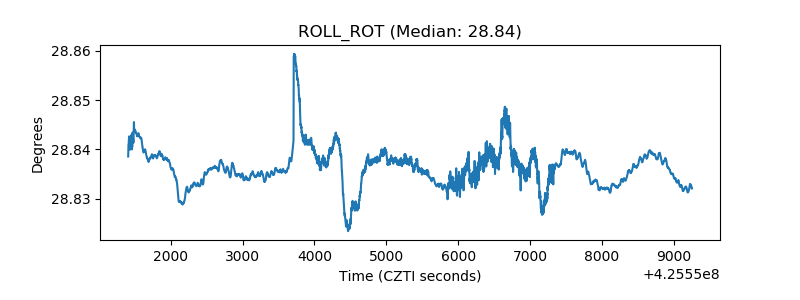 |
| _Roll_DEC | 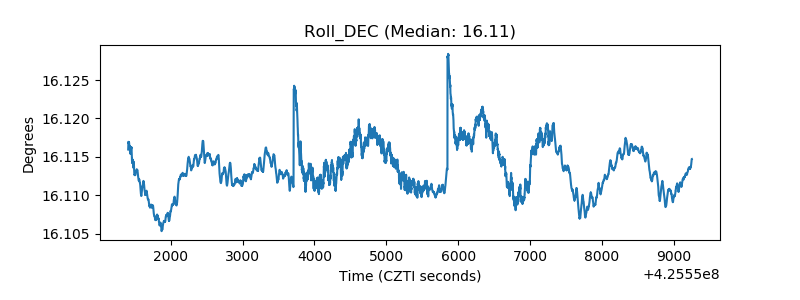 |
| _Roll_RA | 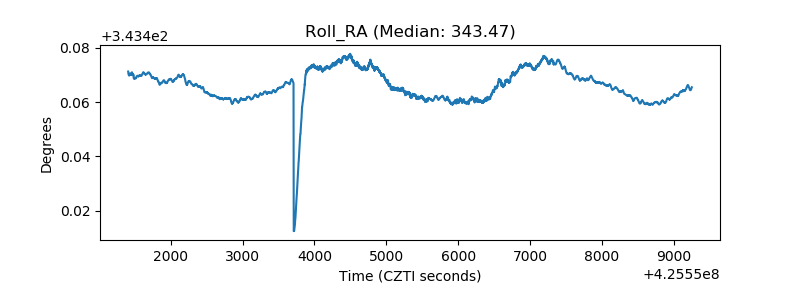 |
| Veto Counter | 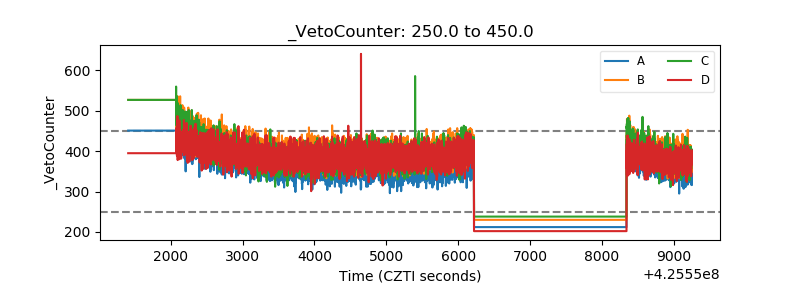 |