| Param | Original file | Final file |
|---|---|---|
| Filename | modeM0/AS1T05_124T01_9000005712_41883cztM0_level2.fits | modeM0/AS1T05_124T01_9000005712_41883cztM0_level2_quad_clean.evt |
| Size (bytes) | 400,161,600 | 84,340,800 |
| Size | 381.6 MB | 80.4 MB |
| Events in quadrant A | 3,124,170 | 580,044 |
| Events in quadrant B | 2,415,452 | 598,922 |
| Events in quadrant C | 3,199,603 | 527,765 |
| Events in quadrant D | 5,665,463 | 480,346 |
| Mode SS | |||
|---|---|---|---|
| Quadrant | BADHDUFLAG | Total packets | Discarded packets |
| A | 0 | 104 | 0 |
| B | 0 | 104 | 0 |
| C | 0 | 104 | 0 |
| D | 0 | 104 | 0 |
| Mode M9 | |||
|---|---|---|---|
| Quadrant | BADHDUFLAG | Total packets | Discarded packets |
| A | 0 | 30 | 0 |
| B | 0 | 30 | 0 |
| C | 0 | 31 | 0 |
| D | 0 | 31 | 0 |
| Mode M0 | |||
|---|---|---|---|
| Quadrant | BADHDUFLAG | Total packets | Discarded packets |
| A | 0 | 12494 | 2 |
| B | 0 | 10686 | 2 |
| C | 0 | 12694 | 2 |
| D | 0 | 20431 | 2 |
| Quadrant | Total seconds | Saturated seconds | Saturation percentage |
|---|---|---|---|
| A | 5246 | 97 | 1.849028% |
| B | 5246 | 3 | 0.057186% |
| C | 5246 | 293 | 5.585208% |
| D | 5246 | 625 | 11.913839% |
Noise dominated data is calculated using 1-second bins in cleaned event files. If a bin has >2000 counts, and if more than 50% of those come from <1% of pixels, then it is considered to be noise-dominated and hence unusable.
| Quadrant | # 1 sec bins | Bins with >0 counts | Bins with >2000 counts | High rate bins dominated by noise | Noise dominated (total time) | Noise dominated (detector-on time) | Marked lightcurve |
|---|---|---|---|---|---|---|---|
| A | 7159 | 5247 | 21 | 21 | 0.29% | 0.40% | 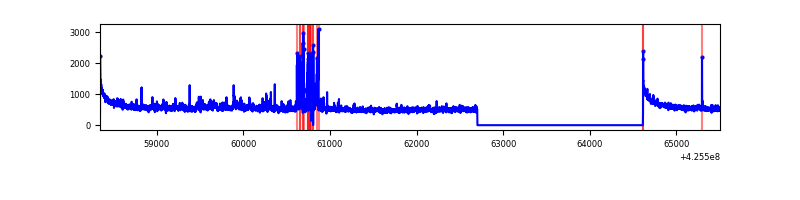 |
| B | 7159 | 5247 | 0 | 0 | 0.00% | 0.00% | 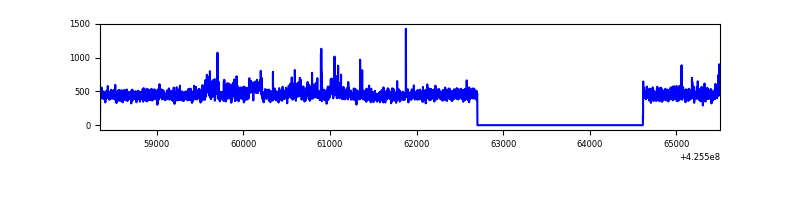 |
| C | 7159 | 5247 | 290 | 290 | 4.05% | 5.53% | 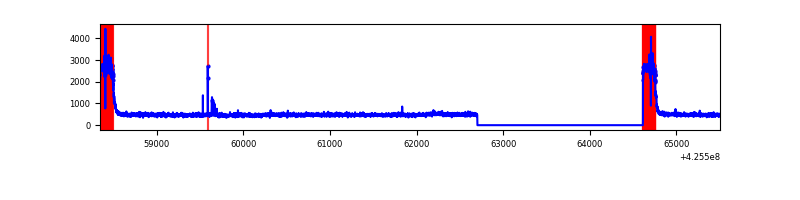 |
| D | 7159 | 5247 | 627 | 627 | 8.76% | 11.95% | 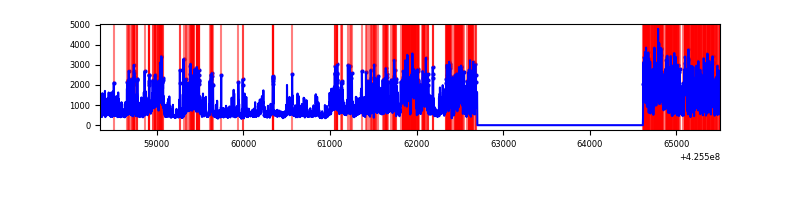 |
Top three noisy pixels from each quadrant. If the there are fewer than three noisy pixels in the level2.evt file, extra rows are filled as -1
| Pixel properties | Quadrant properties | ||||||
|---|---|---|---|---|---|---|---|
| Quadrant | DetID | PixID | Counts | Sigma | Mean | Median | Sigma |
| A | 10 | 83 | 535291 | 4442.33 | 582 | 570 | 120.4 |
| A | 14 | 24 | 319684 | 2651.12 | 582 | 570 | 120.4 |
| A | 13 | 254 | 7016 | 53.55 | 582 | 570 | 120.4 |
| B | 0 | 156 | 81927 | 720.1 | 579 | 563 | 113.0 |
| B | 0 | 245 | 37293 | 325.07 | 579 | 563 | 113.0 |
| B | 12 | 111 | 14542 | 123.72 | 579 | 563 | 113.0 |
| C | 0 | 10 | 855870 | 6707.77 | 541 | 543 | 127.5 |
| C | 15 | 214 | 203897 | 1594.77 | 541 | 543 | 127.5 |
| C | 0 | 15 | 28638 | 220.33 | 541 | 543 | 127.5 |
| D | 12 | 79 | 2829428 | 20966.03 | 546 | 531 | 134.9 |
| D | 13 | 249 | 352022 | 2605.03 | 546 | 531 | 134.9 |
| D | 12 | 6 | 142950 | 1055.52 | 546 | 531 | 134.9 |
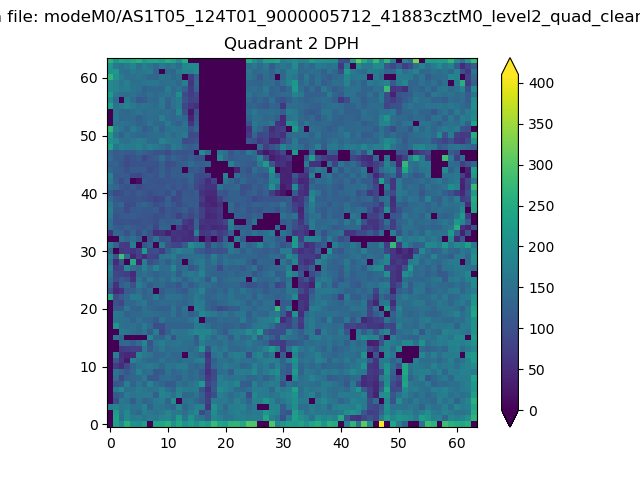
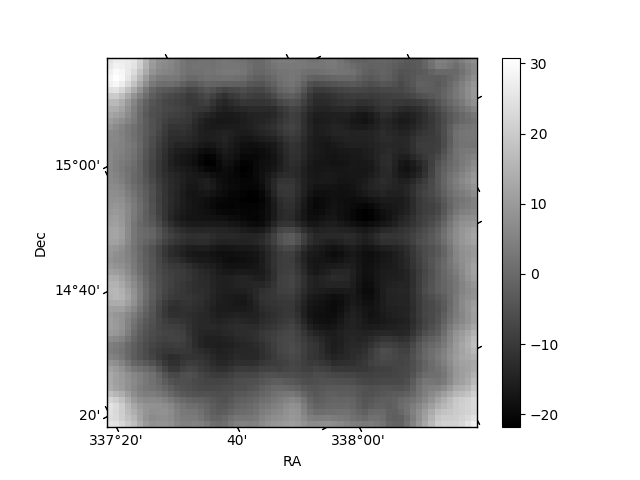
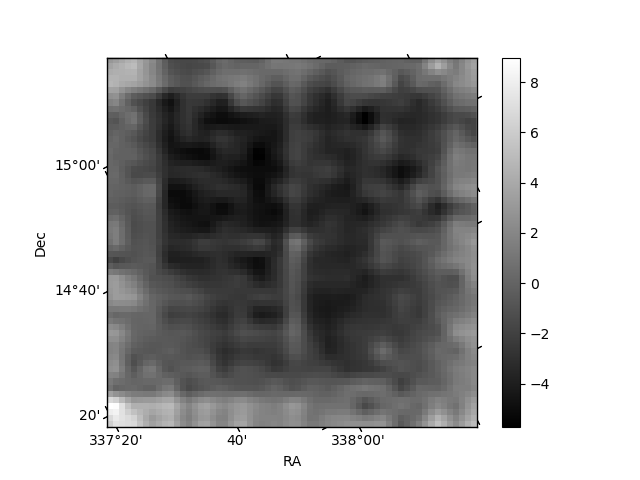
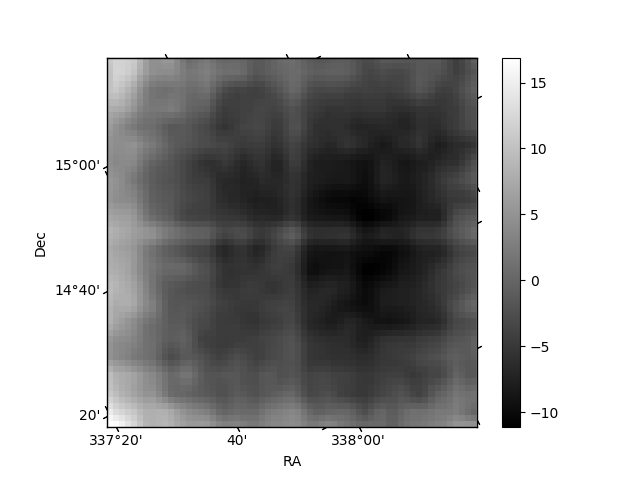
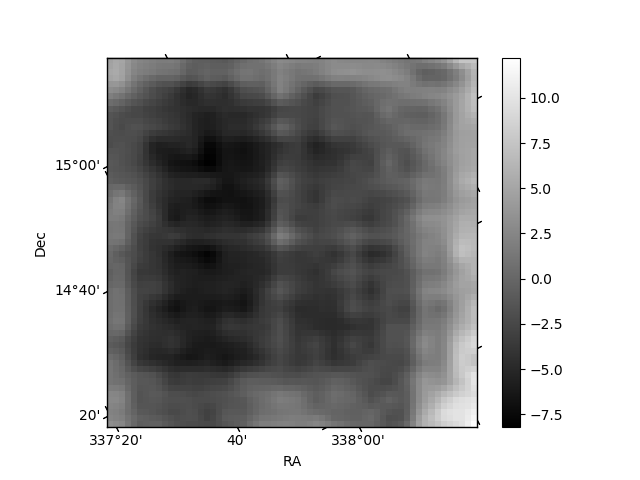
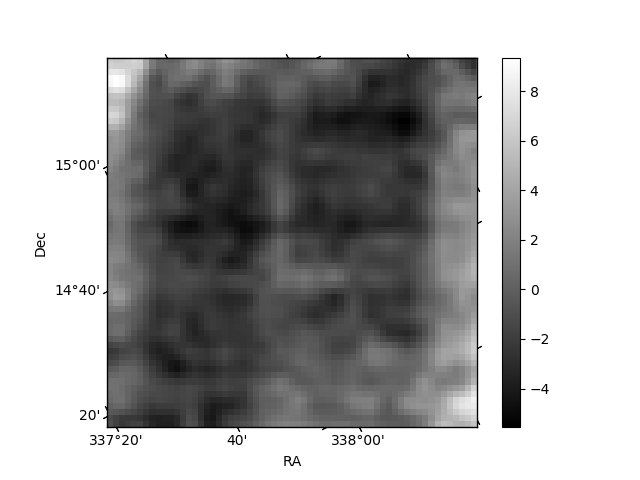
Histogram calculated using DETX and DETY for each event in the final _common_clean file
| Quadrant A | 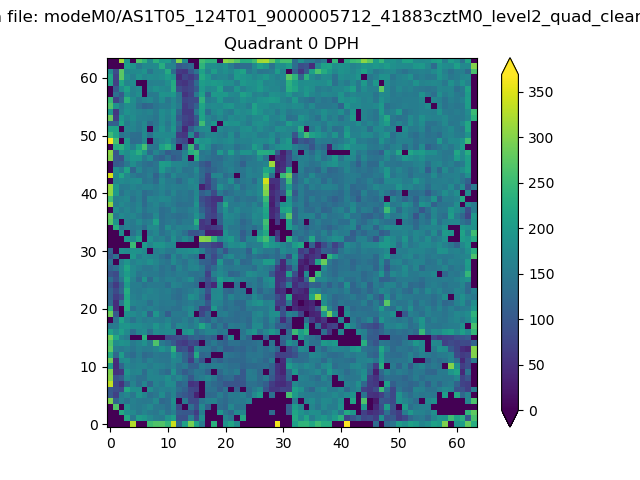 |
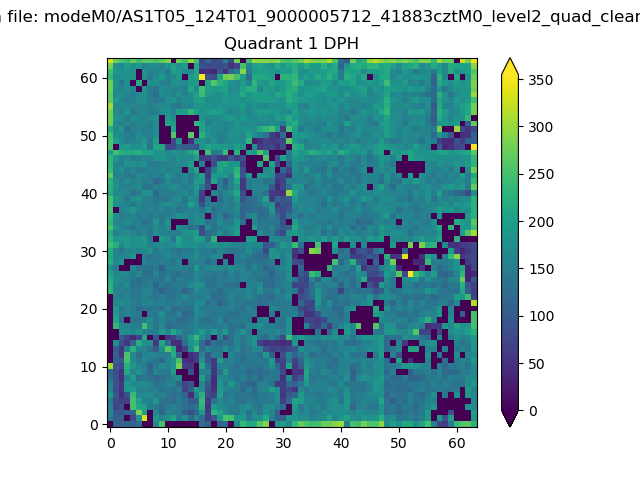 |
Quadrant B |
|---|---|---|---|
| Quadrant D | 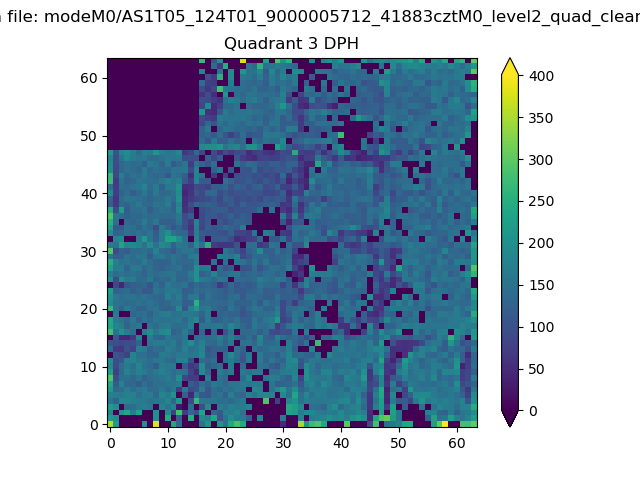 |
 |
Quadrant C |
| Plot type | Count rate plots | Images |
|---|---|---|
| Comparison with Poisson distribution Blue bars denote a histogram of data divided into 1 sec bins. Red curve is a Poisson curve with rate = median count rate of data. |
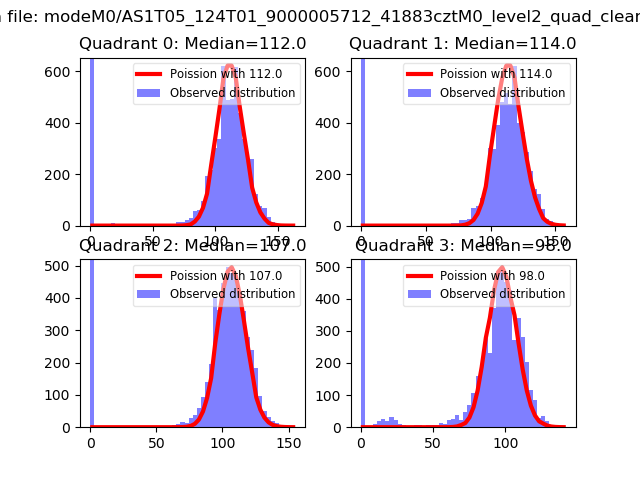 |
 |
| Quadrant-wise count rates Data is divided into 100 sec bins |
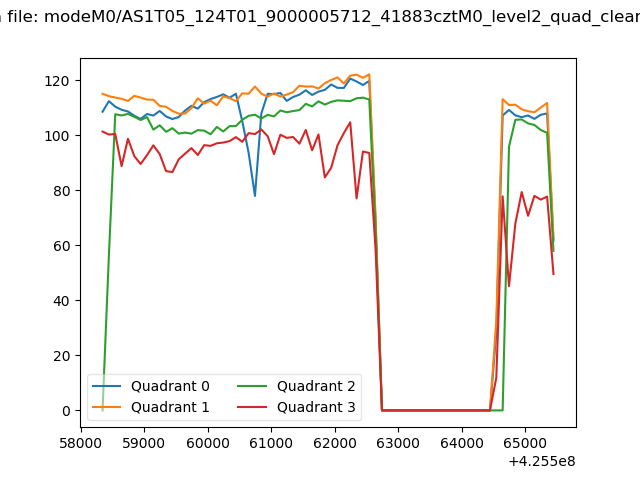 |
|
| Module-wise count rates for Quadrant A Data is divided into 100 sec bins |
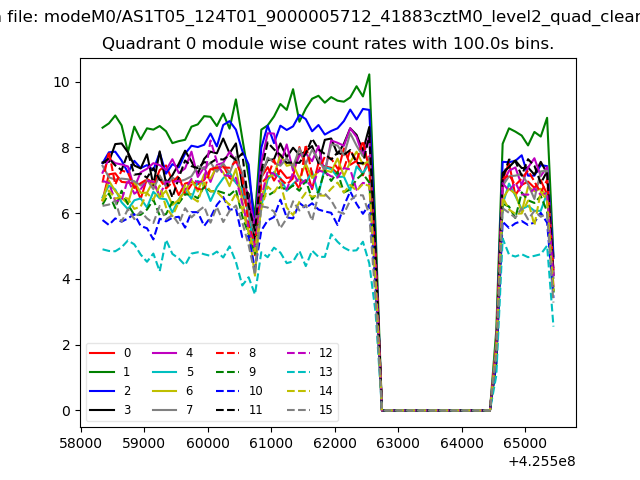 |
 |
| Module-wise count rates for Quadrant B Data is divided into 100 sec bins |
 |
 |
| Module-wise count rates for Quadrant C Data is divided into 100 sec bins |
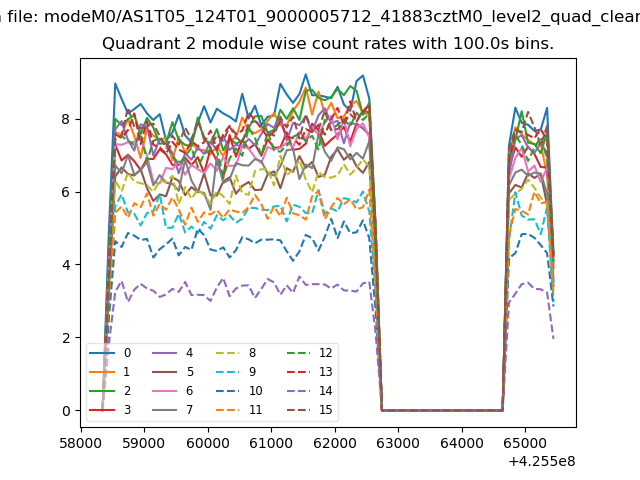 |
 |
| Module-wise count rates for Quadrant D Data is divided into 100 sec bins |
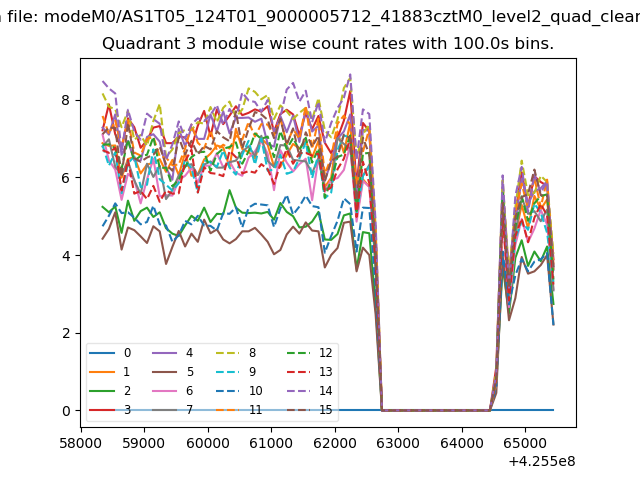 |
 |
| Parameter | Plot |
|---|---|
| CZT HV Monitor | 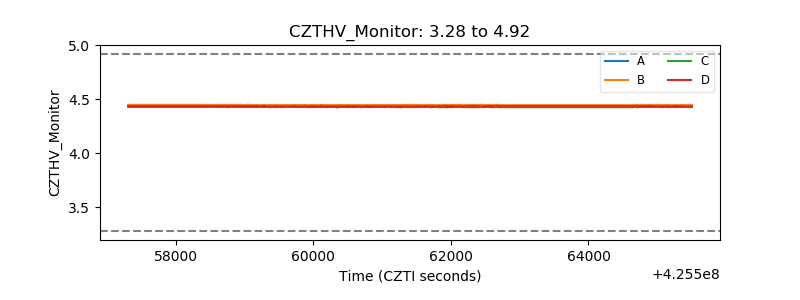 |
| D_VDD | 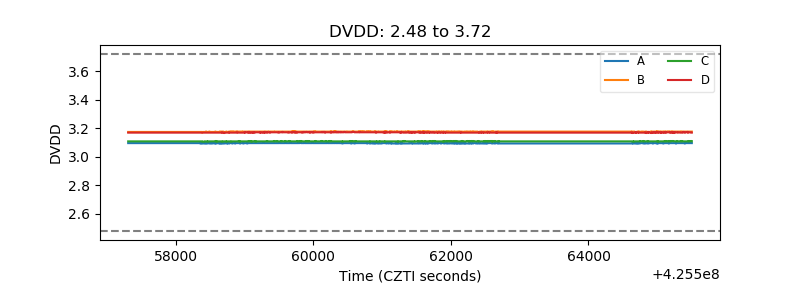 |
| Temperature 1 | 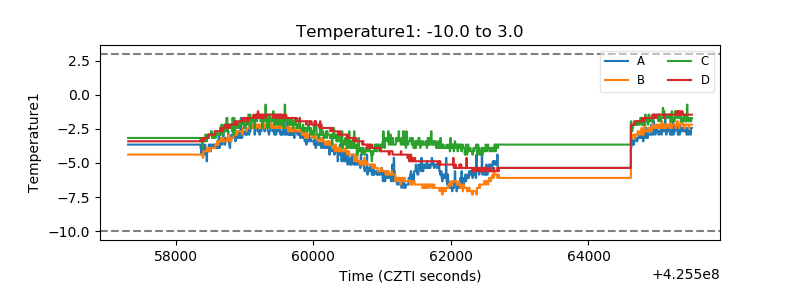 |
| Veto HV Monitor | 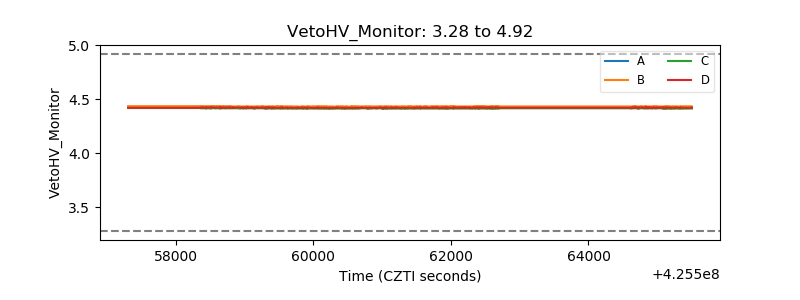 |
| Veto LLD | 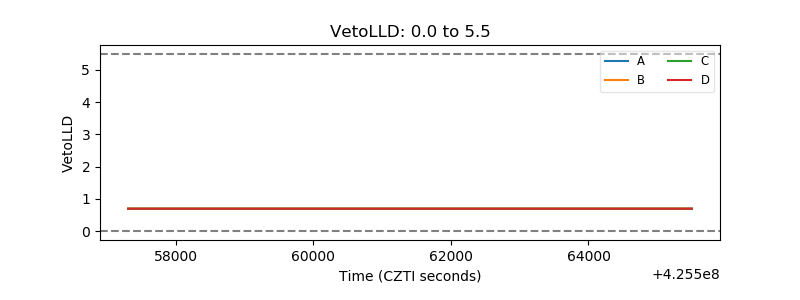 |
| Alpha Counter | 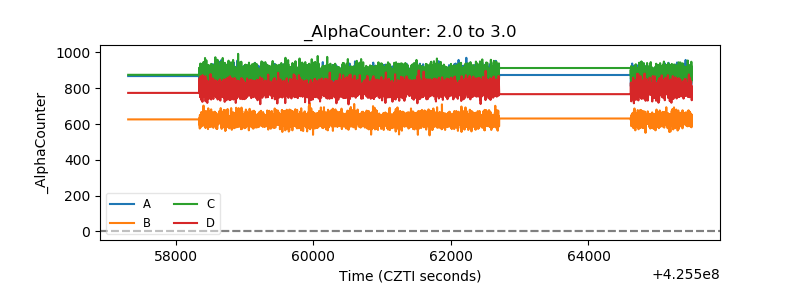 |
| _CPM_Rate | 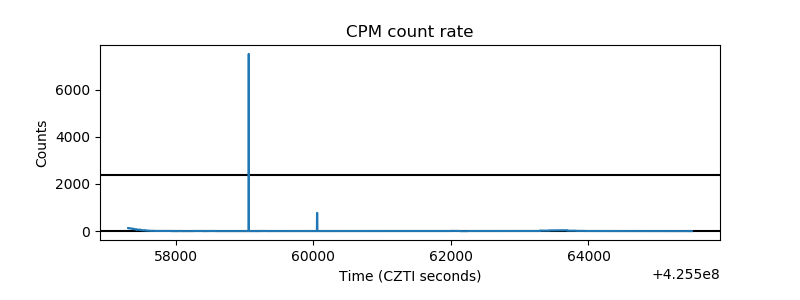 |
| CZT Counter | 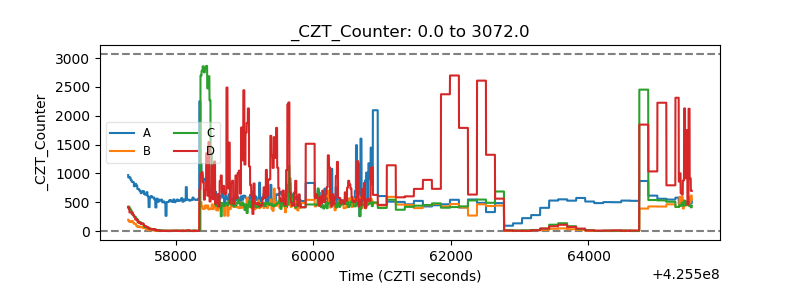 |
| +2.5 Volts monitor | 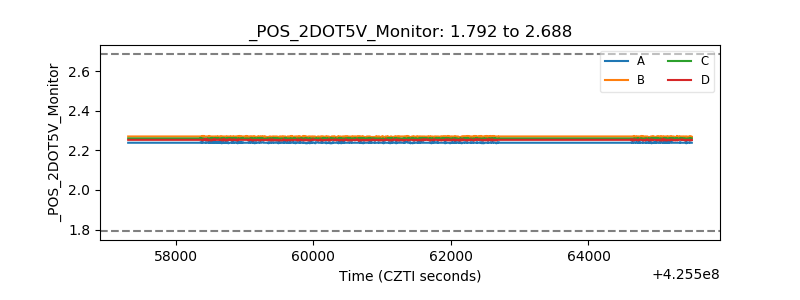 |
| +5 Volts monitor | 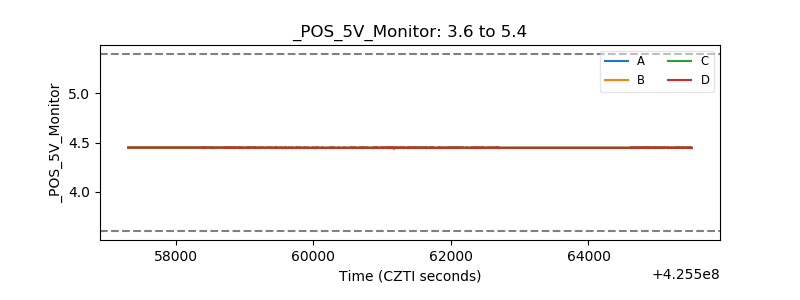 |
| _ROLL_ROT | 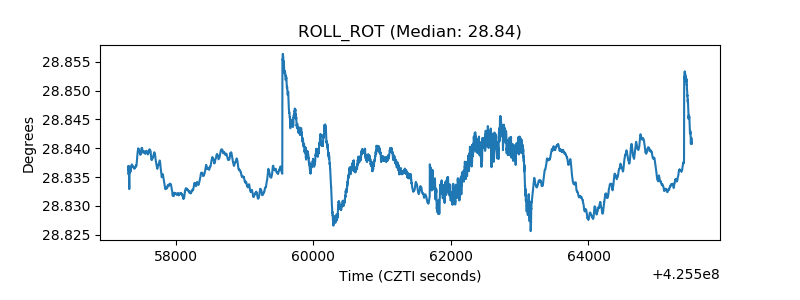 |
| _Roll_DEC | 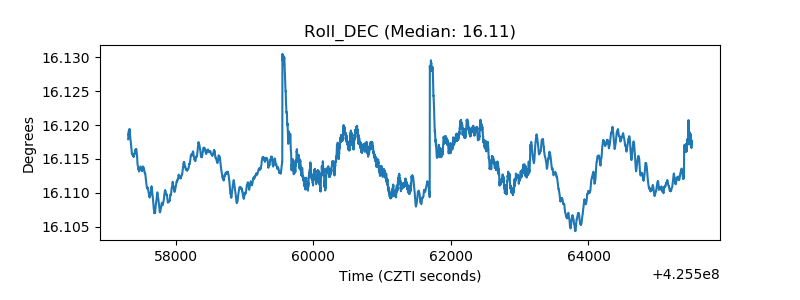 |
| _Roll_RA | 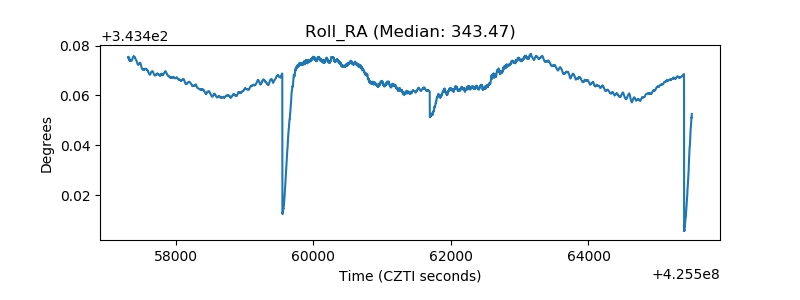 |
| Veto Counter | 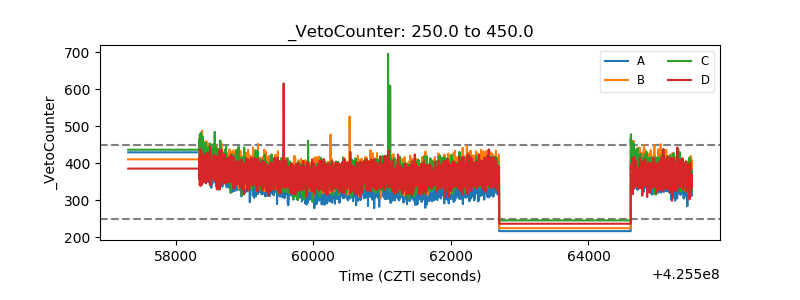 |