| Param | Original file | Final file |
|---|---|---|
| Filename | modeM0/AS1T05_124T01_9000005712_41884cztM0_level2.fits | modeM0/AS1T05_124T01_9000005712_41884cztM0_level2_quad_clean.evt |
| Size (bytes) | 276,704,640 | 50,993,280 |
| Size | 263.9 MB | 48.6 MB |
| Events in quadrant A | 1,741,995 | 362,530 |
| Events in quadrant B | 1,492,925 | 365,938 |
| Events in quadrant C | 1,887,462 | 324,619 |
| Events in quadrant D | 4,863,973 | 258,459 |
| Mode SS | |||
|---|---|---|---|
| Quadrant | BADHDUFLAG | Total packets | Discarded packets |
| A | 0 | 64 | 0 |
| B | 0 | 64 | 0 |
| C | 0 | 64 | 0 |
| D | 0 | 64 | 0 |
| Mode M9 | |||
|---|---|---|---|
| Quadrant | BADHDUFLAG | Total packets | Discarded packets |
| A | 0 | 11 | 0 |
| B | 0 | 11 | 0 |
| C | 0 | 11 | 0 |
| D | 0 | 12 | 0 |
| Mode M0 | |||
|---|---|---|---|
| Quadrant | BADHDUFLAG | Total packets | Discarded packets |
| A | 0 | 7081 | 1 |
| B | 0 | 6646 | 1 |
| C | 0 | 7606 | 1 |
| D | 0 | 16744 | 1 |
| Quadrant | Total seconds | Saturated seconds | Saturation percentage |
|---|---|---|---|
| A | 3280 | 8 | 0.243902% |
| B | 3280 | 1 | 0.030488% |
| C | 3280 | 143 | 4.359756% |
| D | 3280 | 870 | 26.524390% |
Noise dominated data is calculated using 1-second bins in cleaned event files. If a bin has >2000 counts, and if more than 50% of those come from <1% of pixels, then it is considered to be noise-dominated and hence unusable.
| Quadrant | # 1 sec bins | Bins with >0 counts | Bins with >2000 counts | High rate bins dominated by noise | Noise dominated (total time) | Noise dominated (detector-on time) | Marked lightcurve |
|---|---|---|---|---|---|---|---|
| A | 3280 | 3280 | 3 | 3 | 0.09% | 0.09% | 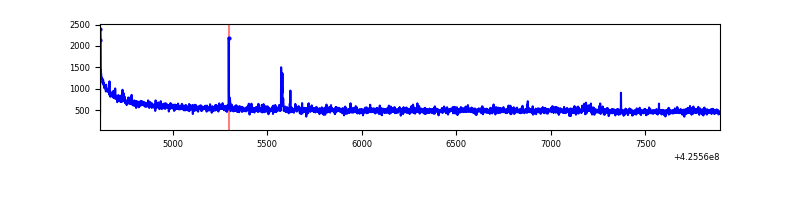 |
| B | 3280 | 3280 | 1 | 1 | 0.03% | 0.03% | 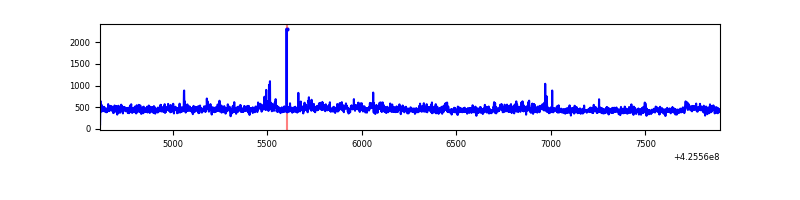 |
| C | 3280 | 3280 | 141 | 141 | 4.30% | 4.30% | 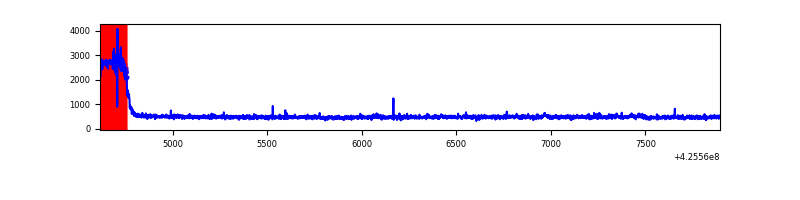 |
| D | 3280 | 3280 | 852 | 852 | 25.98% | 25.98% | 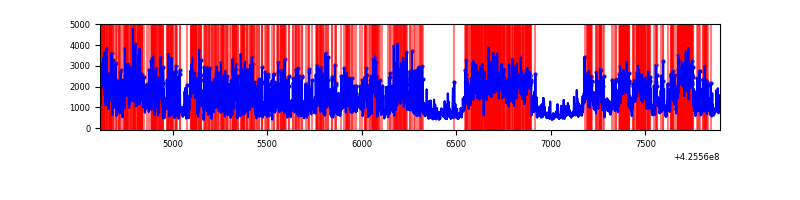 |
Top three noisy pixels from each quadrant. If the there are fewer than three noisy pixels in the level2.evt file, extra rows are filled as -1
| Pixel properties | Quadrant properties | ||||||
|---|---|---|---|---|---|---|---|
| Quadrant | DetID | PixID | Counts | Sigma | Mean | Median | Sigma |
| A | 10 | 83 | 314296 | 4155.53 | 361 | 353 | 75.5 |
| A | 14 | 24 | 19967 | 259.62 | 361 | 353 | 75.5 |
| A | 2 | 79 | 4983 | 61.29 | 361 | 353 | 75.5 |
| B | 0 | 156 | 65852 | 927.59 | 355 | 346 | 70.6 |
| B | 0 | 245 | 15817 | 219.07 | 355 | 346 | 70.6 |
| B | 12 | 111 | 9038 | 123.08 | 355 | 346 | 70.6 |
| C | 0 | 10 | 430555 | 5387.66 | 336 | 338 | 79.9 |
| C | 15 | 214 | 127496 | 1592.41 | 336 | 338 | 79.9 |
| C | 0 | 15 | 9197 | 110.94 | 336 | 338 | 79.9 |
| D | 12 | 79 | 3103919 | 39022.13 | 318 | 309 | 79.5 |
| D | 13 | 249 | 333226 | 4185.81 | 318 | 309 | 79.5 |
| D | 5 | 222 | 70464 | 882.07 | 318 | 309 | 79.5 |
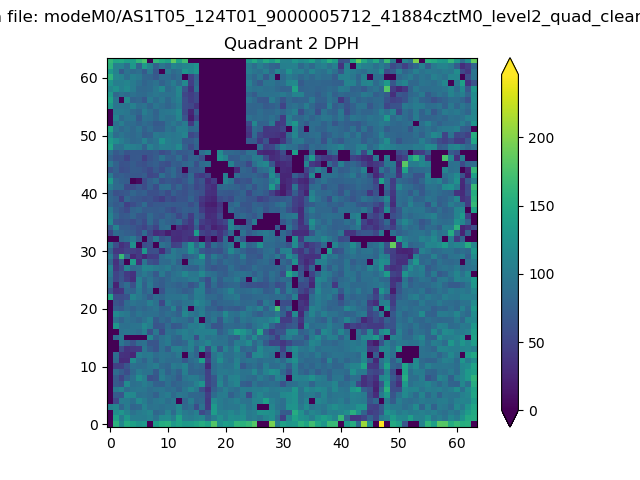
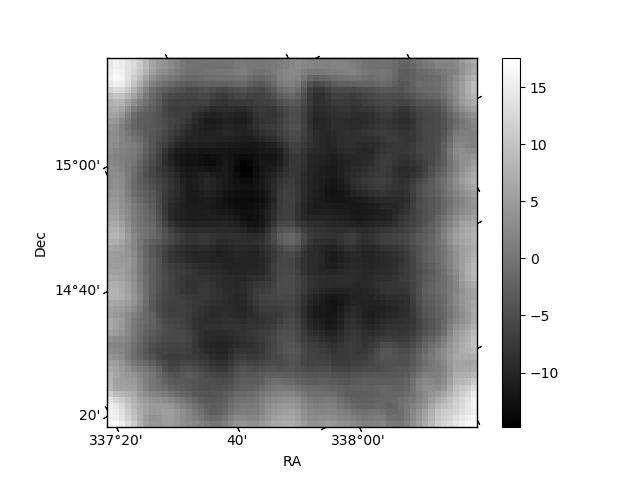
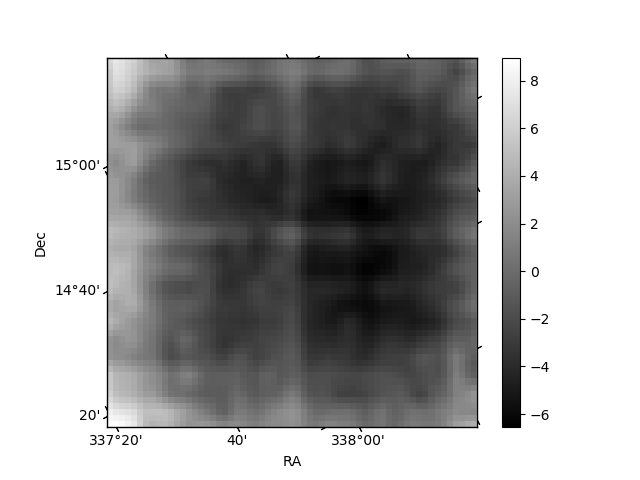
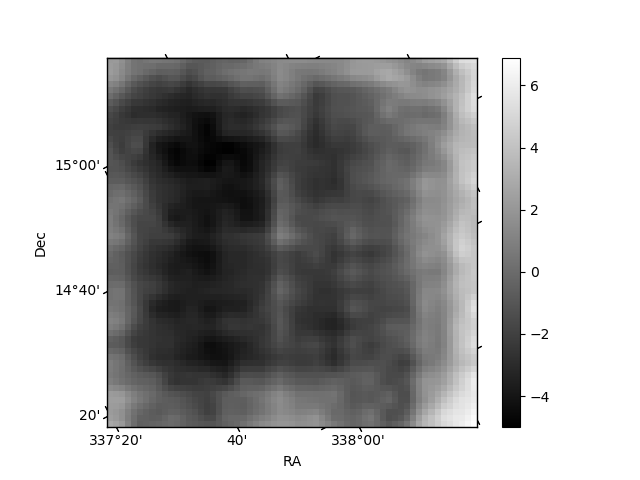
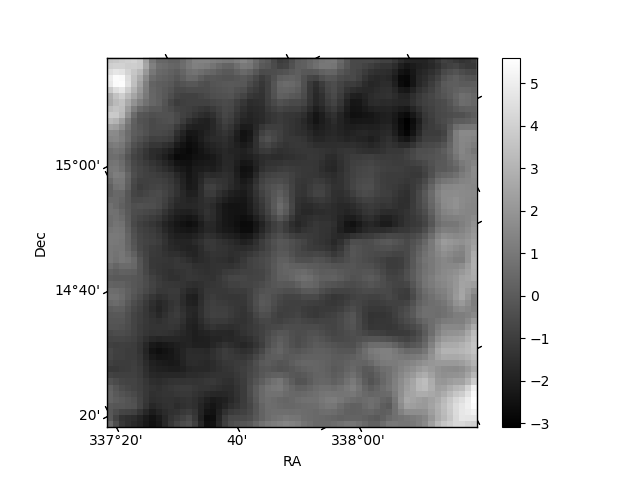
Histogram calculated using DETX and DETY for each event in the final _common_clean file
| Quadrant A | 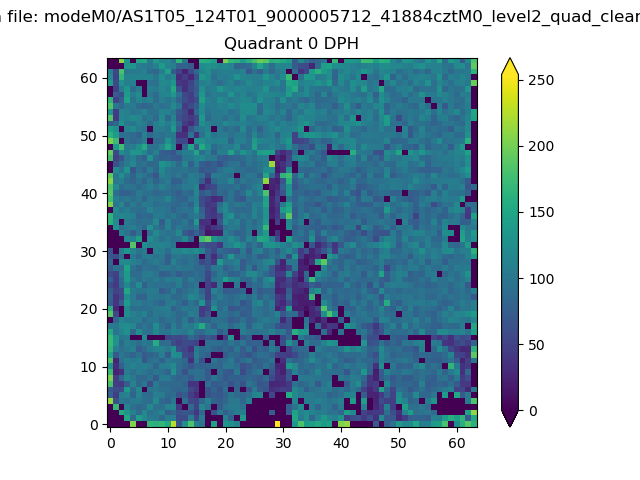 |
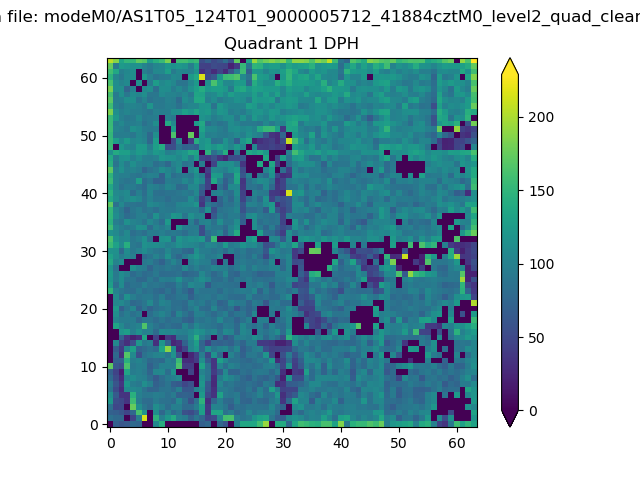 |
Quadrant B |
|---|---|---|---|
| Quadrant D | 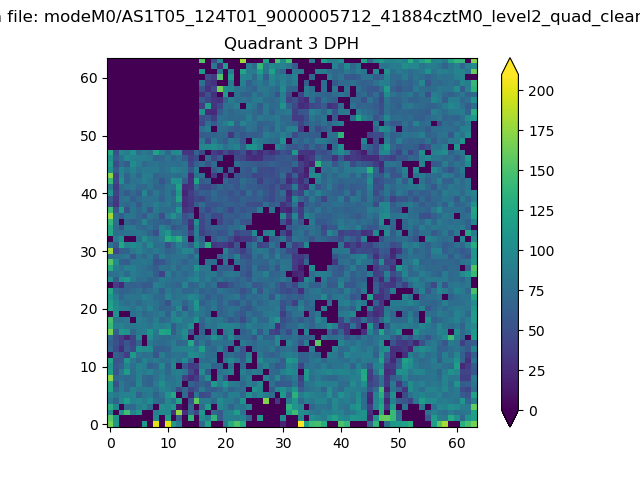 |
 |
Quadrant C |
| Plot type | Count rate plots | Images |
|---|---|---|
| Comparison with Poisson distribution Blue bars denote a histogram of data divided into 1 sec bins. Red curve is a Poisson curve with rate = median count rate of data. |
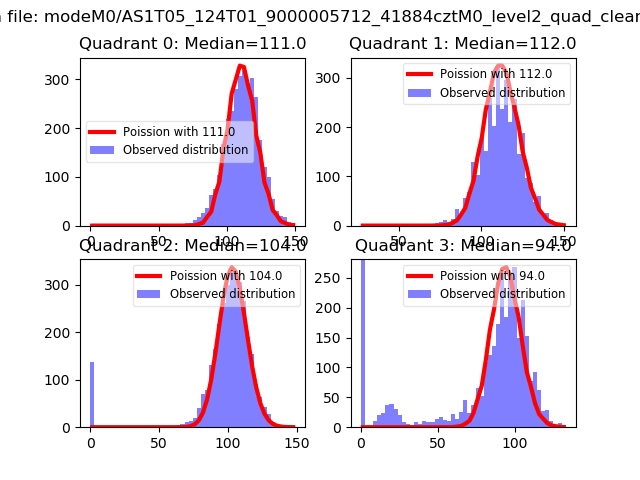 |
 |
| Quadrant-wise count rates Data is divided into 100 sec bins |
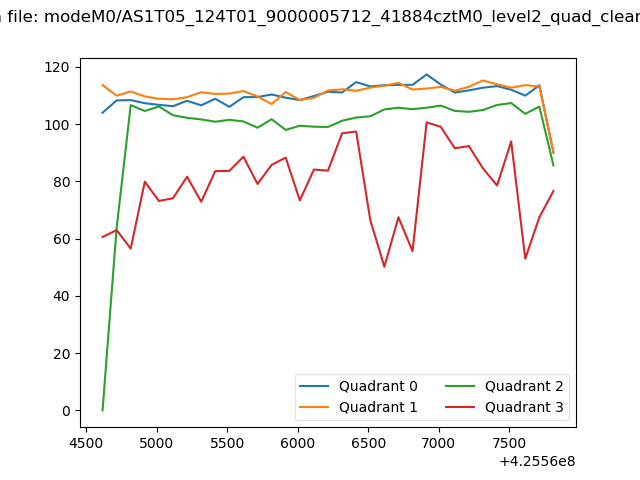 |
|
| Module-wise count rates for Quadrant A Data is divided into 100 sec bins |
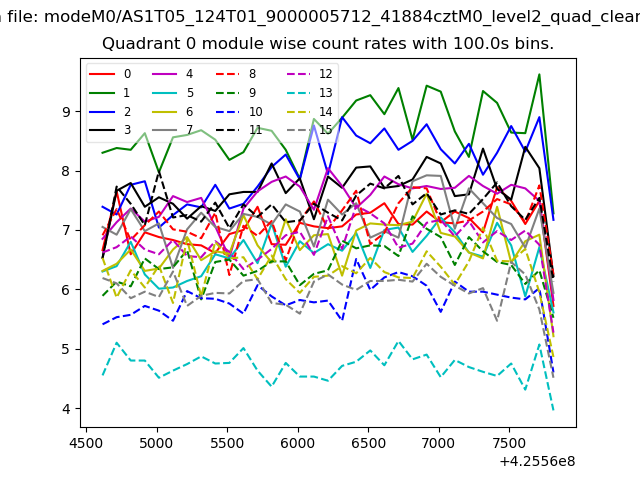 |
 |
| Module-wise count rates for Quadrant B Data is divided into 100 sec bins |
 |
 |
| Module-wise count rates for Quadrant C Data is divided into 100 sec bins |
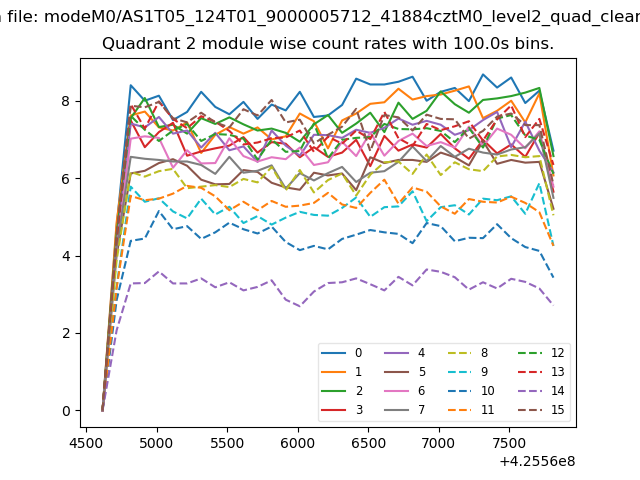 |
 |
| Module-wise count rates for Quadrant D Data is divided into 100 sec bins |
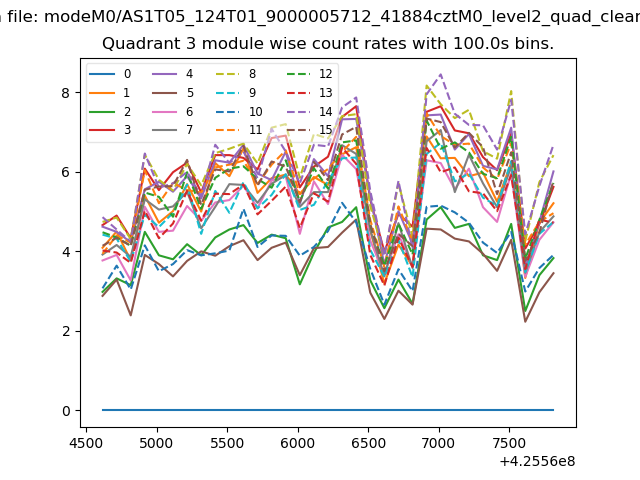 |
 |
| Parameter | Plot |
|---|---|
| CZT HV Monitor | 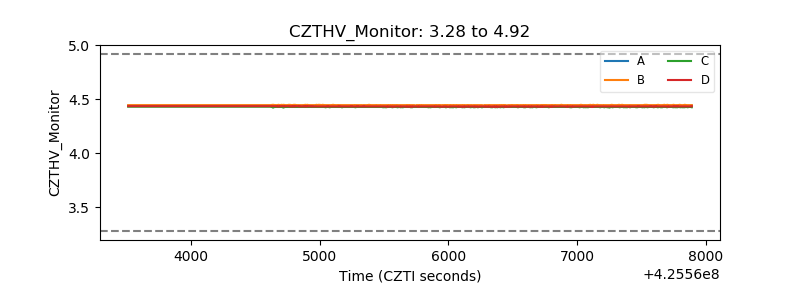 |
| D_VDD | 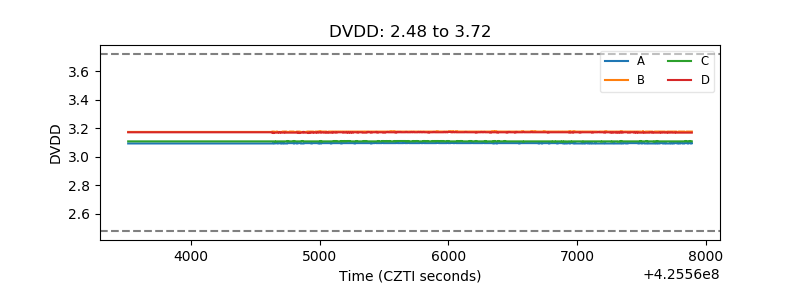 |
| Temperature 1 | 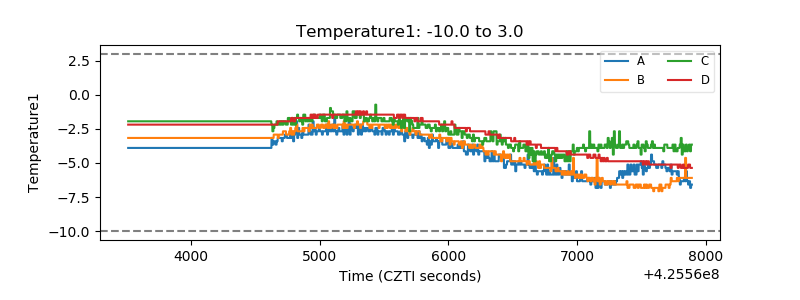 |
| Veto HV Monitor | 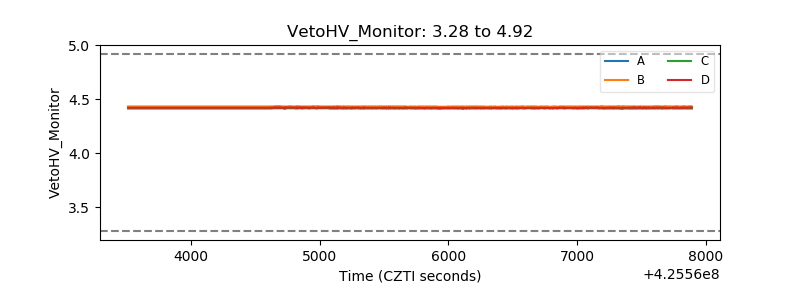 |
| Veto LLD | 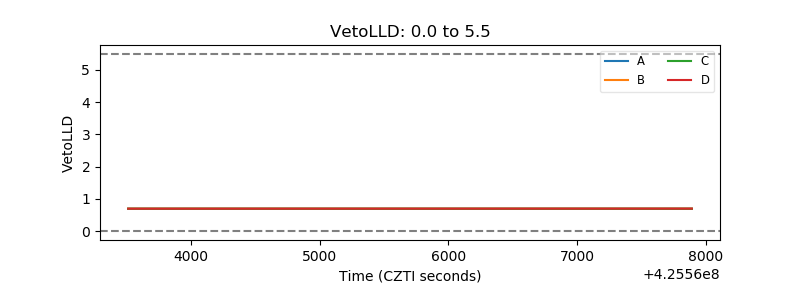 |
| Alpha Counter | 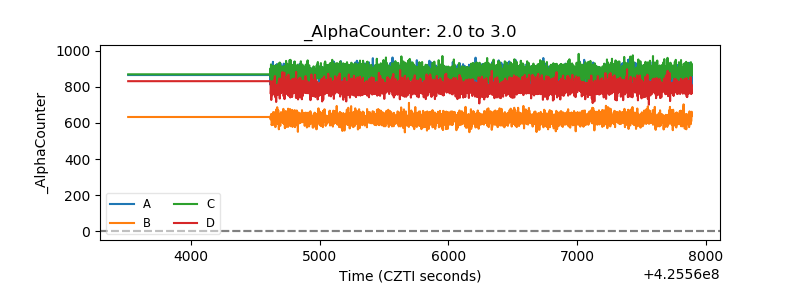 |
| _CPM_Rate | 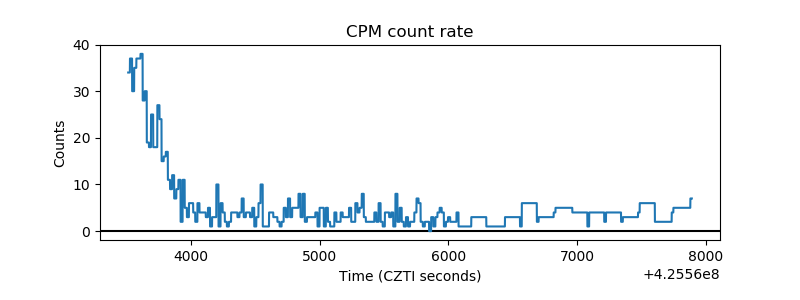 |
| CZT Counter | 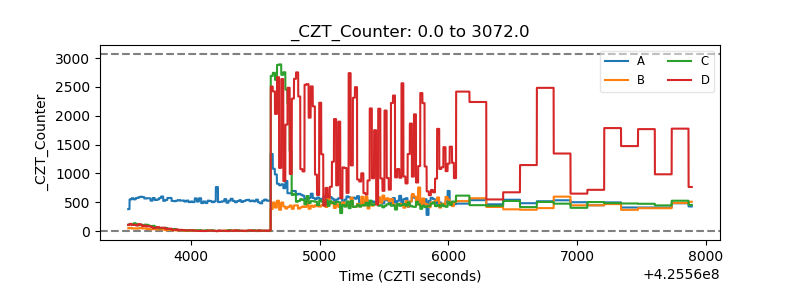 |
| +2.5 Volts monitor | 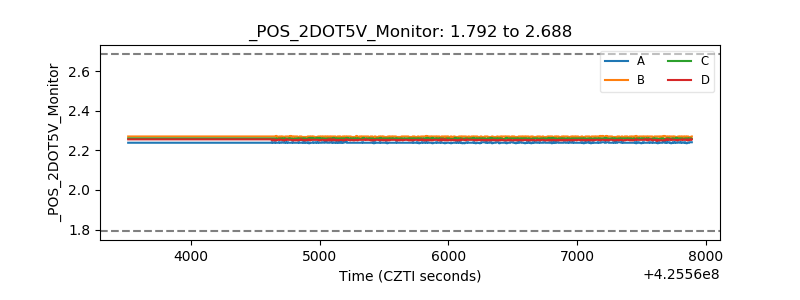 |
| +5 Volts monitor | 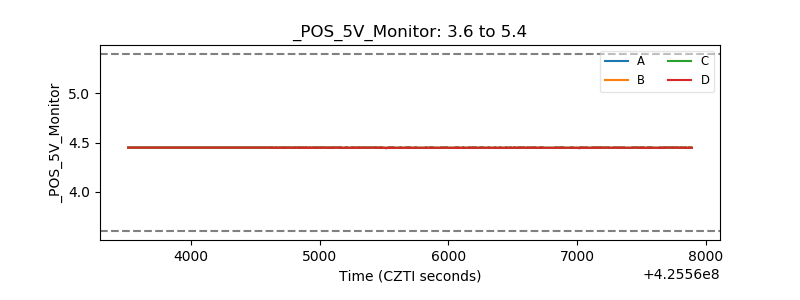 |
| _ROLL_ROT | 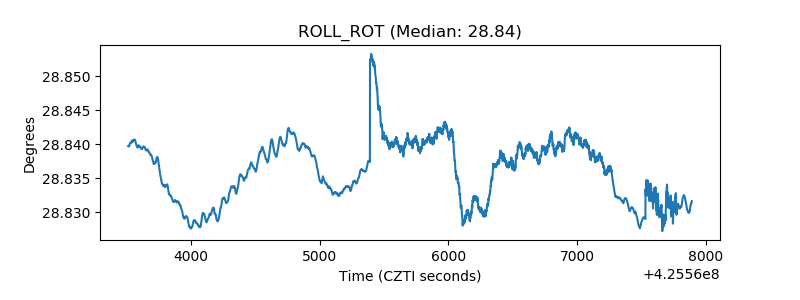 |
| _Roll_DEC | 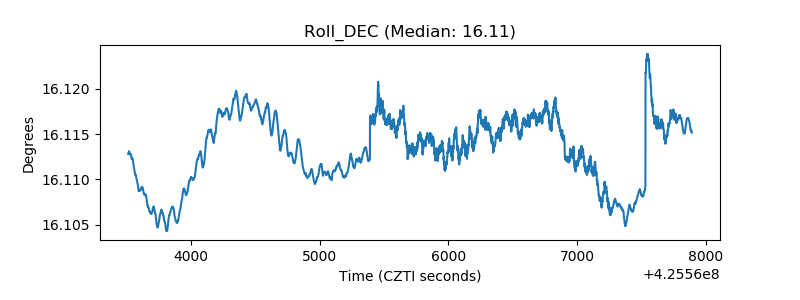 |
| _Roll_RA | 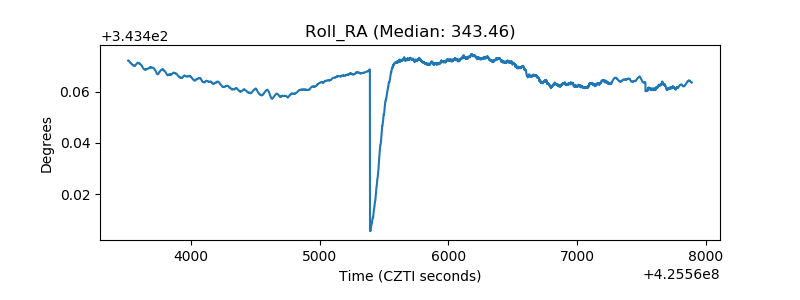 |
| Veto Counter | 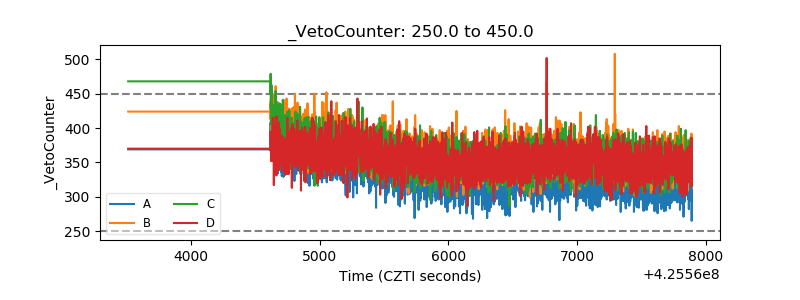 |