| Param | Original file | Final file |
|---|---|---|
| Filename | modeM0/AS1A12_099T01_9000005716_41889cztM0_level2.fits | modeM0/AS1A12_099T01_9000005716_41889cztM0_level2_quad_clean.evt |
| Size (bytes) | 314,951,040 | 63,616,320 |
| Size | 300.4 MB | 60.7 MB |
| Events in quadrant A | 2,717,136 | 427,968 |
| Events in quadrant B | 1,922,783 | 449,304 |
| Events in quadrant C | 2,171,638 | 412,700 |
| Events in quadrant D | 4,530,400 | 349,838 |
| Mode M9 | |||
|---|---|---|---|
| Quadrant | BADHDUFLAG | Total packets | Discarded packets |
| A | 0 | 15 | 0 |
| B | 0 | 15 | 0 |
| C | 0 | 15 | 0 |
| D | 0 | 15 | 0 |
| Mode M0 | |||
|---|---|---|---|
| Quadrant | BADHDUFLAG | Total packets | Discarded packets |
| A | 0 | 10571 | 1 |
| B | 0 | 8482 | 1 |
| C | 0 | 9024 | 1 |
| D | 0 | 16258 | 1 |
| Mode SS | |||
|---|---|---|---|
| Quadrant | BADHDUFLAG | Total packets | Discarded packets |
| A | 0 | 84 | 0 |
| B | 0 | 84 | 0 |
| C | 0 | 84 | 0 |
| D | 0 | 84 | 0 |
| Quadrant | Total seconds | Saturated seconds | Saturation percentage |
|---|---|---|---|
| A | 4058 | 122 | 3.006407% |
| B | 4058 | 12 | 0.295712% |
| C | 4058 | 124 | 3.055692% |
| D | 4058 | 625 | 15.401676% |
Noise dominated data is calculated using 1-second bins in cleaned event files. If a bin has >2000 counts, and if more than 50% of those come from <1% of pixels, then it is considered to be noise-dominated and hence unusable.
| Quadrant | # 1 sec bins | Bins with >0 counts | Bins with >2000 counts | High rate bins dominated by noise | Noise dominated (total time) | Noise dominated (detector-on time) | Marked lightcurve |
|---|---|---|---|---|---|---|---|
| A | 5581 | 4059 | 114 | 114 | 2.04% | 2.81% | 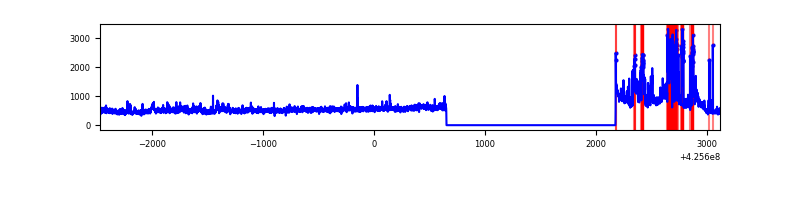 |
| B | 5581 | 4059 | 6 | 6 | 0.11% | 0.15% | 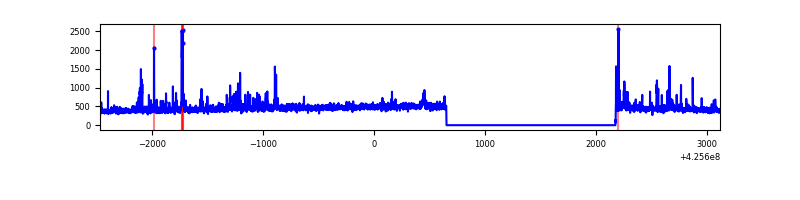 |
| C | 5581 | 4059 | 124 | 124 | 2.22% | 3.05% | 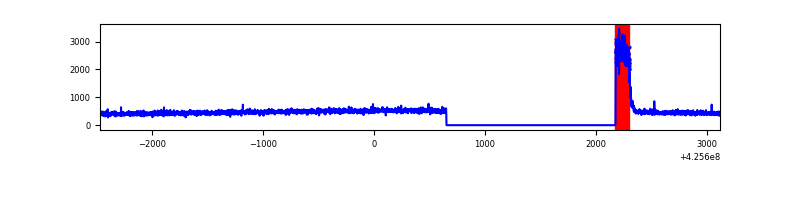 |
| D | 5581 | 4059 | 670 | 670 | 12.01% | 16.51% | 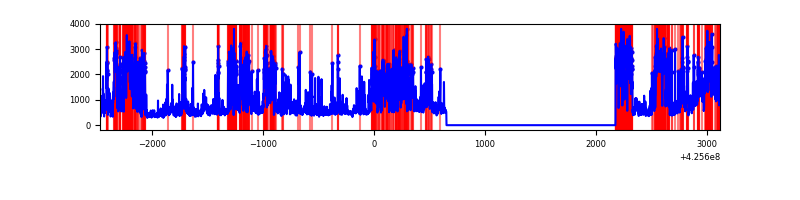 |
Top three noisy pixels from each quadrant. If the there are fewer than three noisy pixels in the level2.evt file, extra rows are filled as -1
| Pixel properties | Quadrant properties | ||||||
|---|---|---|---|---|---|---|---|
| Quadrant | DetID | PixID | Counts | Sigma | Mean | Median | Sigma |
| A | 14 | 24 | 669798 | 7293.53 | 439 | 428 | 91.8 |
| A | 10 | 83 | 337476 | 3672.51 | 439 | 428 | 91.8 |
| A | 14 | 250 | 6981 | 71.4 | 439 | 428 | 91.8 |
| B | 5 | 255 | 126878 | 1445.94 | 441 | 427 | 87.5 |
| B | 0 | 190 | 42367 | 479.57 | 441 | 427 | 87.5 |
| B | 7 | 202 | 12148 | 134.02 | 441 | 427 | 87.5 |
| C | 0 | 10 | 340010 | 3350.83 | 428 | 429 | 101.3 |
| C | 15 | 214 | 158909 | 1563.81 | 428 | 429 | 101.3 |
| C | 0 | 15 | 3590 | 31.19 | 428 | 429 | 101.3 |
| D | 12 | 79 | 2465739 | 24009.49 | 412 | 400 | 102.7 |
| D | 12 | 6 | 219447 | 2133.26 | 412 | 400 | 102.7 |
| D | 13 | 249 | 109150 | 1059.1 | 412 | 400 | 102.7 |
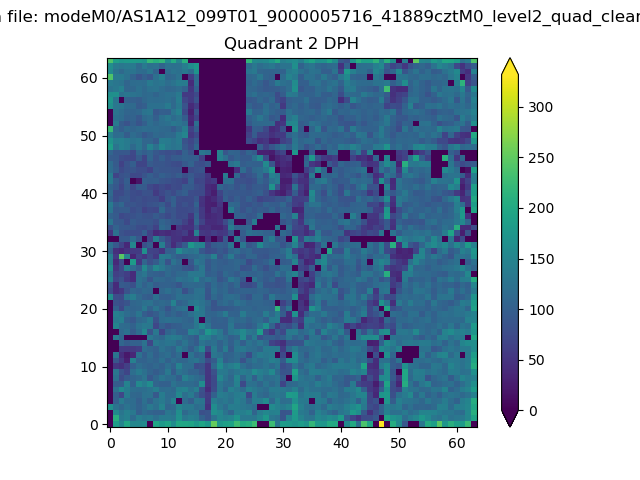
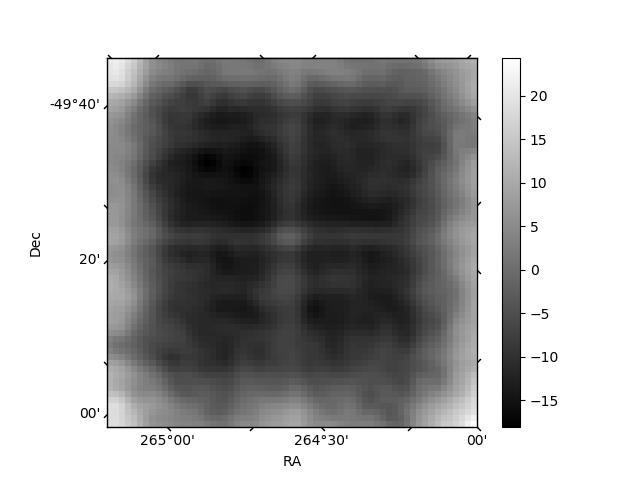
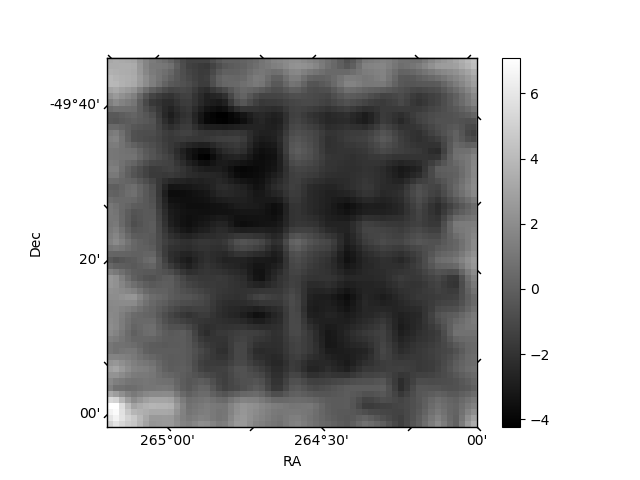
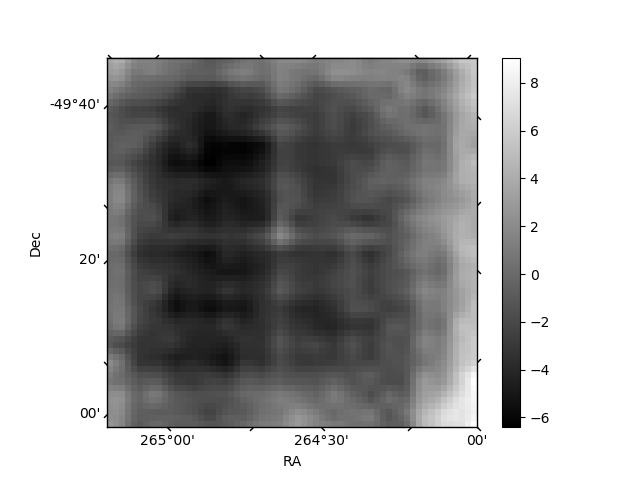
Histogram calculated using DETX and DETY for each event in the final _common_clean file
| Quadrant A | 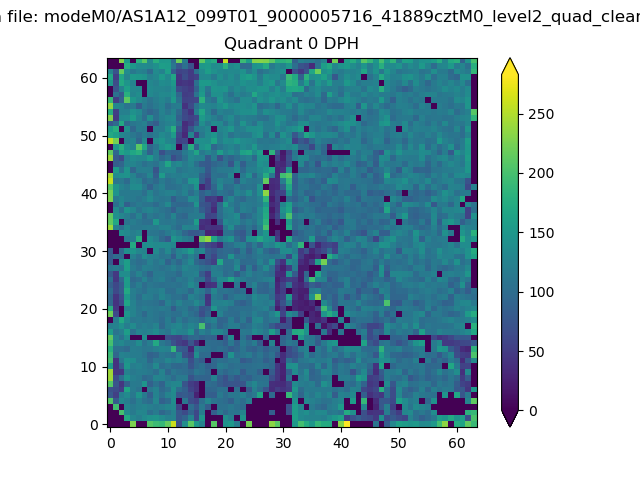 |
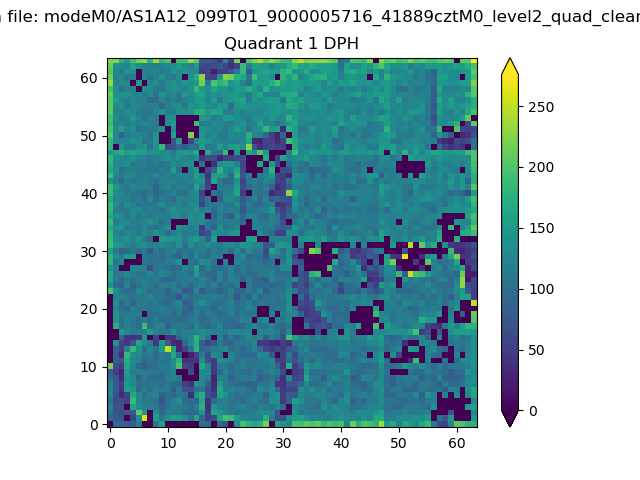 |
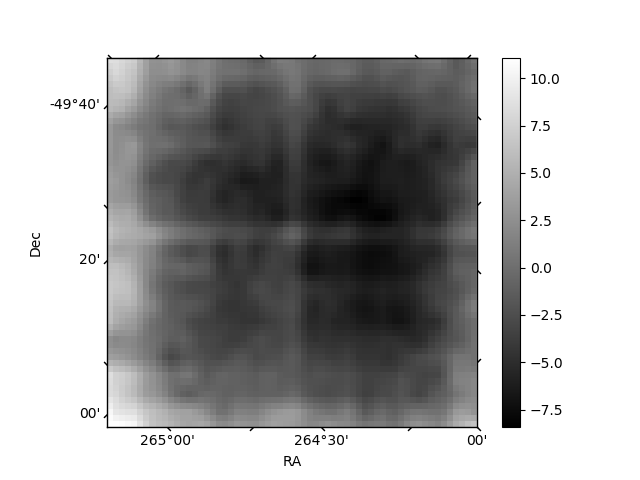
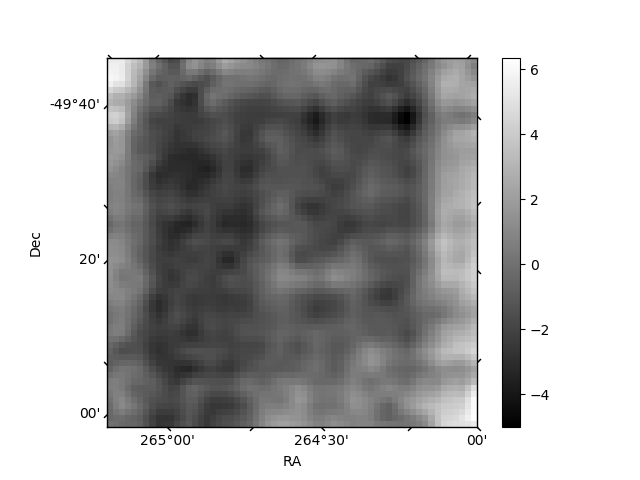
Quadrant B |
|---|---|---|---|
| Quadrant D | 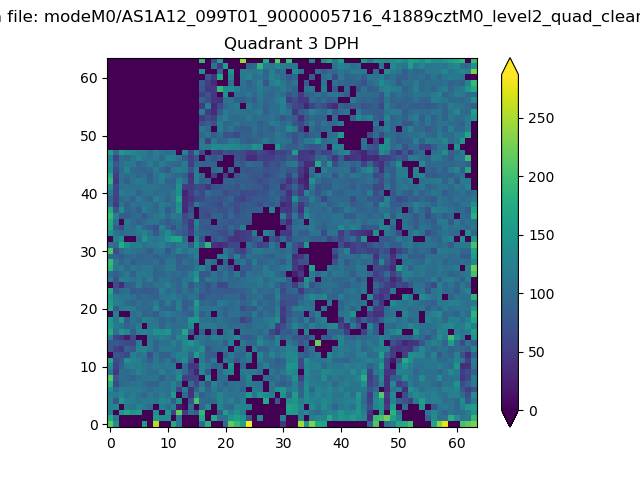 |
 |
Quadrant C |
| Plot type | Count rate plots | Images |
|---|---|---|
| Comparison with Poisson distribution Blue bars denote a histogram of data divided into 1 sec bins. Red curve is a Poisson curve with rate = median count rate of data. |
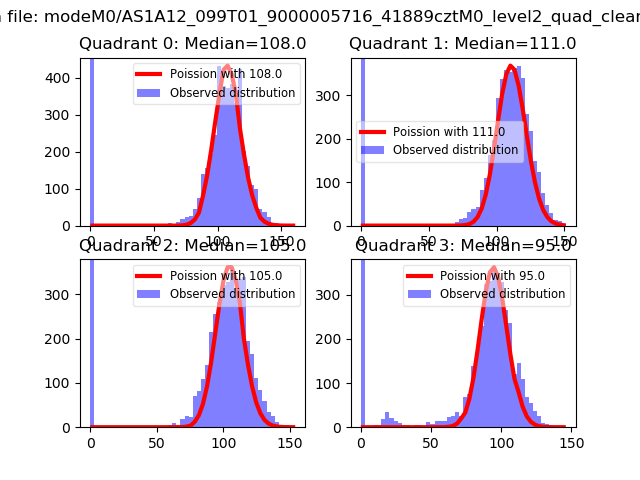 |
 |
| Quadrant-wise count rates Data is divided into 100 sec bins |
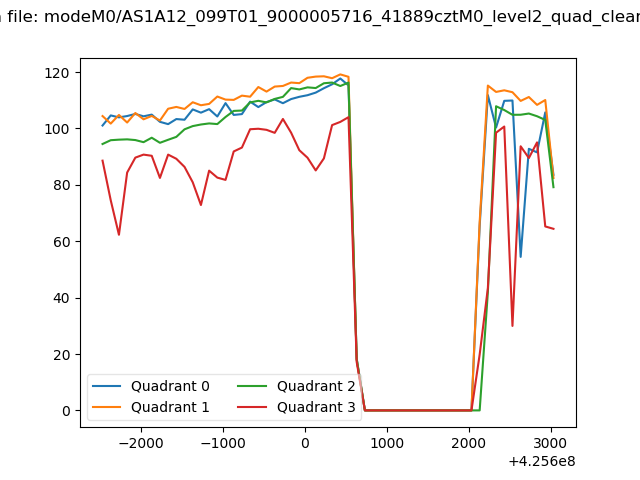 |
|
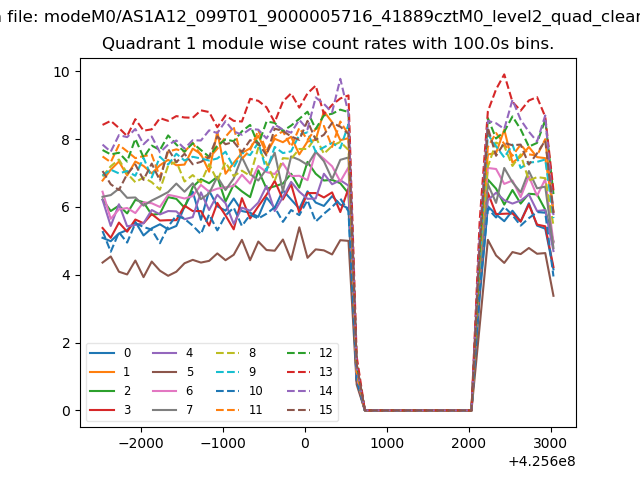
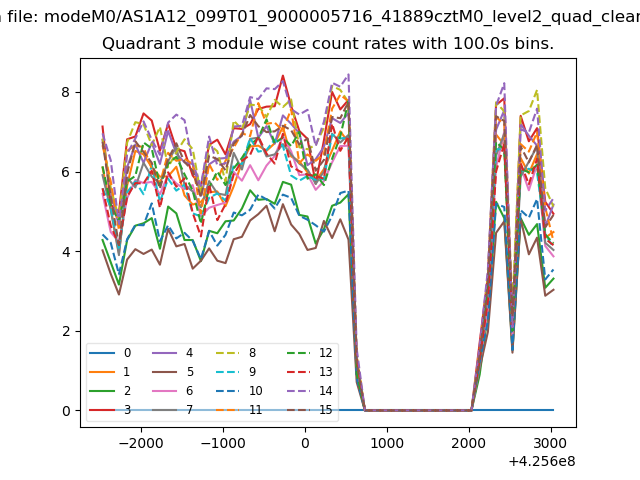
| Module-wise count rates for Quadrant A Data is divided into 100 sec bins |
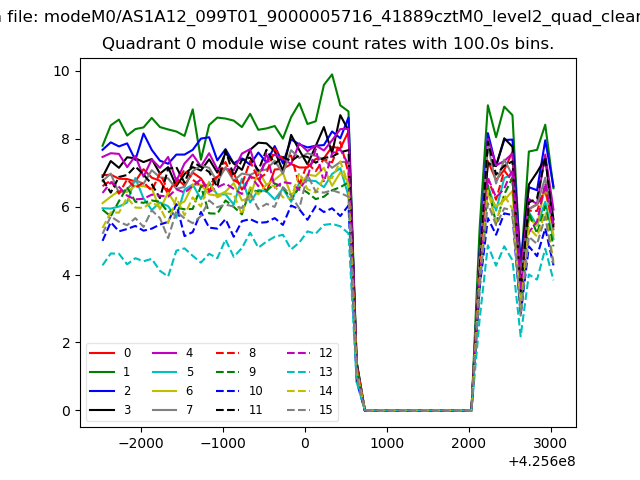 |
 |
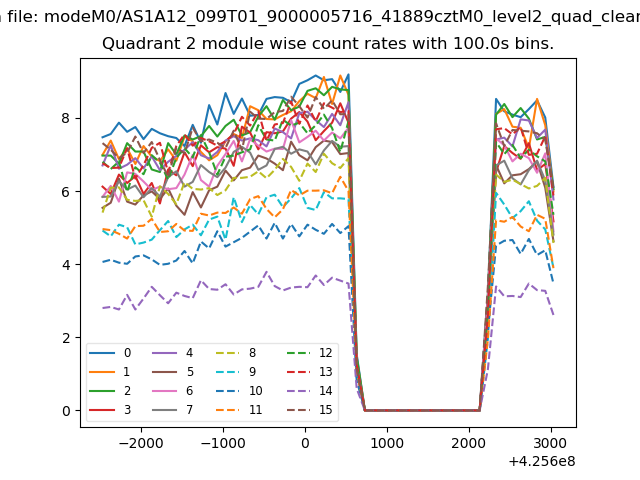
| Module-wise count rates for Quadrant B Data is divided into 100 sec bins |
 |
 |
| Module-wise count rates for Quadrant C Data is divided into 100 sec bins |
 |
 |
| Module-wise count rates for Quadrant D Data is divided into 100 sec bins |
 |
 |
| Parameter | Plot |
|---|---|
| CZT HV Monitor | 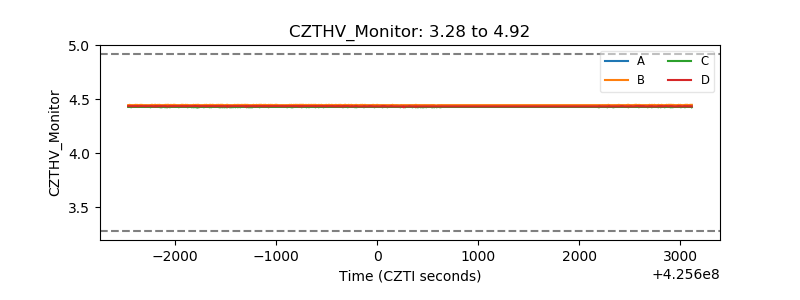 |
| D_VDD | 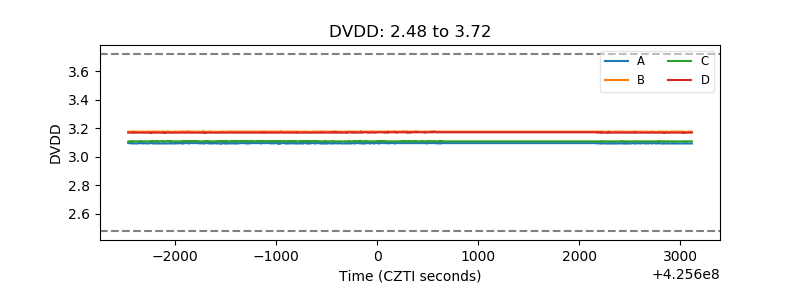 |
| Temperature 1 |  |
| Veto HV Monitor | 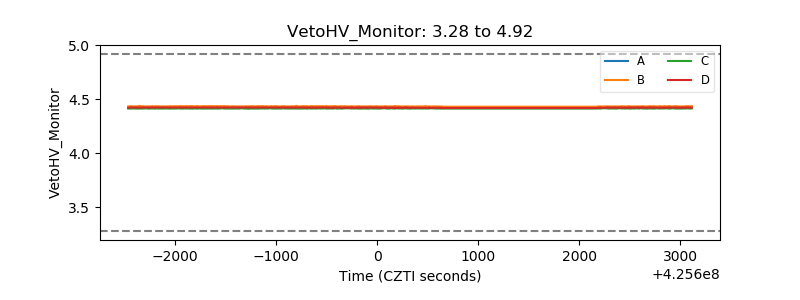 |
| Veto LLD | 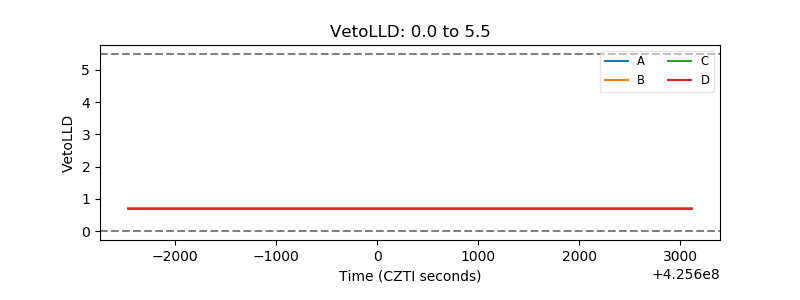 |
| Alpha Counter | 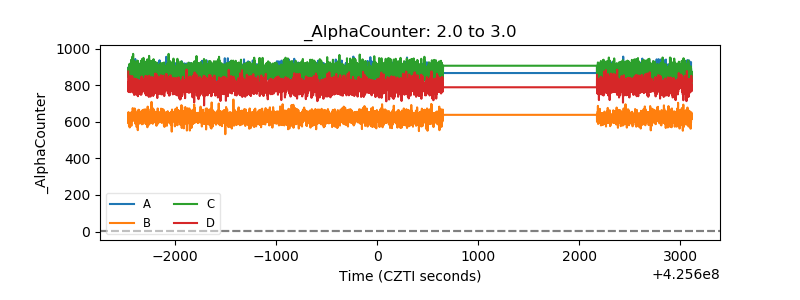 |
| _CPM_Rate | 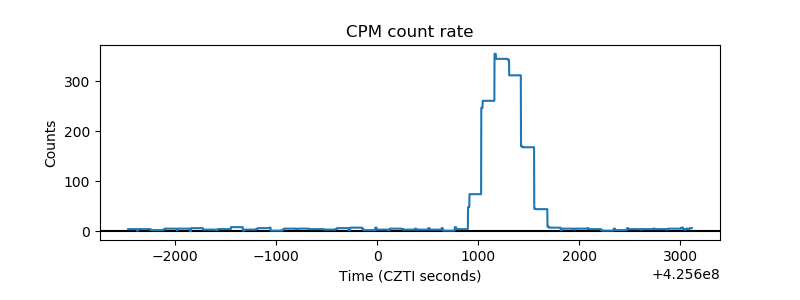 |
| CZT Counter | 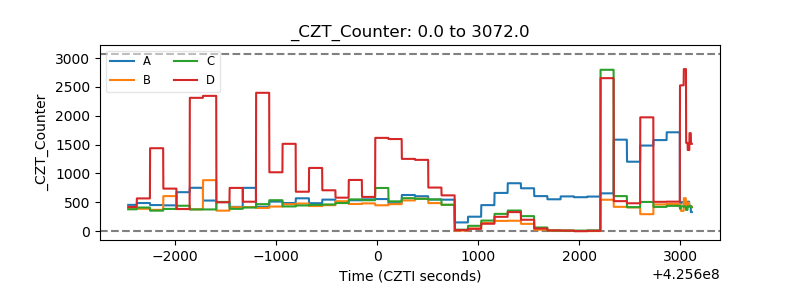 |
| +2.5 Volts monitor |  |
| +5 Volts monitor |  |
| _ROLL_ROT | 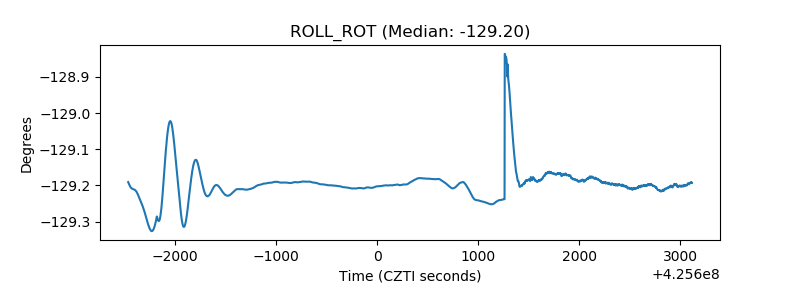 |
| _Roll_DEC |  |
| _Roll_RA | 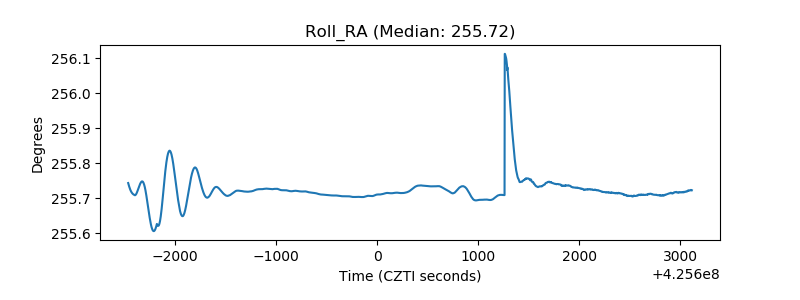 |
| Veto Counter | 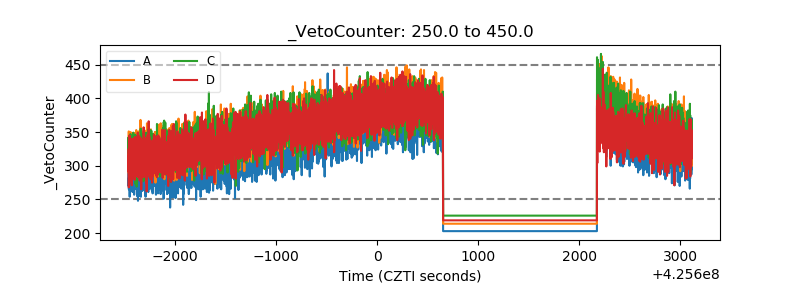 |