| Param | Original file | Final file |
|---|---|---|
| Filename | modeM0/AS1A12_099T01_9000005716_41890cztM0_level2.fits | modeM0/AS1A12_099T01_9000005716_41890cztM0_level2_quad_clean.evt |
| Size (bytes) | 436,728,960 | 88,007,040 |
| Size | 416.5 MB | 83.9 MB |
| Events in quadrant A | 4,539,823 | 584,314 |
| Events in quadrant B | 2,632,668 | 626,141 |
| Events in quadrant C | 3,211,978 | 562,731 |
| Events in quadrant D | 5,344,754 | 498,375 |
| Mode M9 | |||
|---|---|---|---|
| Quadrant | BADHDUFLAG | Total packets | Discarded packets |
| A | 0 | 31 | 0 |
| B | 0 | 32 | 0 |
| C | 0 | 32 | 0 |
| D | 0 | 32 | 0 |
| Mode M0 | |||
|---|---|---|---|
| Quadrant | BADHDUFLAG | Total packets | Discarded packets |
| A | 0 | 17177 | 2 |
| B | 0 | 11817 | 2 |
| C | 0 | 13181 | 2 |
| D | 0 | 19733 | 2 |
| Mode SS | |||
|---|---|---|---|
| Quadrant | BADHDUFLAG | Total packets | Discarded packets |
| A | 0 | 114 | 0 |
| B | 0 | 116 | 0 |
| C | 0 | 116 | 0 |
| D | 0 | 116 | 0 |
| Quadrant | Total seconds | Saturated seconds | Saturation percentage |
|---|---|---|---|
| A | 5623 | 331 | 5.886537% |
| B | 5623 | 23 | 0.409034% |
| C | 5622 | 260 | 4.624689% |
| D | 5622 | 613 | 10.903593% |
Noise dominated data is calculated using 1-second bins in cleaned event files. If a bin has >2000 counts, and if more than 50% of those come from <1% of pixels, then it is considered to be noise-dominated and hence unusable.
| Quadrant | # 1 sec bins | Bins with >0 counts | Bins with >2000 counts | High rate bins dominated by noise | Noise dominated (total time) | Noise dominated (detector-on time) | Marked lightcurve |
|---|---|---|---|---|---|---|---|
| A | 7296 | 5624 | 302 | 302 | 4.14% | 5.37% | 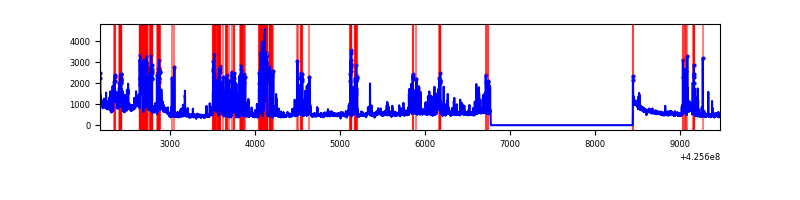 |
| B | 7296 | 5624 | 16 | 16 | 0.22% | 0.28% | 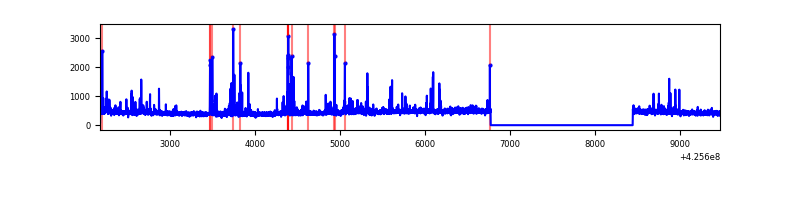 |
| C | 7295 | 5623 | 255 | 255 | 3.50% | 4.53% | 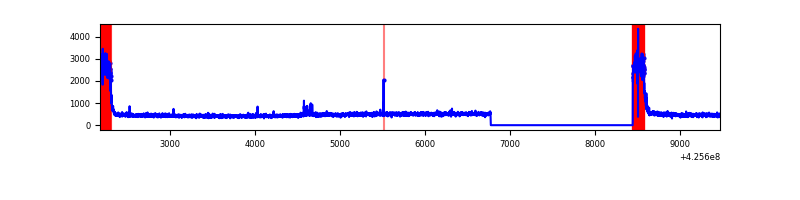 |
| D | 7295 | 5623 | 640 | 640 | 8.77% | 11.38% | 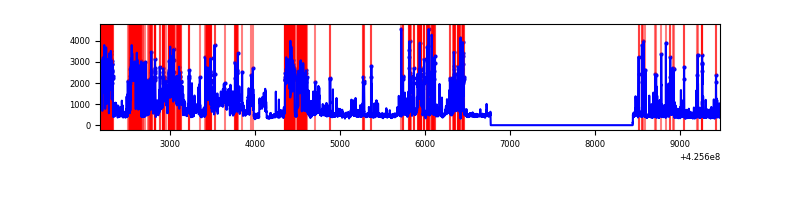 |
Top three noisy pixels from each quadrant. If the there are fewer than three noisy pixels in the level2.evt file, extra rows are filled as -1
| Pixel properties | Quadrant properties | ||||||
|---|---|---|---|---|---|---|---|
| Quadrant | DetID | PixID | Counts | Sigma | Mean | Median | Sigma |
| A | 14 | 24 | 1720623 | 14120.19 | 588 | 575 | 121.8 |
| A | 10 | 83 | 524098 | 4297.69 | 588 | 575 | 121.8 |
| A | 2 | 79 | 12543 | 98.24 | 588 | 575 | 121.8 |
| B | 5 | 255 | 213125 | 1816.86 | 601 | 586 | 117.0 |
| B | 0 | 190 | 32889 | 276.14 | 601 | 586 | 117.0 |
| B | 12 | 111 | 15149 | 124.49 | 601 | 586 | 117.0 |
| C | 0 | 10 | 722341 | 5367.89 | 575 | 577 | 134.5 |
| C | 15 | 214 | 221734 | 1644.78 | 575 | 577 | 134.5 |
| C | 14 | 254 | 19662 | 141.94 | 575 | 577 | 134.5 |
| D | 12 | 79 | 2292280 | 16494.56 | 564 | 548 | 138.9 |
| D | 13 | 249 | 354732 | 2549.21 | 564 | 548 | 138.9 |
| D | 12 | 6 | 289897 | 2082.57 | 564 | 548 | 138.9 |
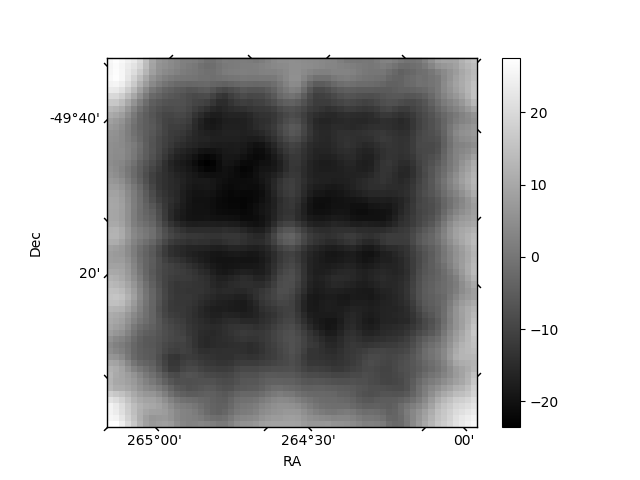
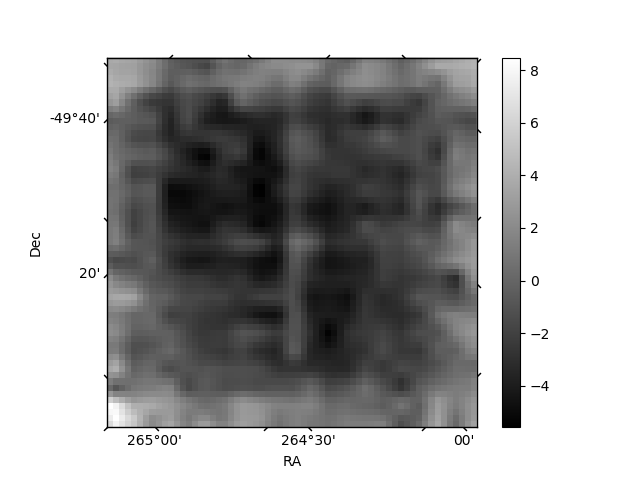
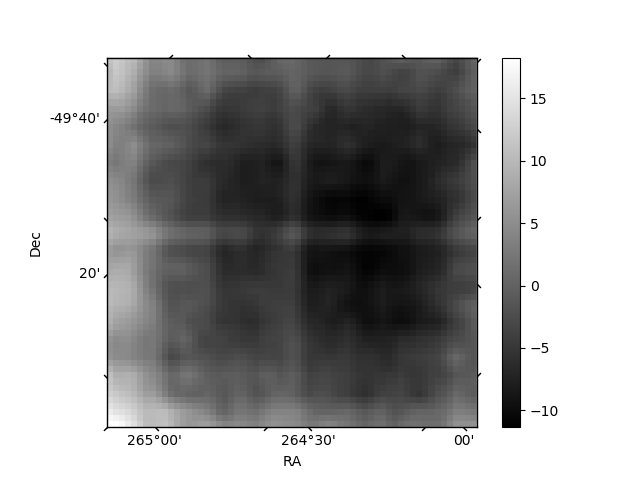
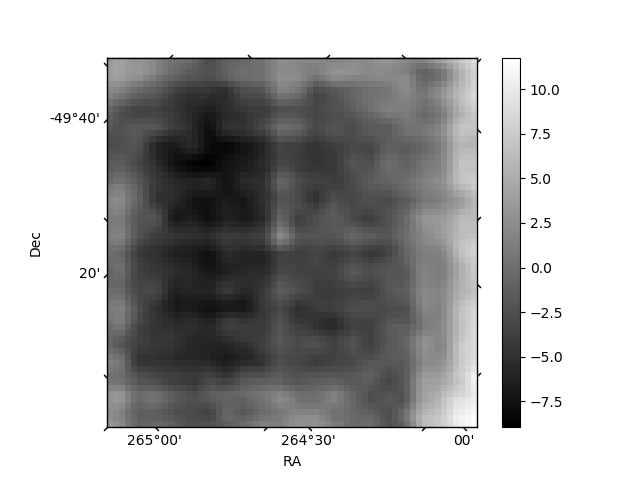
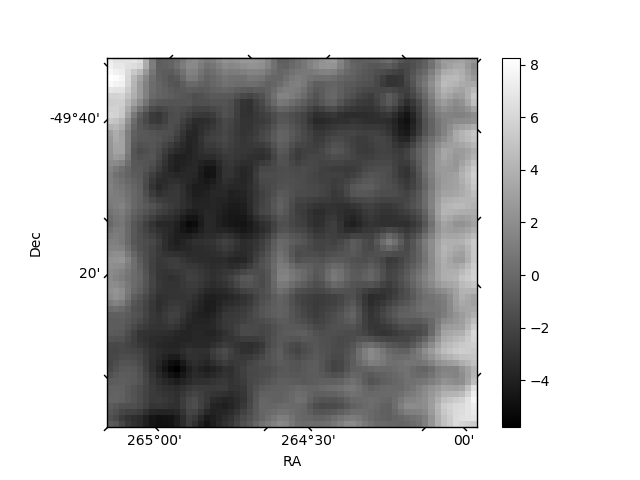
Histogram calculated using DETX and DETY for each event in the final _common_clean file
| Quadrant A | 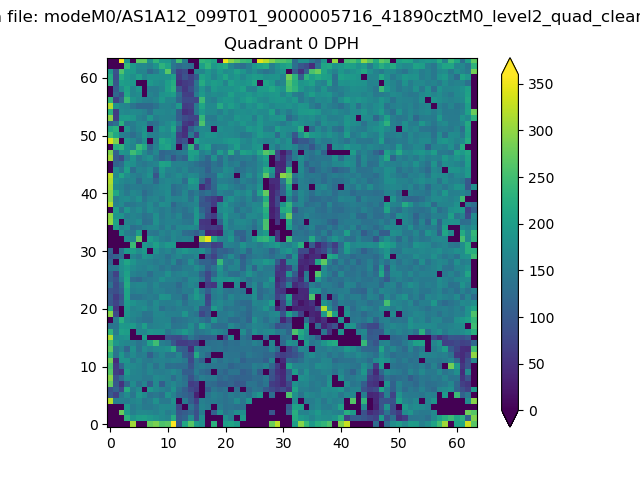 |
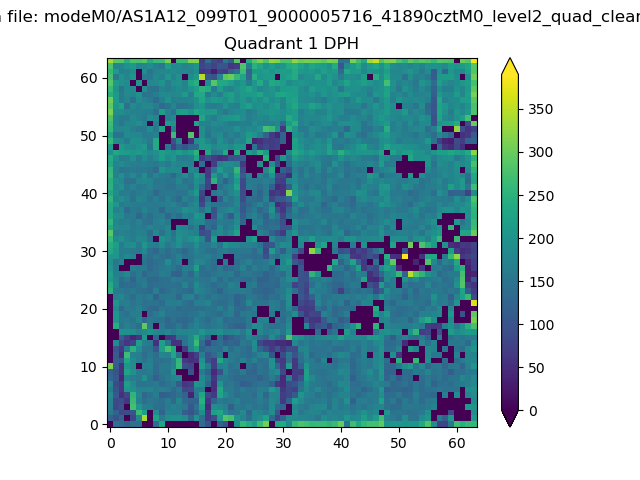 |
Quadrant B |
|---|---|---|---|
| Quadrant D | 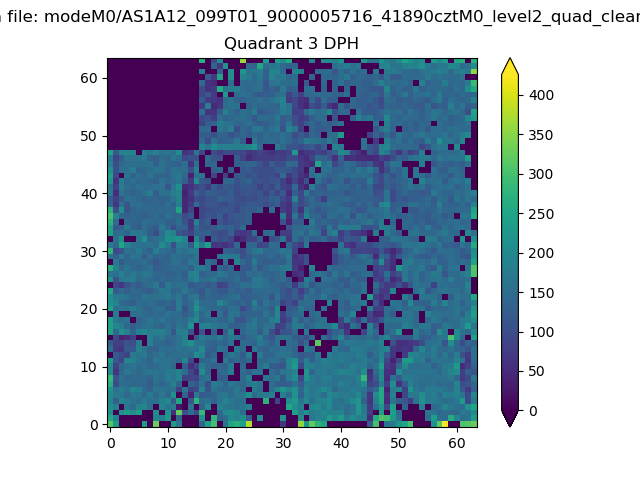 |
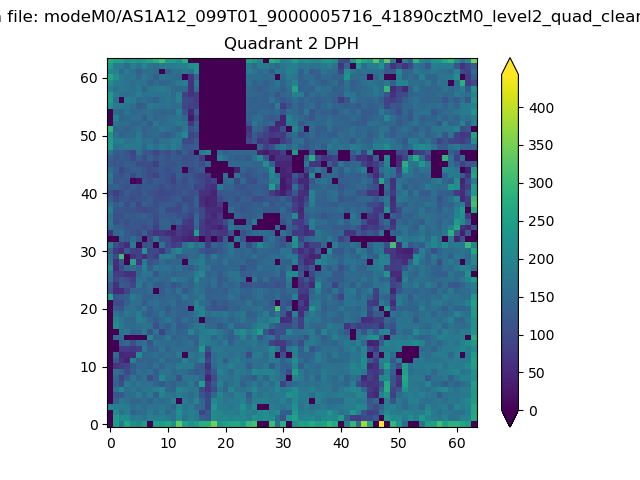 |
Quadrant C |
| Plot type | Count rate plots | Images |
|---|---|---|
| Comparison with Poisson distribution Blue bars denote a histogram of data divided into 1 sec bins. Red curve is a Poisson curve with rate = median count rate of data. |
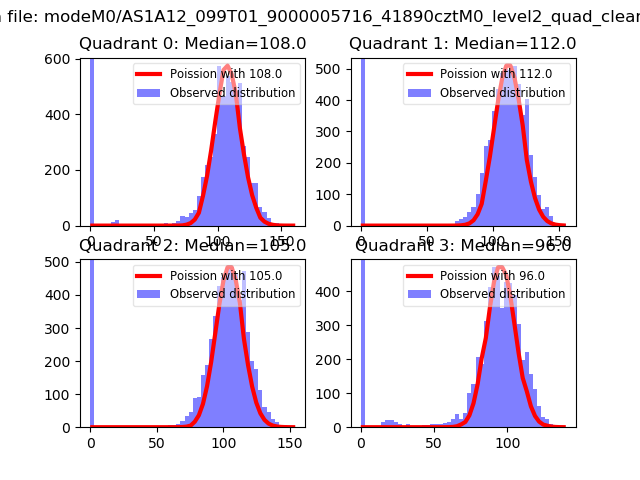 |
 |
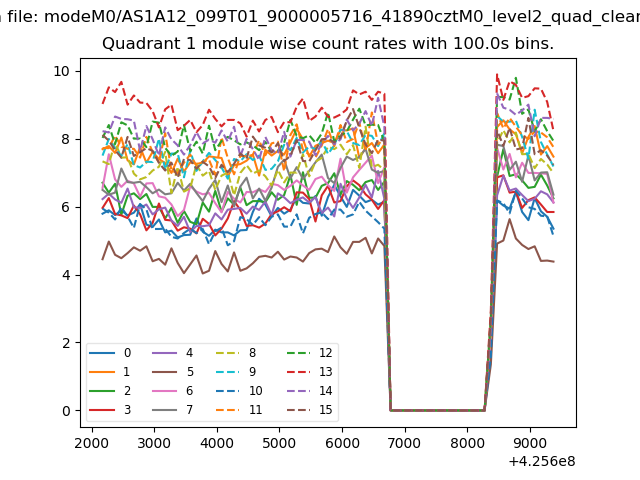
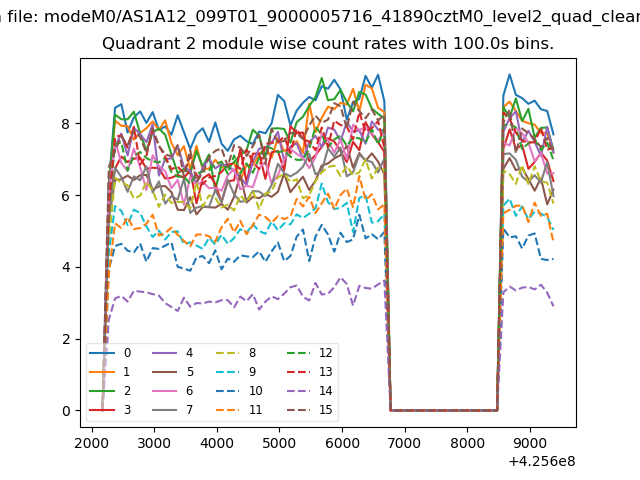
| Quadrant-wise count rates Data is divided into 100 sec bins |
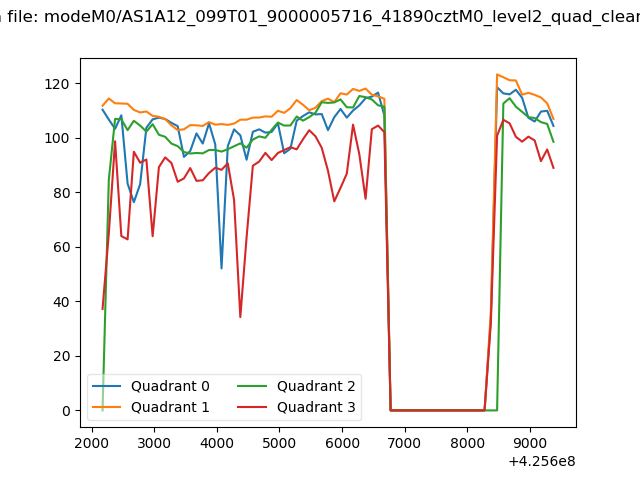 |
|
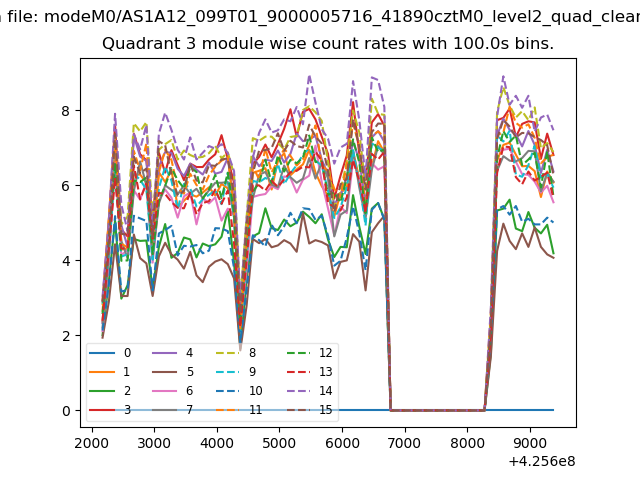
| Module-wise count rates for Quadrant A Data is divided into 100 sec bins |
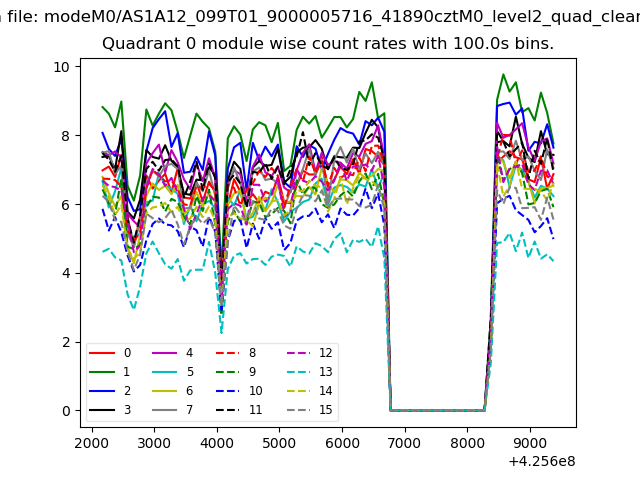 |
 |
| Module-wise count rates for Quadrant B Data is divided into 100 sec bins |
 |
 |
| Module-wise count rates for Quadrant C Data is divided into 100 sec bins |
 |
 |
| Module-wise count rates for Quadrant D Data is divided into 100 sec bins |
 |
 |
| Parameter | Plot |
|---|---|
| CZT HV Monitor | 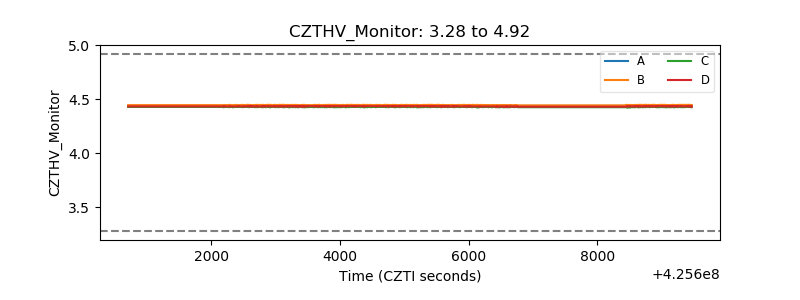 |
| D_VDD | 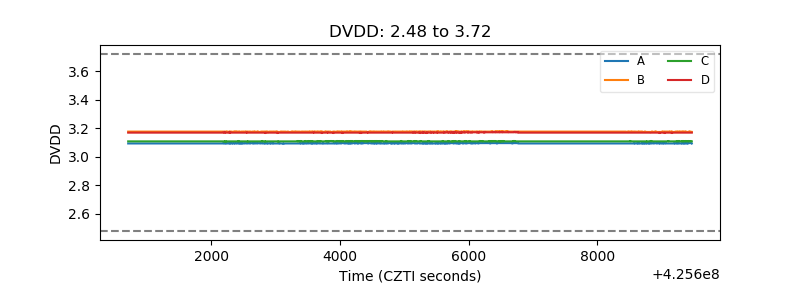 |
| Temperature 1 | 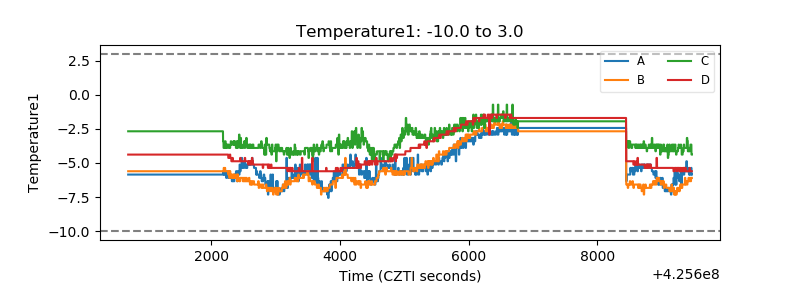 |
| Veto HV Monitor | 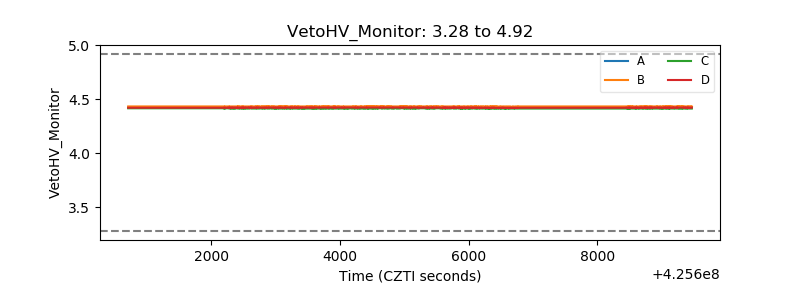 |
| Veto LLD | 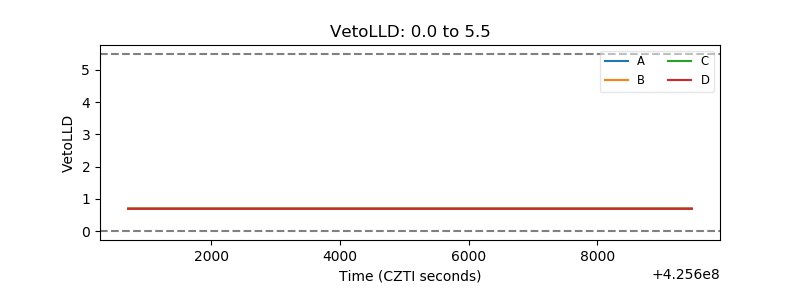 |
| Alpha Counter | 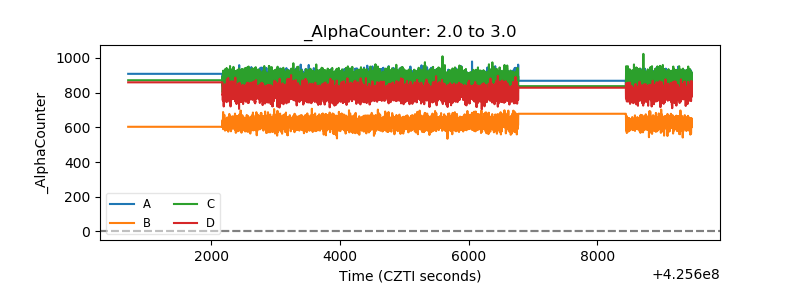 |
| _CPM_Rate |  |
| CZT Counter | 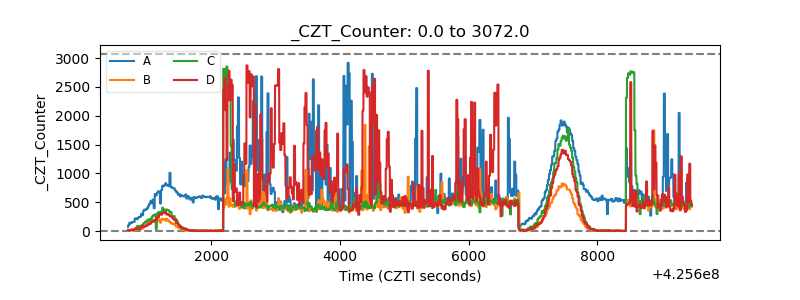 |
| +2.5 Volts monitor | 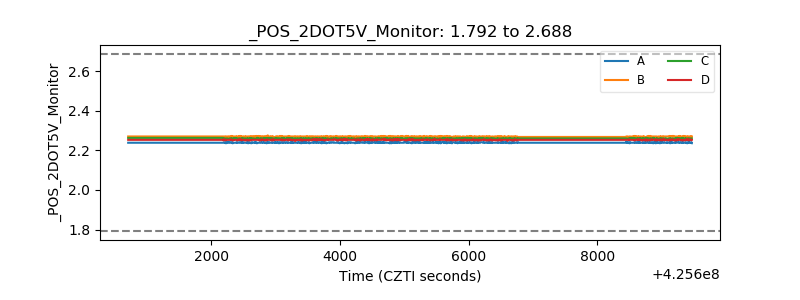 |
| +5 Volts monitor |  |
| _ROLL_ROT | 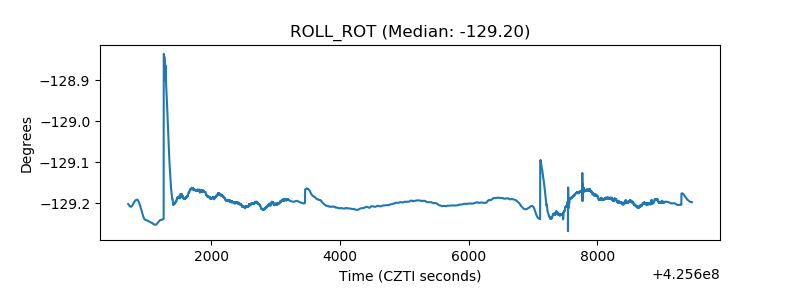 |
| _Roll_DEC | 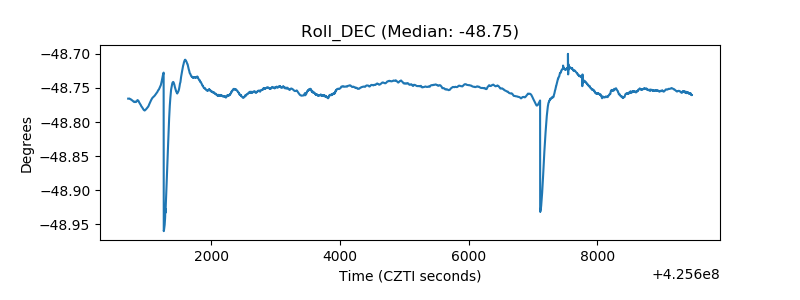 |
| _Roll_RA | 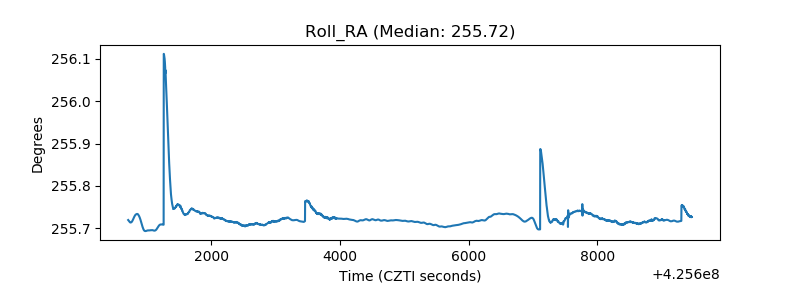 |
| Veto Counter | 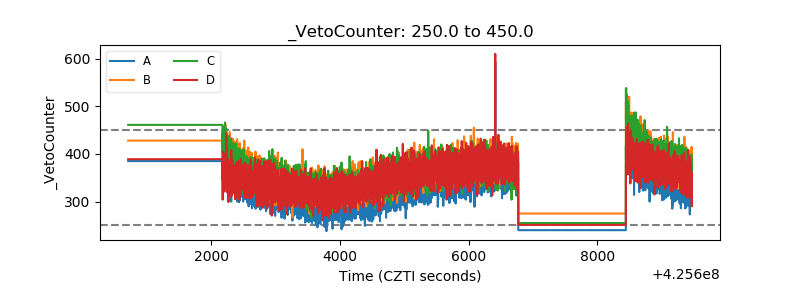 |