| Param | Original file | Final file |
|---|---|---|
| Filename | modeM0/AS1A12_099T01_9000005716_41892cztM0_level2.fits | modeM0/AS1A12_099T01_9000005716_41892cztM0_level2_quad_clean.evt |
| Size (bytes) | 350,277,120 | 88,315,200 |
| Size | 334.1 MB | 84.2 MB |
| Events in quadrant A | 3,209,131 | 599,588 |
| Events in quadrant B | 2,544,841 | 620,970 |
| Events in quadrant C | 3,190,696 | 555,796 |
| Events in quadrant D | 3,603,746 | 522,602 |
| Mode M9 | |||
|---|---|---|---|
| Quadrant | BADHDUFLAG | Total packets | Discarded packets |
| A | 0 | 29 | 0 |
| B | 0 | 29 | 0 |
| C | 0 | 30 | 0 |
| D | 0 | 30 | 0 |
| Mode M0 | |||
|---|---|---|---|
| Quadrant | BADHDUFLAG | Total packets | Discarded packets |
| A | 0 | 12900 | 2 |
| B | 0 | 11309 | 2 |
| C | 0 | 12757 | 2 |
| D | 0 | 14499 | 4 |
| Mode SS | |||
|---|---|---|---|
| Quadrant | BADHDUFLAG | Total packets | Discarded packets |
| A | 0 | 108 | 0 |
| B | 0 | 108 | 0 |
| C | 0 | 108 | 0 |
| D | 0 | 108 | 0 |
| Quadrant | Total seconds | Saturated seconds | Saturation percentage |
|---|---|---|---|
| A | 5363 | 51 | 0.950960% |
| B | 5363 | 53 | 0.988253% |
| C | 5363 | 274 | 5.109081% |
| D | 5362 | 251 | 4.681089% |
Noise dominated data is calculated using 1-second bins in cleaned event files. If a bin has >2000 counts, and if more than 50% of those come from <1% of pixels, then it is considered to be noise-dominated and hence unusable.
| Quadrant | # 1 sec bins | Bins with >0 counts | Bins with >2000 counts | High rate bins dominated by noise | Noise dominated (total time) | Noise dominated (detector-on time) | Marked lightcurve |
|---|---|---|---|---|---|---|---|
| A | 7186 | 5364 | 40 | 40 | 0.56% | 0.75% | 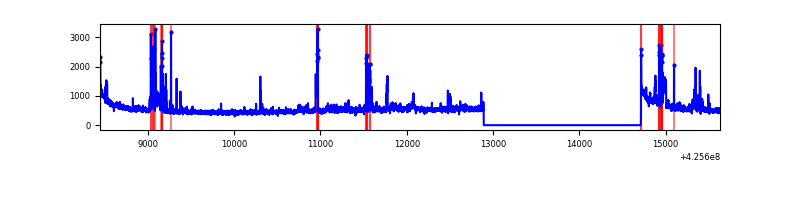 |
| B | 7186 | 5364 | 24 | 24 | 0.33% | 0.45% | 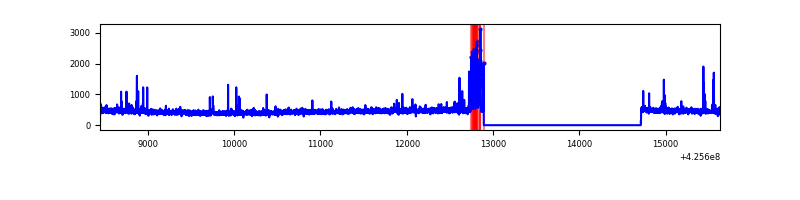 |
| C | 7186 | 5364 | 262 | 262 | 3.65% | 4.88% | 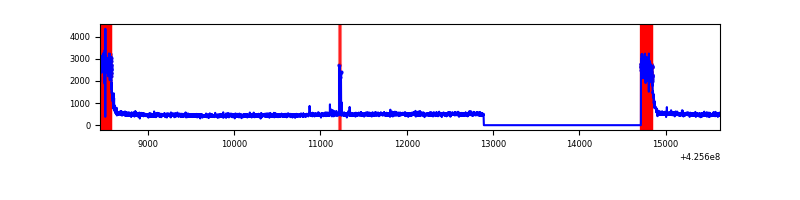 |
| D | 7185 | 5363 | 206 | 206 | 2.87% | 3.84% | 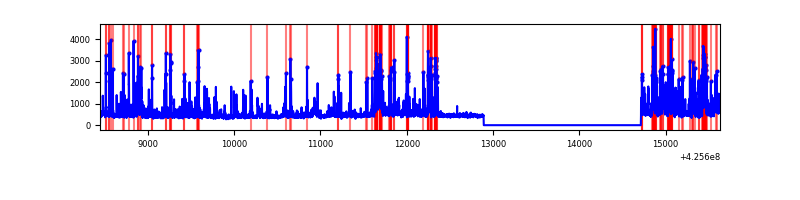 |
Top three noisy pixels from each quadrant. If the there are fewer than three noisy pixels in the level2.evt file, extra rows are filled as -1
| Pixel properties | Quadrant properties | ||||||
|---|---|---|---|---|---|---|---|
| Quadrant | DetID | PixID | Counts | Sigma | Mean | Median | Sigma |
| A | 10 | 83 | 520938 | 4304.01 | 584 | 571 | 120.9 |
| A | 14 | 24 | 400393 | 3306.97 | 584 | 571 | 120.9 |
| A | 2 | 79 | 21432 | 172.54 | 584 | 571 | 120.9 |
| B | 5 | 255 | 188408 | 1686.59 | 586 | 572 | 111.4 |
| B | 0 | 190 | 24639 | 216.1 | 586 | 572 | 111.4 |
| B | 12 | 111 | 14379 | 123.97 | 586 | 572 | 111.4 |
| C | 0 | 10 | 775262 | 5906.65 | 560 | 563 | 131.2 |
| C | 15 | 214 | 211725 | 1609.99 | 560 | 563 | 131.2 |
| C | 14 | 254 | 18571 | 137.3 | 560 | 563 | 131.2 |
| D | 13 | 249 | 621100 | 4487.61 | 562 | 545 | 138.3 |
| D | 12 | 6 | 340953 | 2461.69 | 562 | 545 | 138.3 |
| D | 5 | 222 | 241578 | 1743.05 | 562 | 545 | 138.3 |
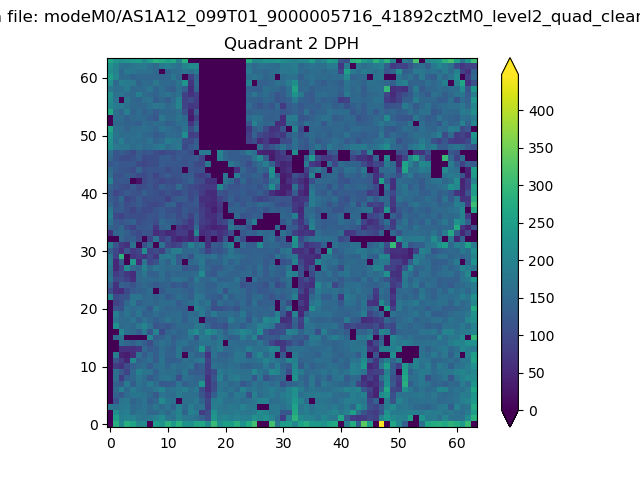
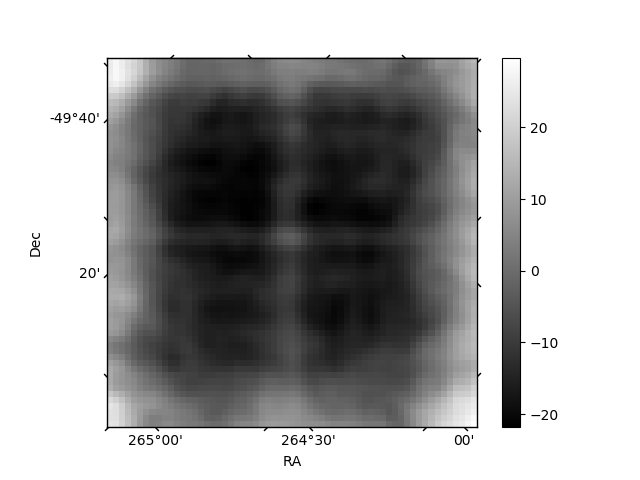
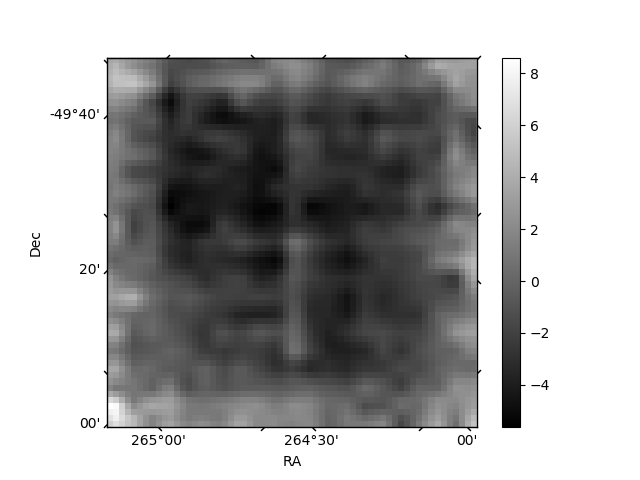
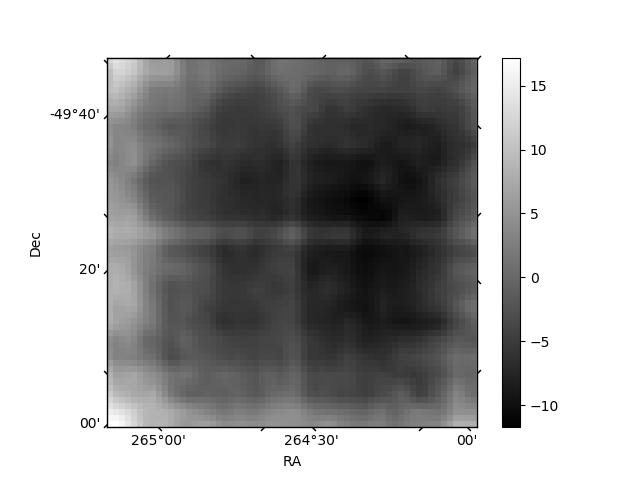
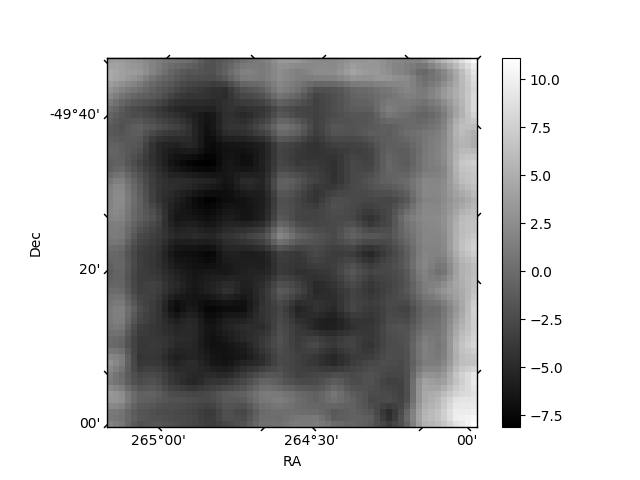
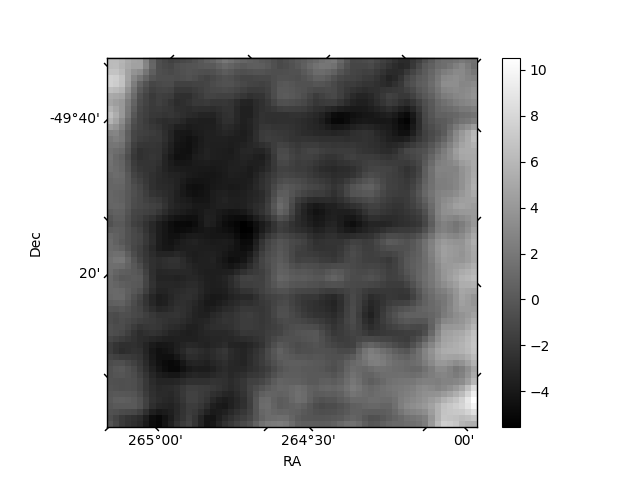
Histogram calculated using DETX and DETY for each event in the final _common_clean file
| Quadrant A | 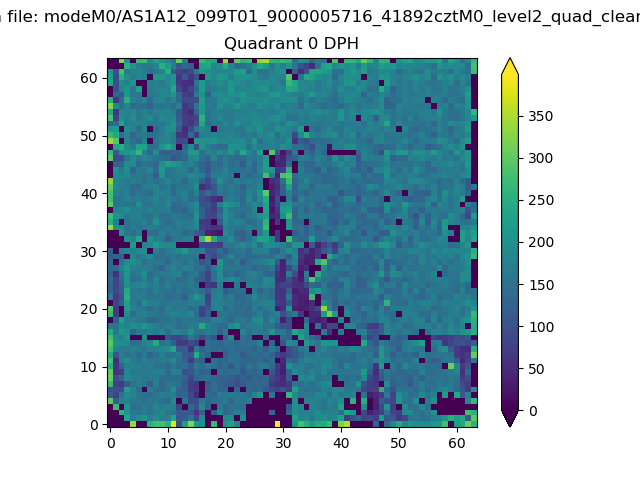 |
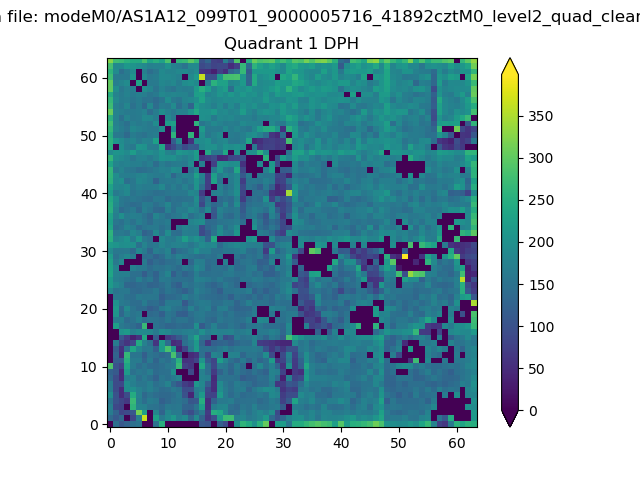 |
Quadrant B |
|---|---|---|---|
| Quadrant D | 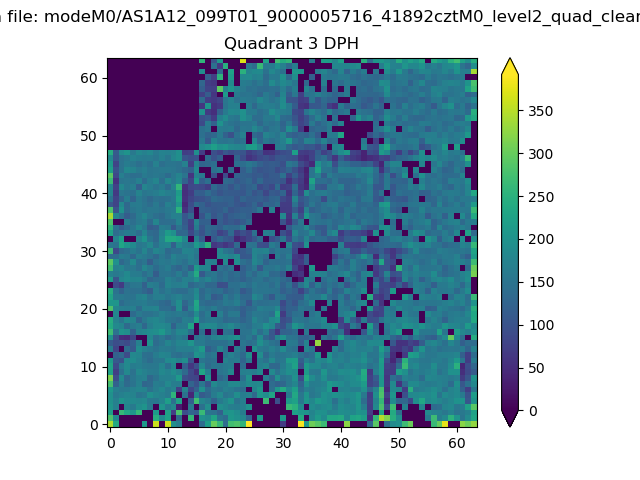 |
 |
Quadrant C |
| Plot type | Count rate plots | Images |
|---|---|---|
| Comparison with Poisson distribution Blue bars denote a histogram of data divided into 1 sec bins. Red curve is a Poisson curve with rate = median count rate of data. |
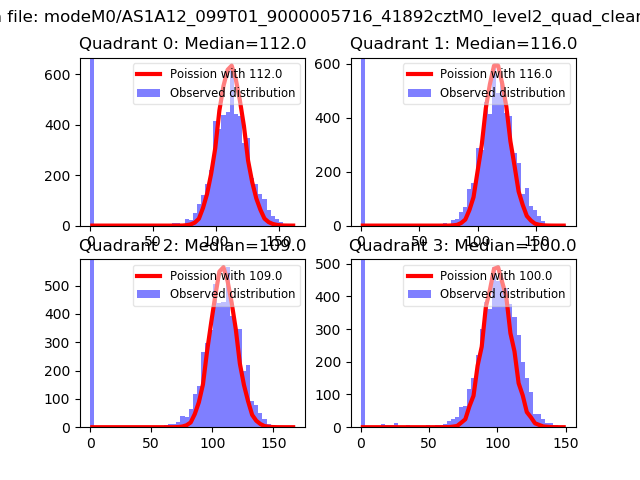 |
 |
| Quadrant-wise count rates Data is divided into 100 sec bins |
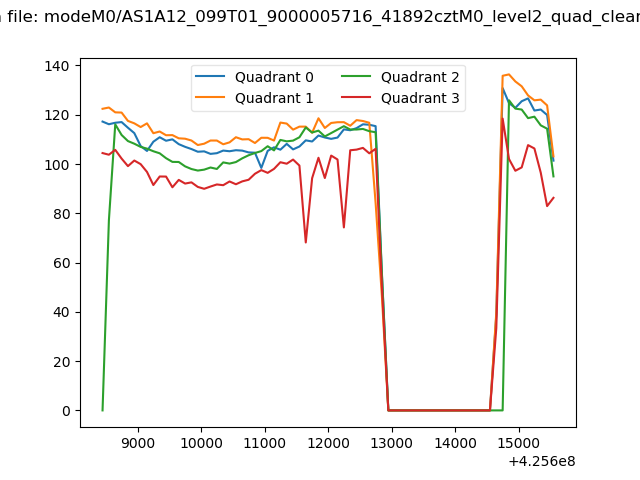 |
|
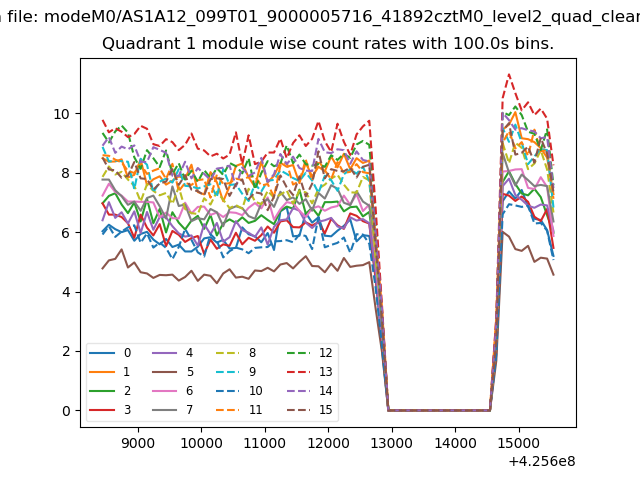
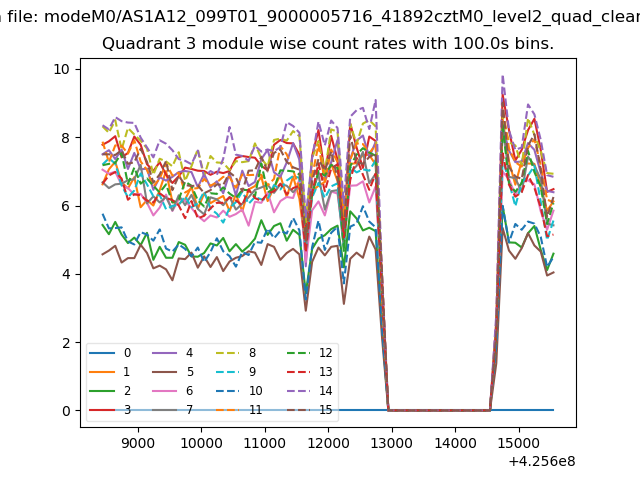
| Module-wise count rates for Quadrant A Data is divided into 100 sec bins |
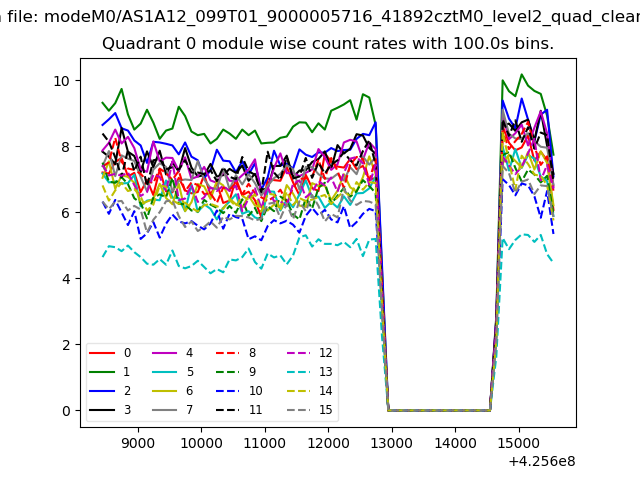 |
 |
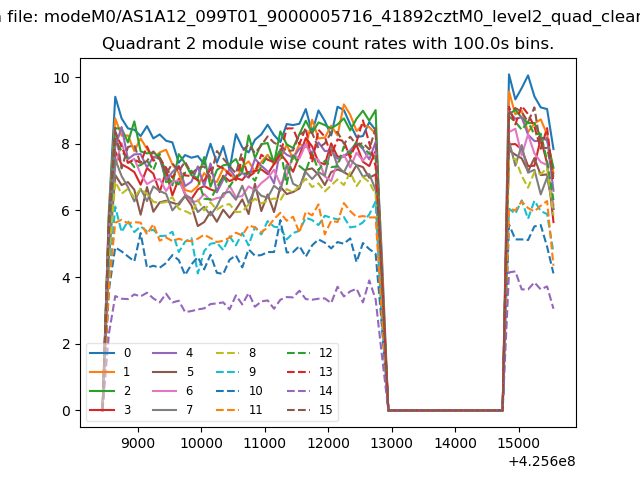
| Module-wise count rates for Quadrant B Data is divided into 100 sec bins |
 |
 |
| Module-wise count rates for Quadrant C Data is divided into 100 sec bins |
 |
 |
| Module-wise count rates for Quadrant D Data is divided into 100 sec bins |
 |
 |
| Parameter | Plot |
|---|---|
| CZT HV Monitor | 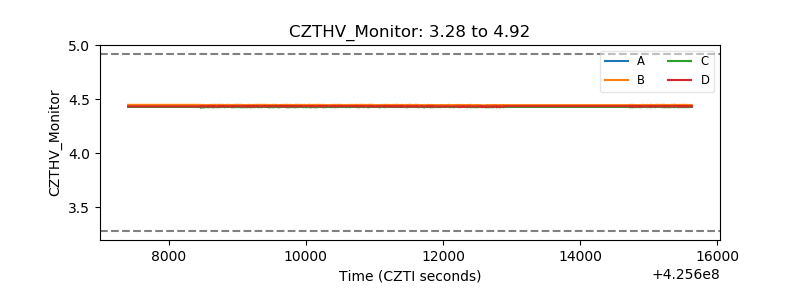 |
| D_VDD | 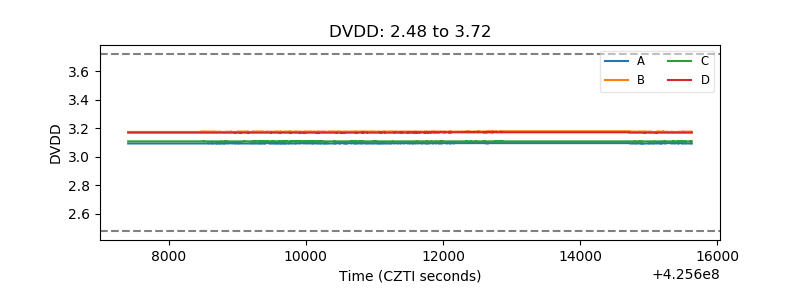 |
| Temperature 1 | 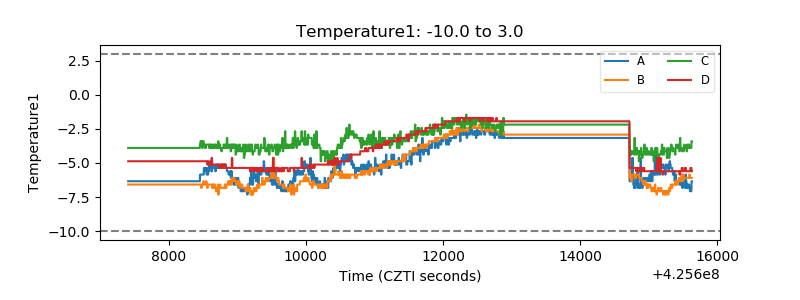 |
| Veto HV Monitor | 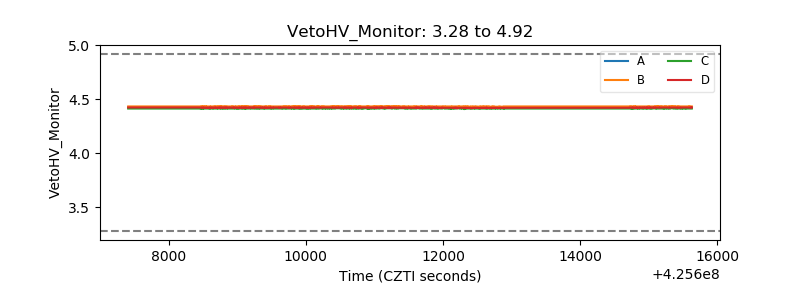 |
| Veto LLD | 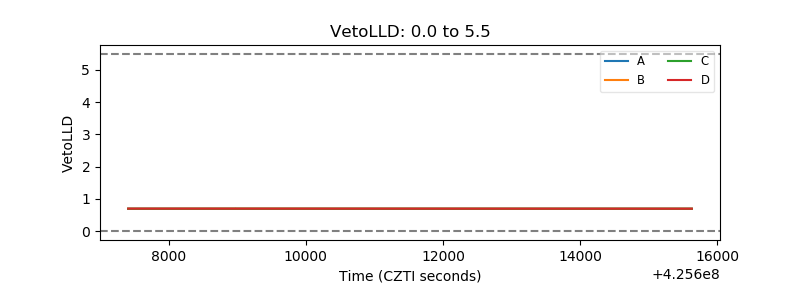 |
| Alpha Counter | 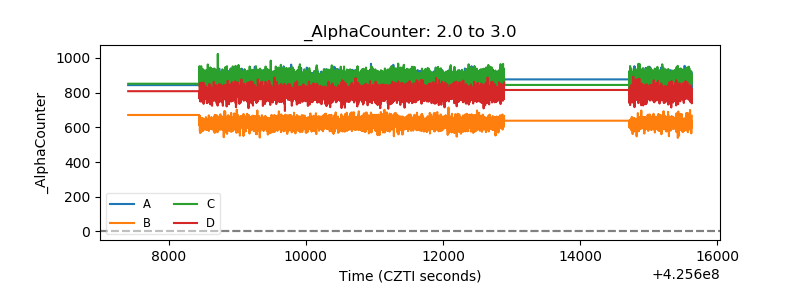 |
| _CPM_Rate | 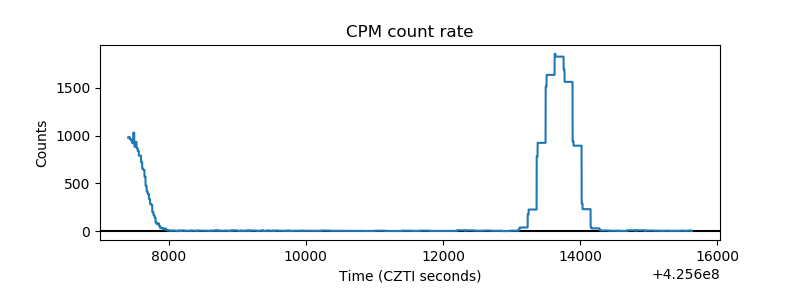 |
| CZT Counter | 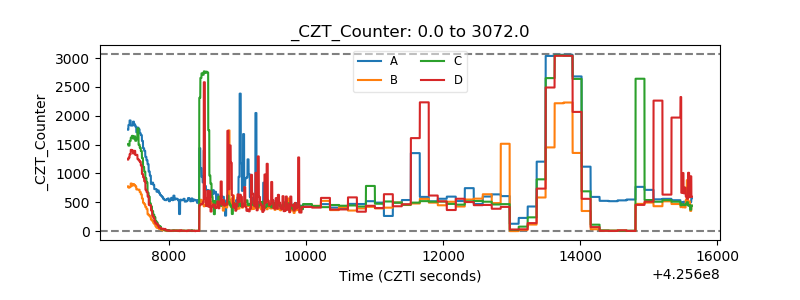 |
| +2.5 Volts monitor |  |
| +5 Volts monitor | 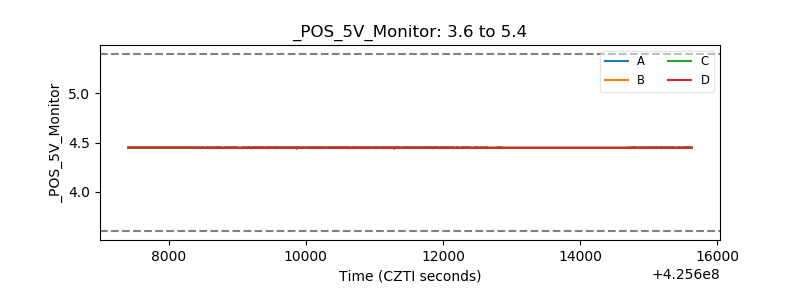 |
| _ROLL_ROT | 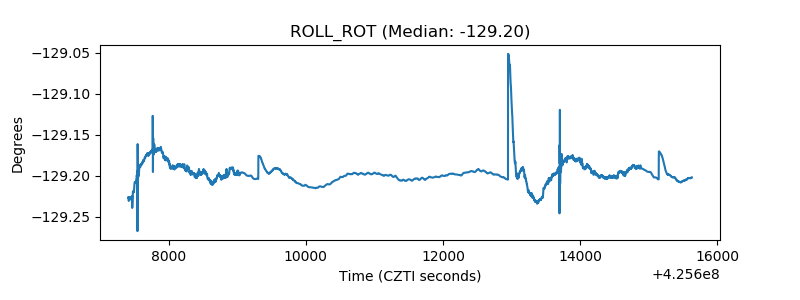 |
| _Roll_DEC |  |
| _Roll_RA | 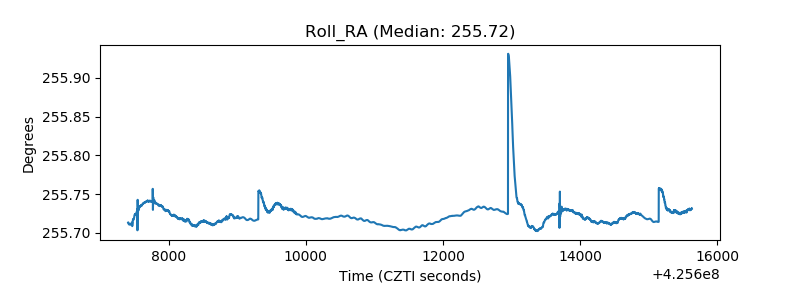 |
| Veto Counter | 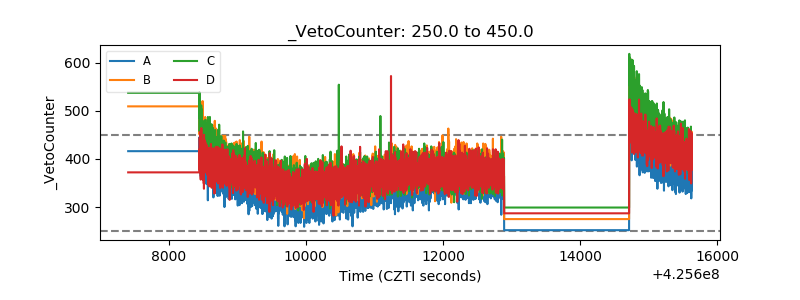 |