| Param | Original file | Final file |
|---|---|---|
| Filename | modeM0/AS1A12_099T01_9000005716_41893cztM0_level2.fits | modeM0/AS1A12_099T01_9000005716_41893cztM0_level2_quad_clean.evt |
| Size (bytes) | 388,981,440 | 91,028,160 |
| Size | 371.0 MB | 86.8 MB |
| Events in quadrant A | 4,013,473 | 615,349 |
| Events in quadrant B | 3,032,154 | 637,471 |
| Events in quadrant C | 3,236,262 | 584,829 |
| Events in quadrant D | 3,705,512 | 548,460 |
| Mode M9 | |||
|---|---|---|---|
| Quadrant | BADHDUFLAG | Total packets | Discarded packets |
| A | 0 | 22 | 0 |
| B | 0 | 22 | 0 |
| C | 0 | 23 | 0 |
| D | 0 | 23 | 0 |
| Mode M0 | |||
|---|---|---|---|
| Quadrant | BADHDUFLAG | Total packets | Discarded packets |
| A | 0 | 15351 | 2 |
| B | 0 | 12445 | 2 |
| C | 0 | 12632 | 2 |
| D | 0 | 14548 | 2 |
| Mode SS | |||
|---|---|---|---|
| Quadrant | BADHDUFLAG | Total packets | Discarded packets |
| A | 0 | 108 | 0 |
| B | 0 | 108 | 0 |
| C | 0 | 108 | 0 |
| D | 0 | 108 | 0 |
| Quadrant | Total seconds | Saturated seconds | Saturation percentage |
|---|---|---|---|
| A | 5288 | 165 | 3.120272% |
| B | 5288 | 195 | 3.687595% |
| C | 5288 | 276 | 5.219365% |
| D | 5288 | 238 | 4.500756% |
Noise dominated data is calculated using 1-second bins in cleaned event files. If a bin has >2000 counts, and if more than 50% of those come from <1% of pixels, then it is considered to be noise-dominated and hence unusable.
| Quadrant | # 1 sec bins | Bins with >0 counts | Bins with >2000 counts | High rate bins dominated by noise | Noise dominated (total time) | Noise dominated (detector-on time) | Marked lightcurve |
|---|---|---|---|---|---|---|---|
| A | 7230 | 5289 | 144 | 144 | 1.99% | 2.72% | 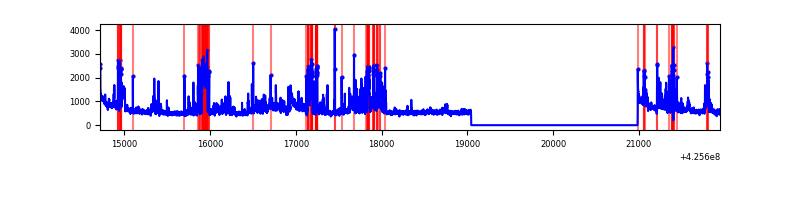 |
| B | 7230 | 5289 | 133 | 133 | 1.84% | 2.51% | 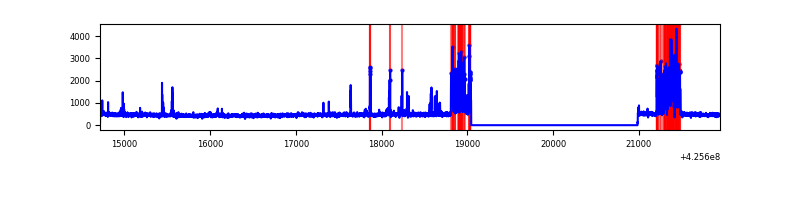 |
| C | 7230 | 5289 | 261 | 261 | 3.61% | 4.93% | 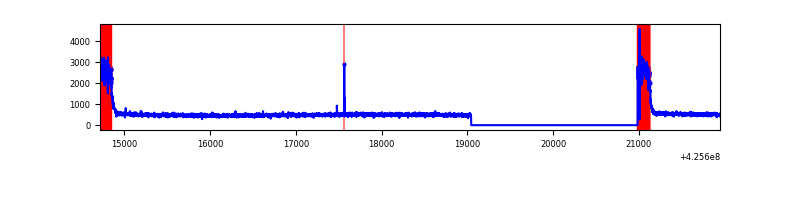 |
| D | 7230 | 5289 | 204 | 204 | 2.82% | 3.86% | 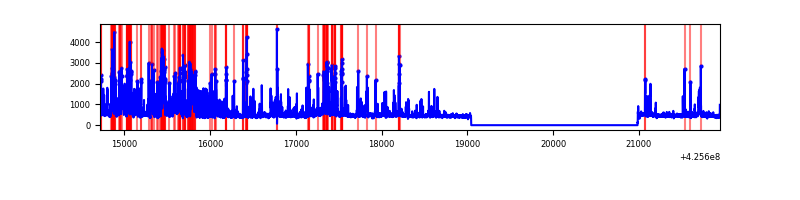 |
Top three noisy pixels from each quadrant. If the there are fewer than three noisy pixels in the level2.evt file, extra rows are filled as -1
| Pixel properties | Quadrant properties | ||||||
|---|---|---|---|---|---|---|---|
| Quadrant | DetID | PixID | Counts | Sigma | Mean | Median | Sigma |
| A | 14 | 24 | 1156111 | 9558.6 | 595 | 583 | 120.9 |
| A | 10 | 83 | 526142 | 4347.46 | 595 | 583 | 120.9 |
| A | 2 | 79 | 16191 | 129.11 | 595 | 583 | 120.9 |
| B | 5 | 255 | 616076 | 5384.0 | 595 | 580 | 114.3 |
| B | 7 | 202 | 36343 | 312.83 | 595 | 580 | 114.3 |
| B | 0 | 190 | 34157 | 293.71 | 595 | 580 | 114.3 |
| C | 0 | 10 | 768948 | 5702.79 | 576 | 580 | 134.7 |
| C | 15 | 214 | 207922 | 1538.88 | 576 | 580 | 134.7 |
| C | 14 | 254 | 9265 | 64.46 | 576 | 580 | 134.7 |
| D | 5 | 222 | 442852 | 3148.17 | 579 | 564 | 140.5 |
| D | 13 | 249 | 436565 | 3103.42 | 579 | 564 | 140.5 |
| D | 12 | 6 | 239123 | 1698.04 | 579 | 564 | 140.5 |
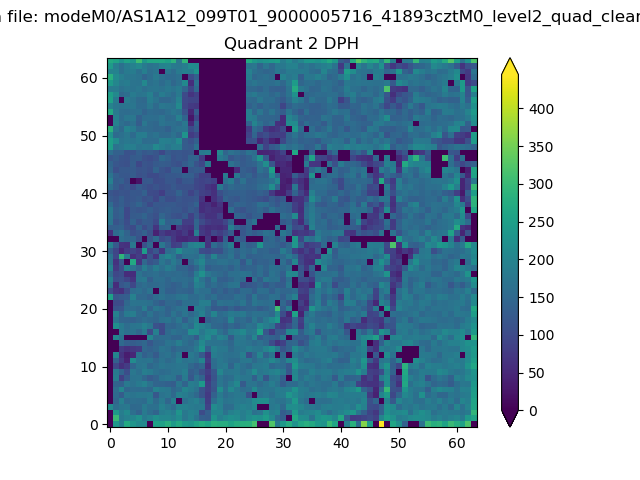
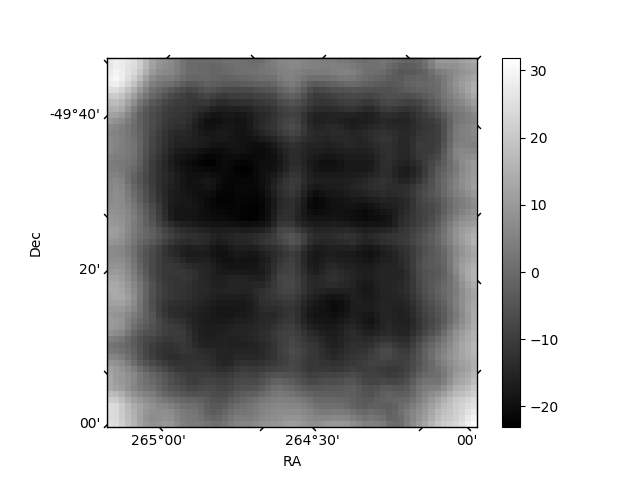
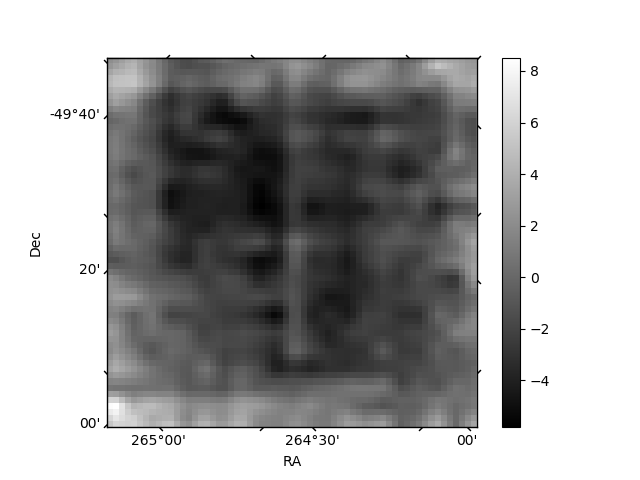
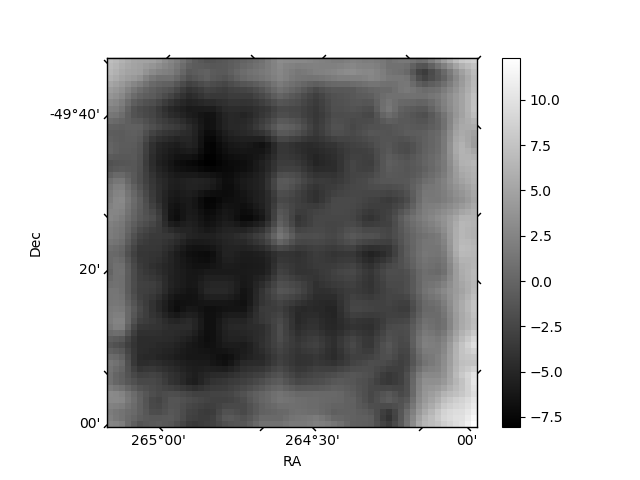
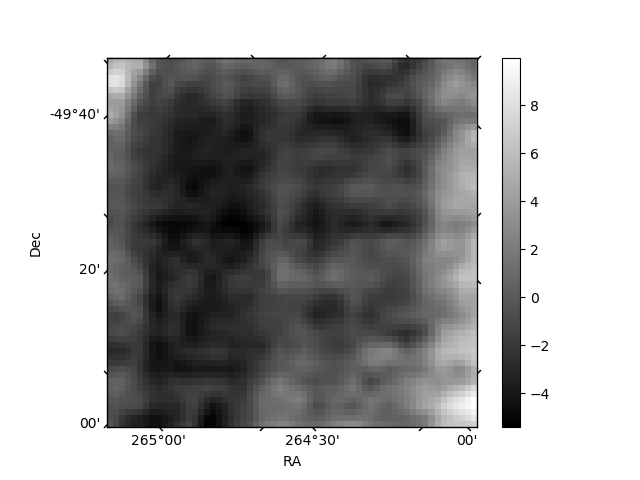
Histogram calculated using DETX and DETY for each event in the final _common_clean file
| Quadrant A | 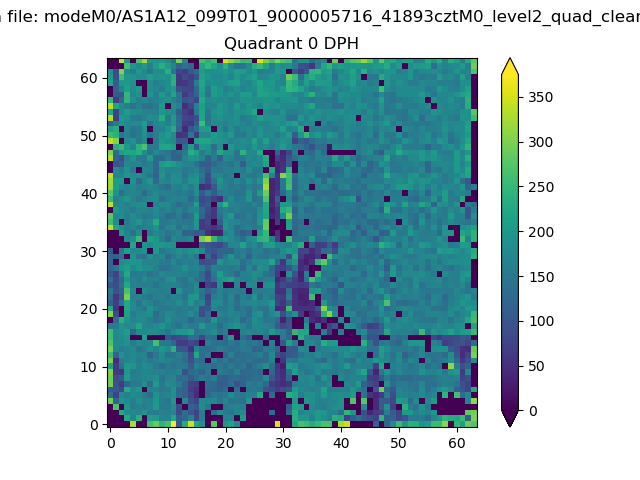 |
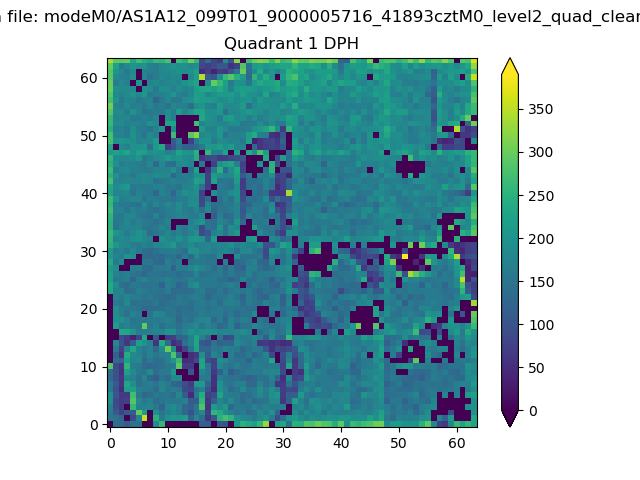 |
Quadrant B |
|---|---|---|---|
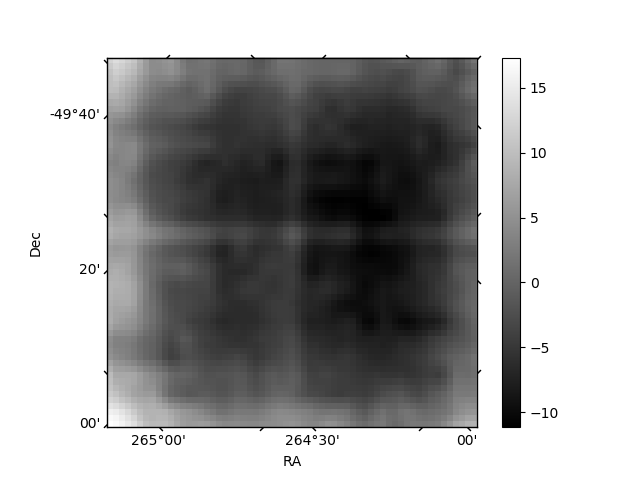
| Quadrant D | 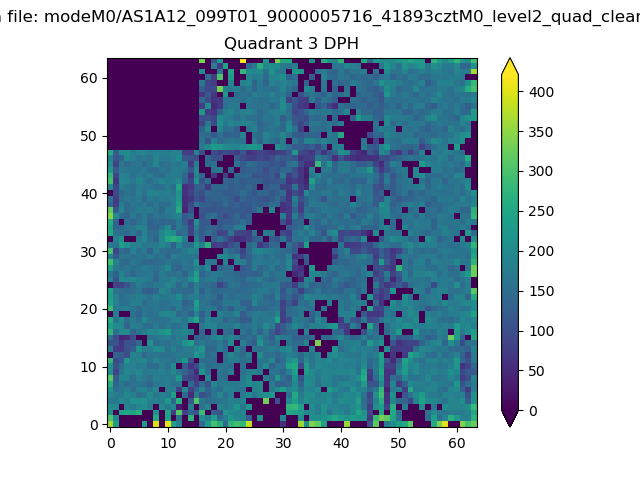 |
 |
Quadrant C |
| Plot type | Count rate plots | Images |
|---|---|---|
| Comparison with Poisson distribution Blue bars denote a histogram of data divided into 1 sec bins. Red curve is a Poisson curve with rate = median count rate of data. |
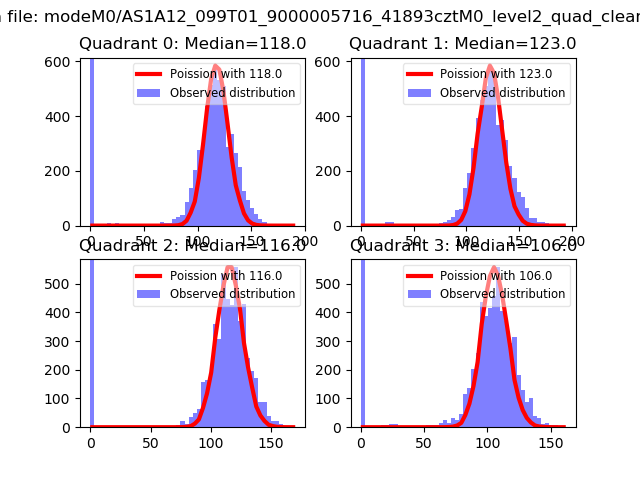 |
 |
| Quadrant-wise count rates Data is divided into 100 sec bins |
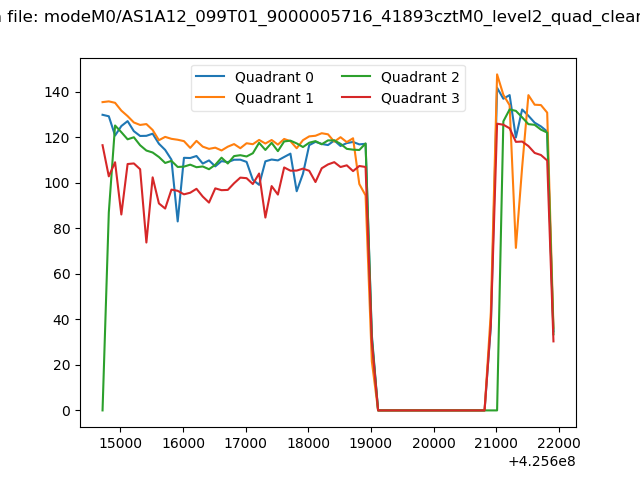 |
|
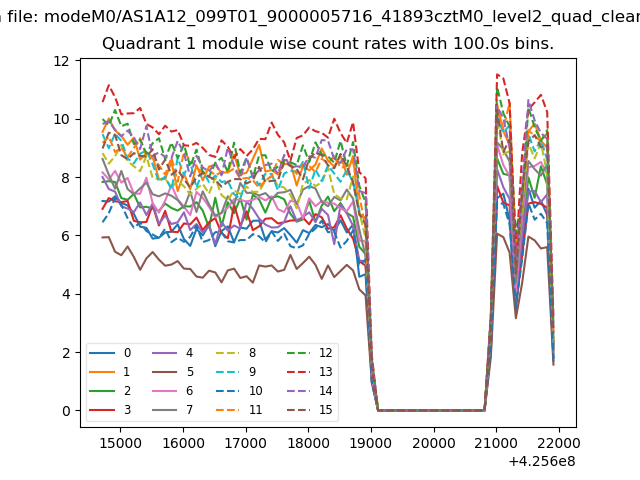
| Module-wise count rates for Quadrant A Data is divided into 100 sec bins |
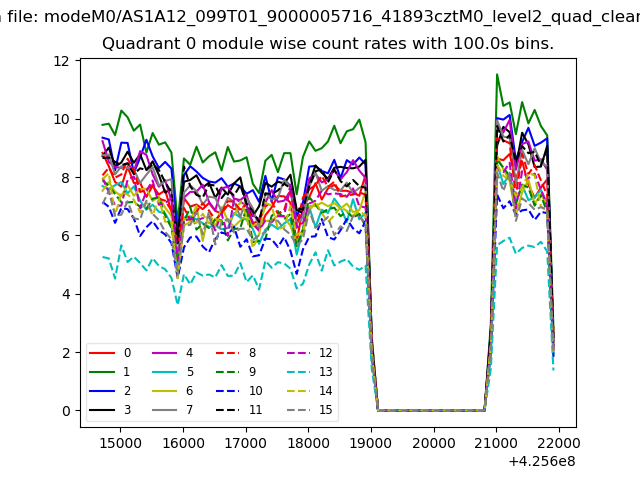 |
 |
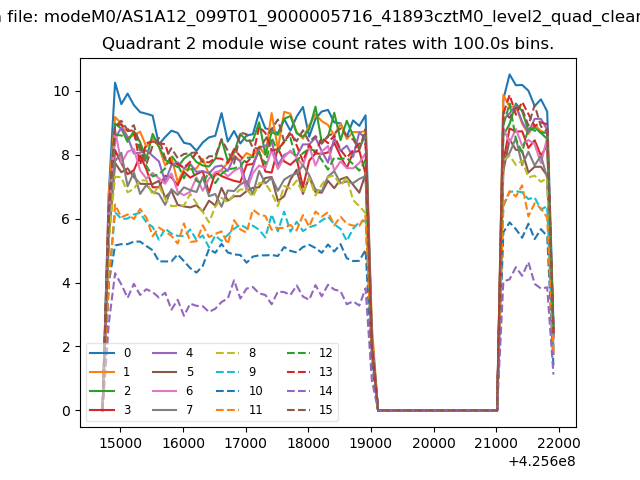
| Module-wise count rates for Quadrant B Data is divided into 100 sec bins |
 |
 |
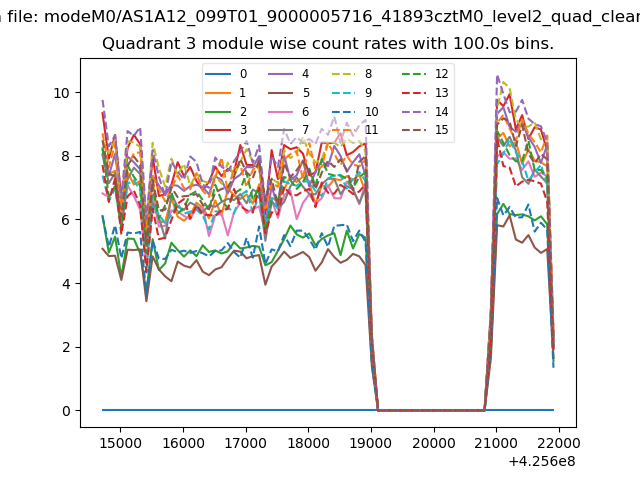
| Module-wise count rates for Quadrant C Data is divided into 100 sec bins |
 |
 |
| Module-wise count rates for Quadrant D Data is divided into 100 sec bins |
 |
 |
| Parameter | Plot |
|---|---|
| CZT HV Monitor | 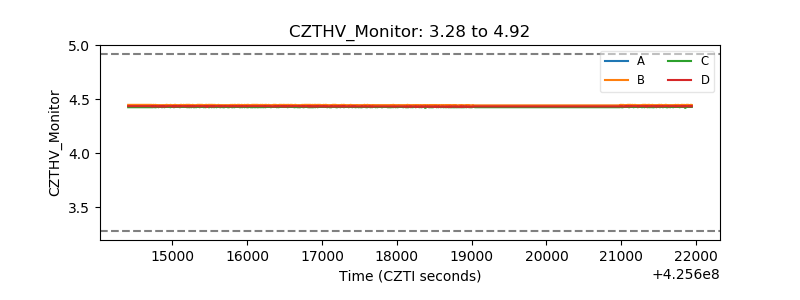 |
| D_VDD | 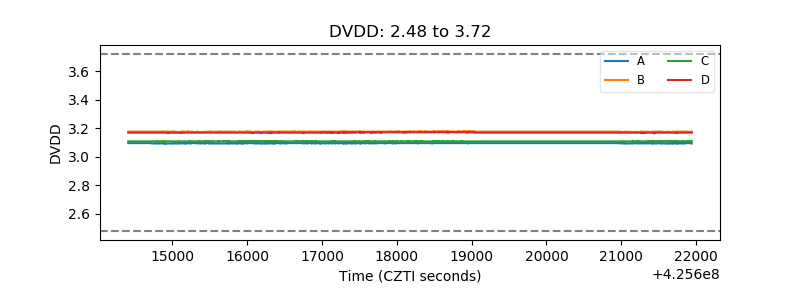 |
| Temperature 1 | 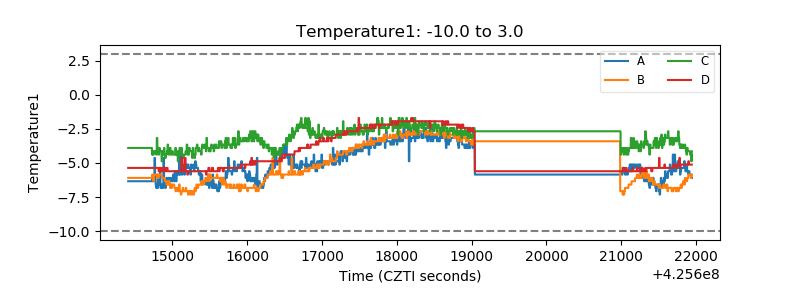 |
| Veto HV Monitor | 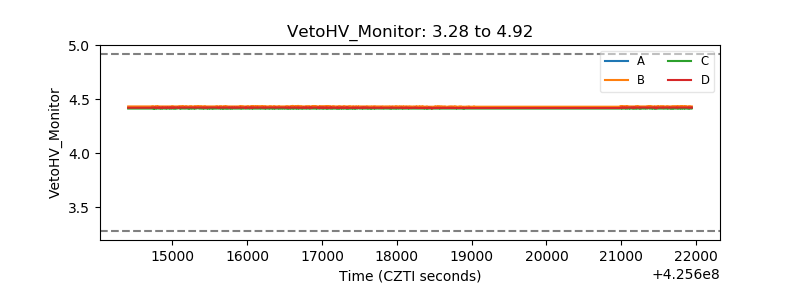 |
| Veto LLD | 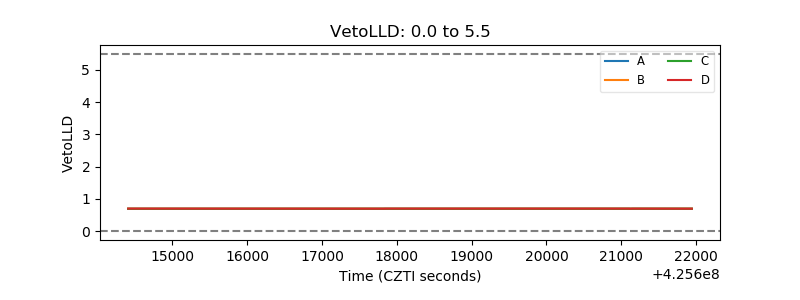 |
| Alpha Counter | 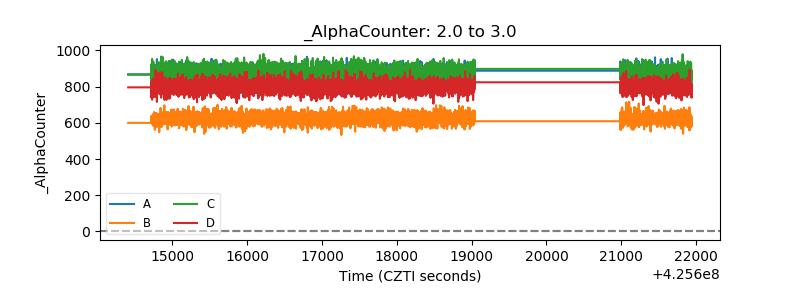 |
| _CPM_Rate | 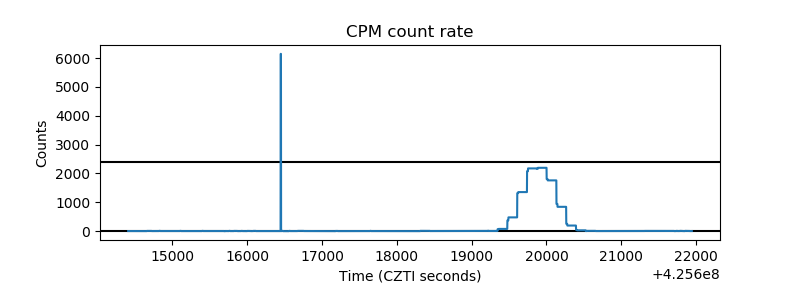 |
| CZT Counter | 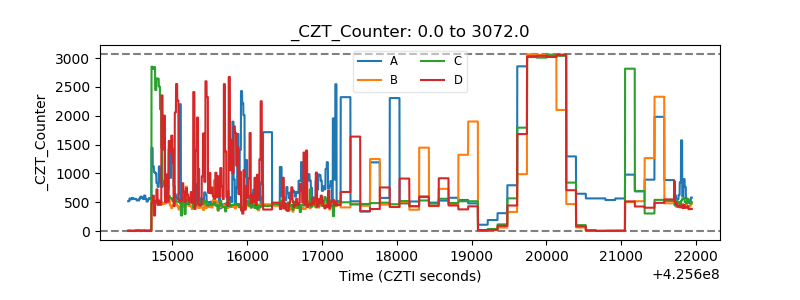 |
| +2.5 Volts monitor | 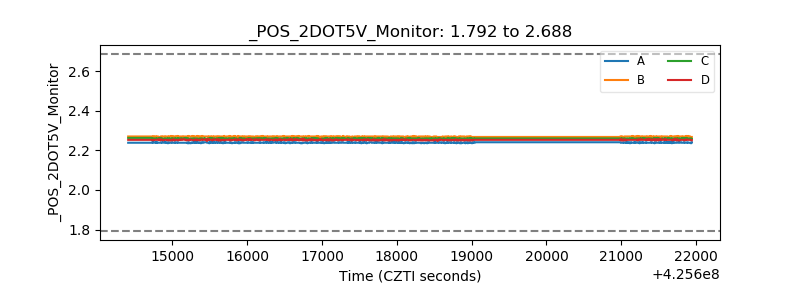 |
| +5 Volts monitor | 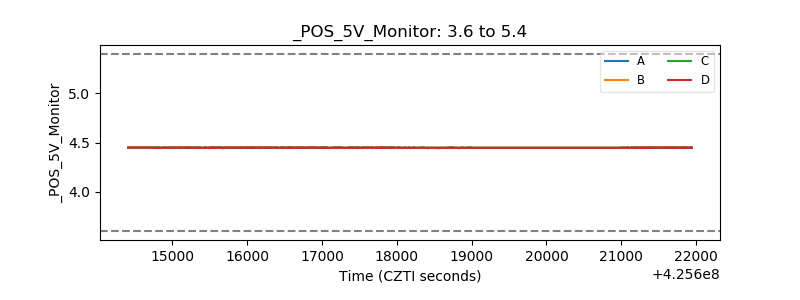 |
| _ROLL_ROT | 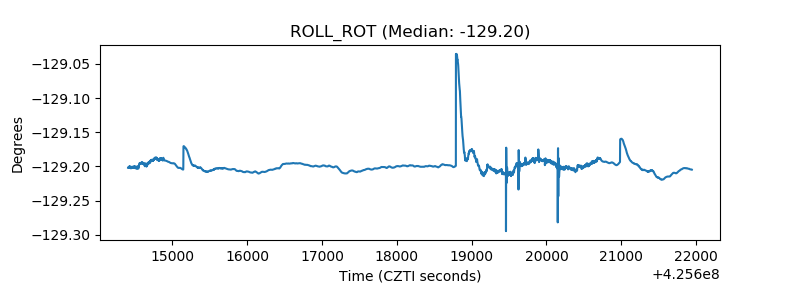 |
| _Roll_DEC | 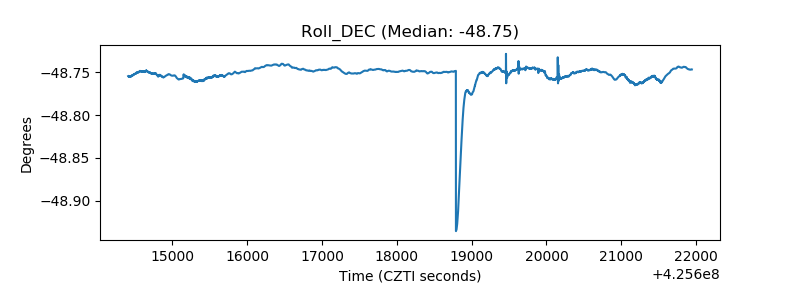 |
| _Roll_RA | 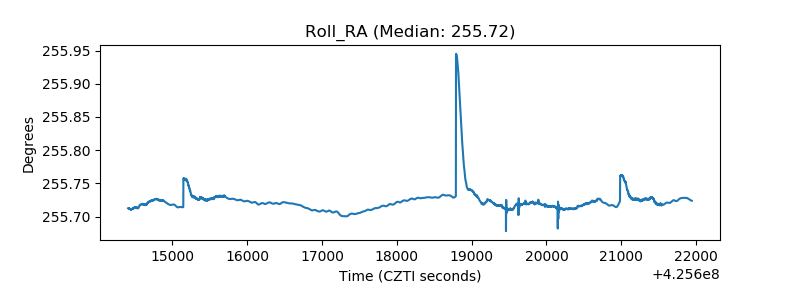 |
| Veto Counter | 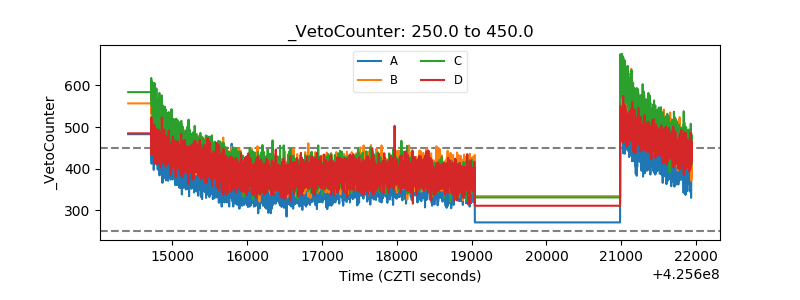 |