| Param | Original file | Final file |
|---|---|---|
| Filename | modeM0/AS1A12_099T01_9000005716_41894cztM0_level2.fits | modeM0/AS1A12_099T01_9000005716_41894cztM0_level2_quad_clean.evt |
| Size (bytes) | 361,212,480 | 88,531,200 |
| Size | 344.5 MB | 84.4 MB |
| Events in quadrant A | 3,195,002 | 609,080 |
| Events in quadrant B | 3,137,614 | 624,477 |
| Events in quadrant C | 3,183,307 | 571,284 |
| Events in quadrant D | 3,468,701 | 528,563 |
| Mode M9 | |||
|---|---|---|---|
| Quadrant | BADHDUFLAG | Total packets | Discarded packets |
| A | 0 | 35 | 0 |
| B | 0 | 35 | 0 |
| C | 0 | 36 | 0 |
| D | 0 | 36 | 0 |
| Mode M0 | |||
|---|---|---|---|
| Quadrant | BADHDUFLAG | Total packets | Discarded packets |
| A | 0 | 12515 | 2 |
| B | 0 | 12514 | 2 |
| C | 0 | 12249 | 2 |
| D | 0 | 13636 | 2 |
| Mode SS | |||
|---|---|---|---|
| Quadrant | BADHDUFLAG | Total packets | Discarded packets |
| A | 0 | 100 | 0 |
| B | 0 | 100 | 0 |
| C | 0 | 100 | 0 |
| D | 0 | 100 | 0 |
| Quadrant | Total seconds | Saturated seconds | Saturation percentage |
|---|---|---|---|
| A | 4959 | 44 | 0.887276% |
| B | 4959 | 202 | 4.073402% |
| C | 4959 | 289 | 5.827788% |
| D | 4959 | 342 | 6.896552% |
Noise dominated data is calculated using 1-second bins in cleaned event files. If a bin has >2000 counts, and if more than 50% of those come from <1% of pixels, then it is considered to be noise-dominated and hence unusable.
| Quadrant | # 1 sec bins | Bins with >0 counts | Bins with >2000 counts | High rate bins dominated by noise | Noise dominated (total time) | Noise dominated (detector-on time) | Marked lightcurve |
|---|---|---|---|---|---|---|---|
| A | 7021 | 4960 | 30 | 30 | 0.43% | 0.60% | 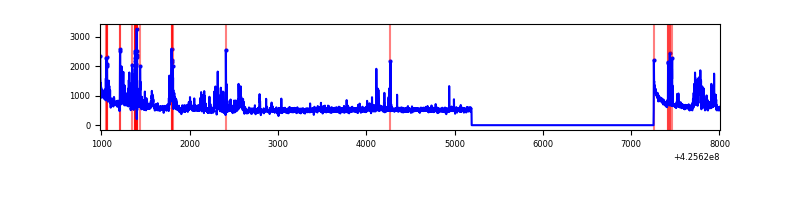 |
| B | 7021 | 4960 | 146 | 146 | 2.08% | 2.94% | 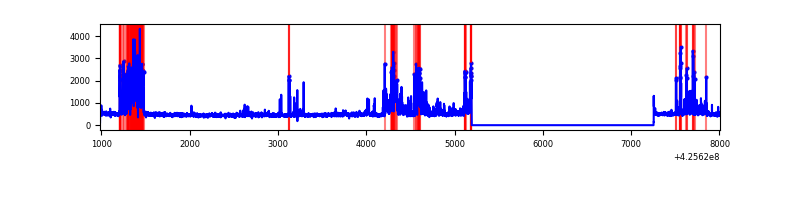 |
| C | 7021 | 4960 | 280 | 280 | 3.99% | 5.65% | 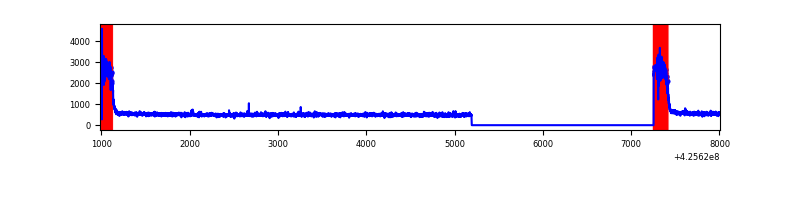 |
| D | 7021 | 4960 | 322 | 322 | 4.59% | 6.49% | 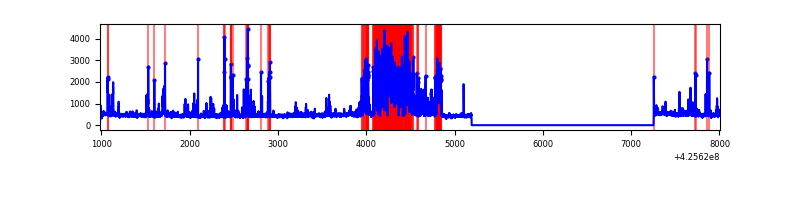 |
Top three noisy pixels from each quadrant. If the there are fewer than three noisy pixels in the level2.evt file, extra rows are filled as -1
| Pixel properties | Quadrant properties | ||||||
|---|---|---|---|---|---|---|---|
| Quadrant | DetID | PixID | Counts | Sigma | Mean | Median | Sigma |
| A | 10 | 83 | 497199 | 4185.39 | 578 | 565 | 118.7 |
| A | 14 | 24 | 455345 | 3832.67 | 578 | 565 | 118.7 |
| A | 2 | 79 | 7240 | 56.25 | 578 | 565 | 118.7 |
| B | 5 | 255 | 805986 | 7425.48 | 573 | 557 | 108.5 |
| B | 0 | 190 | 74374 | 680.54 | 573 | 557 | 108.5 |
| B | 12 | 111 | 13442 | 118.79 | 573 | 557 | 108.5 |
| C | 0 | 10 | 816036 | 6369.26 | 553 | 557 | 128.0 |
| C | 15 | 214 | 192610 | 1500.02 | 553 | 557 | 128.0 |
| C | 0 | 15 | 13011 | 97.27 | 553 | 557 | 128.0 |
| D | 5 | 222 | 974935 | 7205.95 | 556 | 539 | 135.2 |
| D | 12 | 6 | 144583 | 1065.25 | 556 | 539 | 135.2 |
| D | 2 | 249 | 78735 | 578.28 | 556 | 539 | 135.2 |
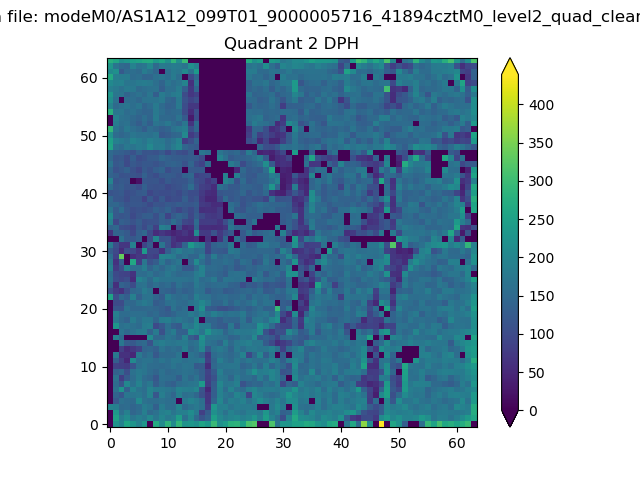
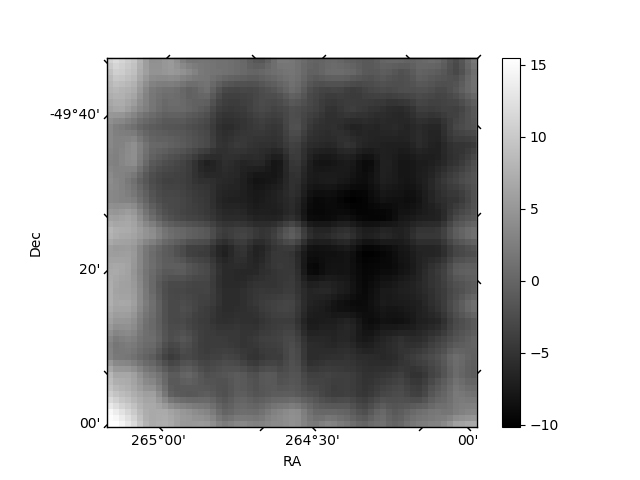
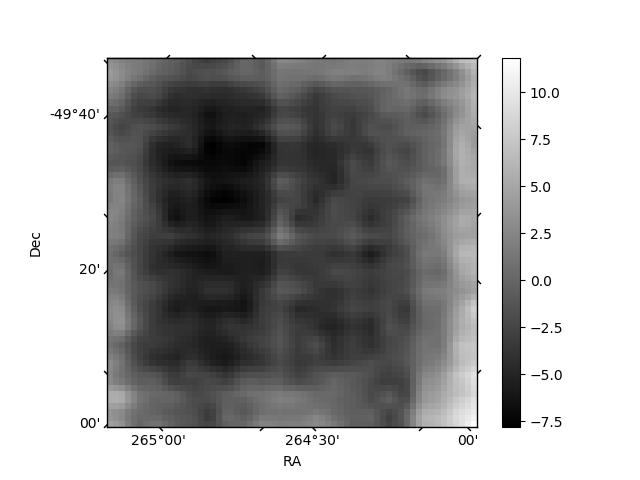
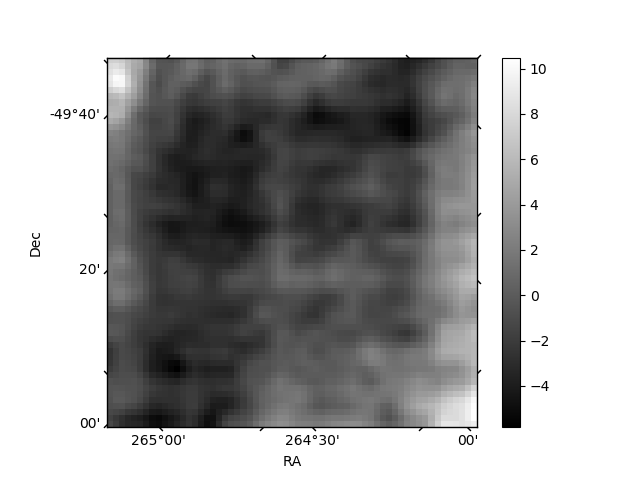
Histogram calculated using DETX and DETY for each event in the final _common_clean file
| Quadrant A | 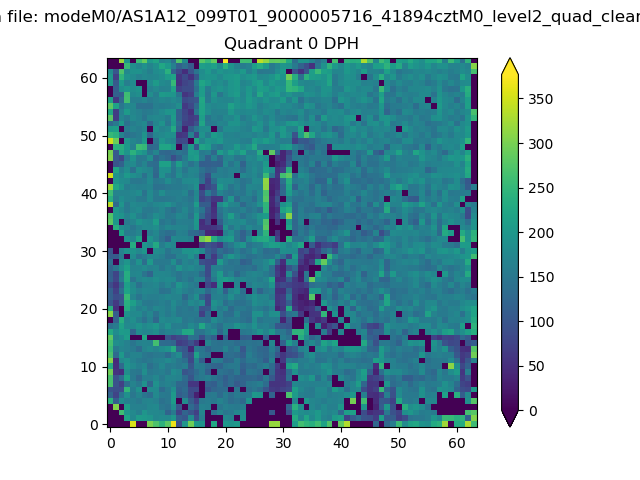 |
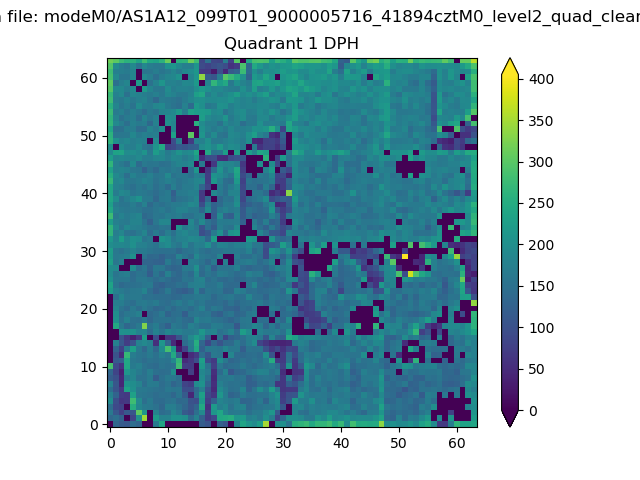 |
Quadrant B |
|---|---|---|---|
| Quadrant D | 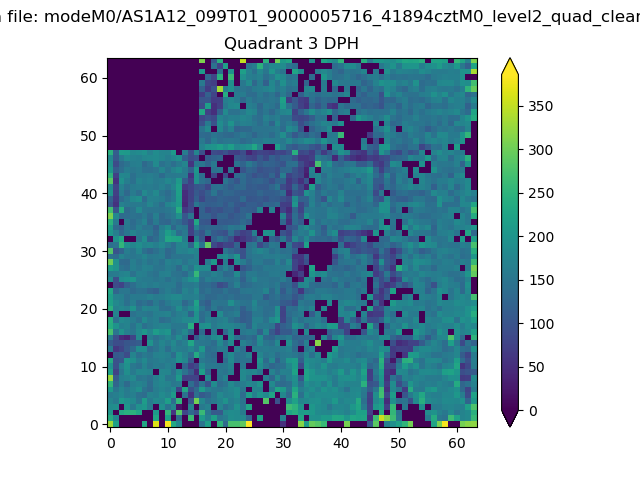 |
 |
Quadrant C |
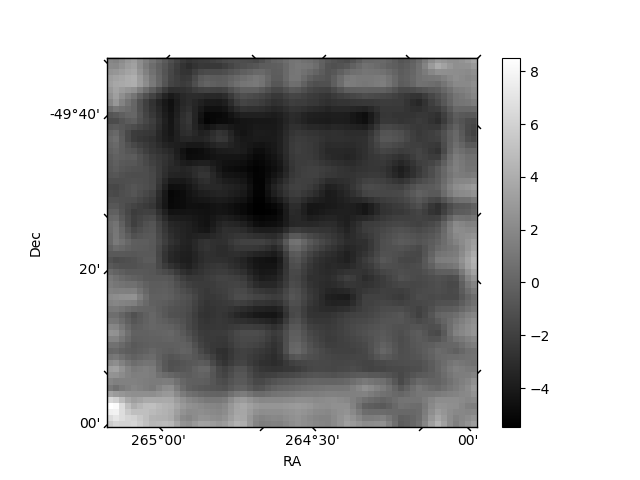
| Plot type | Count rate plots | Images |
|---|---|---|
| Comparison with Poisson distribution Blue bars denote a histogram of data divided into 1 sec bins. Red curve is a Poisson curve with rate = median count rate of data. |
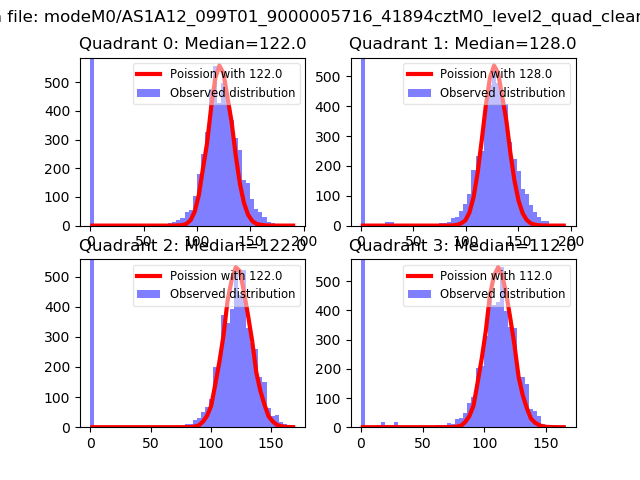 |
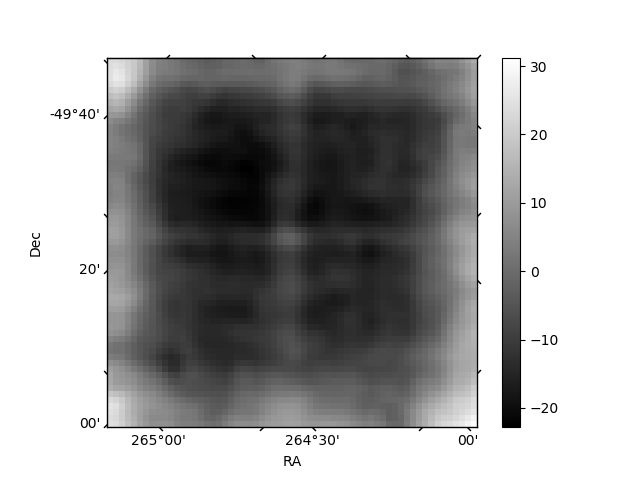 |
| Quadrant-wise count rates Data is divided into 100 sec bins |
 |
|
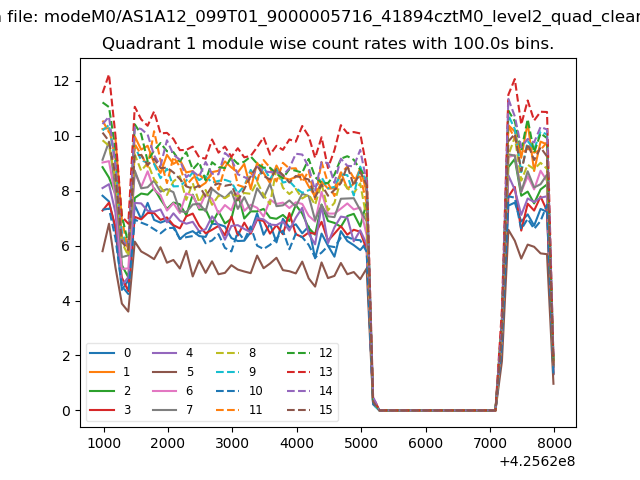
| Module-wise count rates for Quadrant A Data is divided into 100 sec bins |
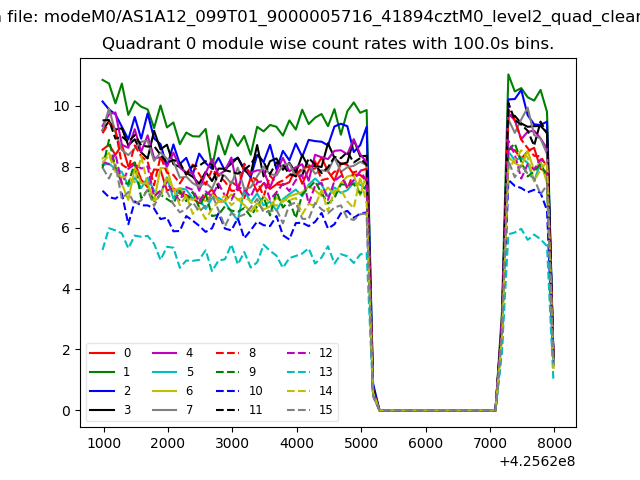 |
 |
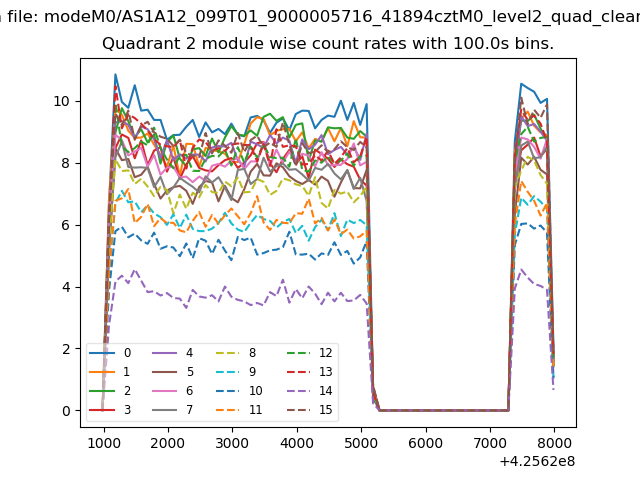
| Module-wise count rates for Quadrant B Data is divided into 100 sec bins |
 |
 |
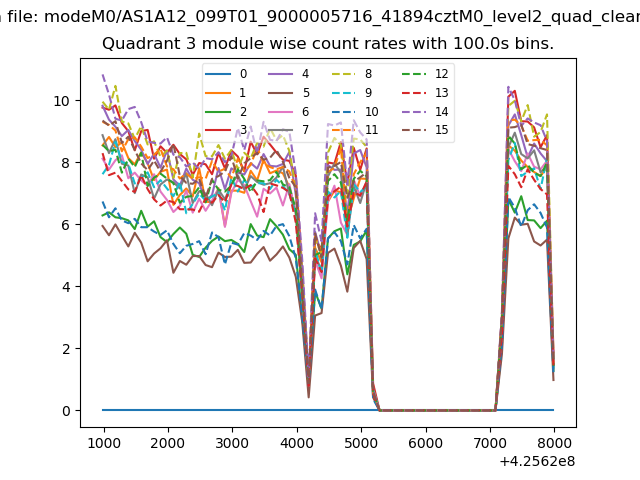
| Module-wise count rates for Quadrant C Data is divided into 100 sec bins |
 |
 |
| Module-wise count rates for Quadrant D Data is divided into 100 sec bins |
 |
 |
| Parameter | Plot |
|---|---|
| CZT HV Monitor | 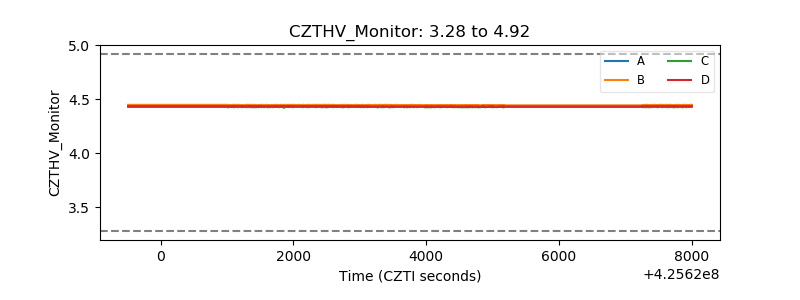 |
| D_VDD | 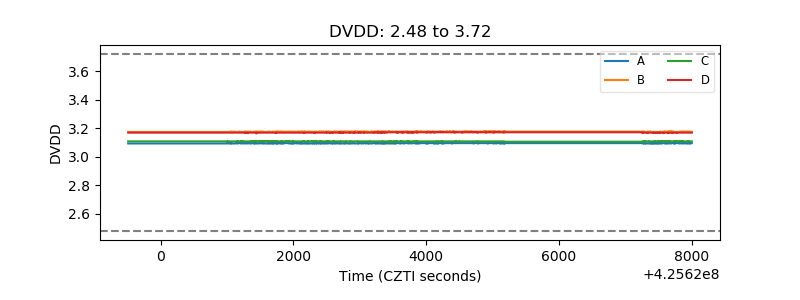 |
| Temperature 1 | 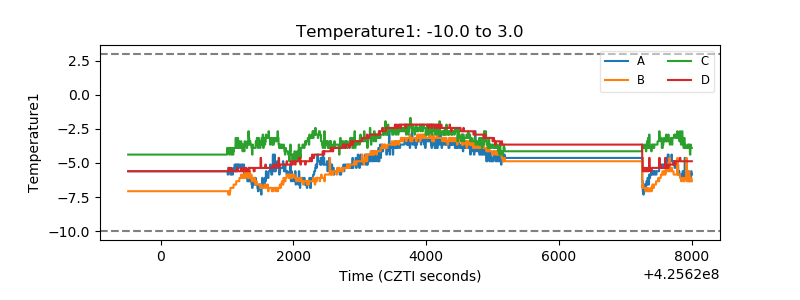 |
| Veto HV Monitor | 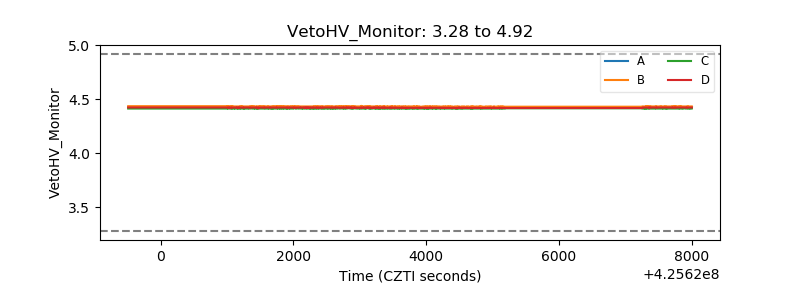 |
| Veto LLD | 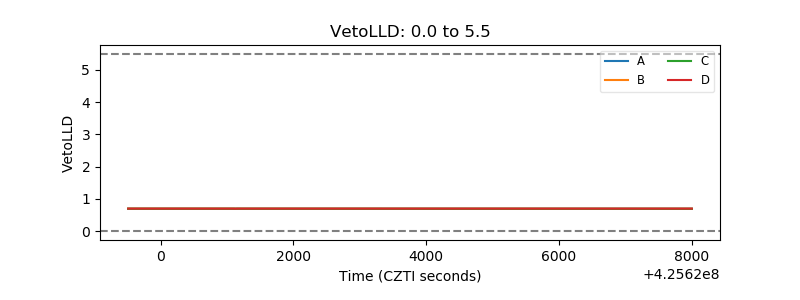 |
| Alpha Counter | 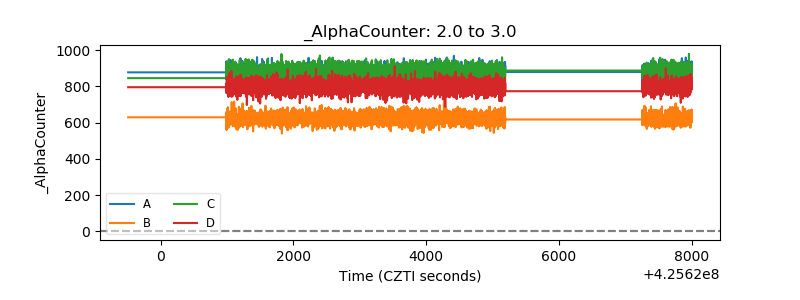 |
| _CPM_Rate | 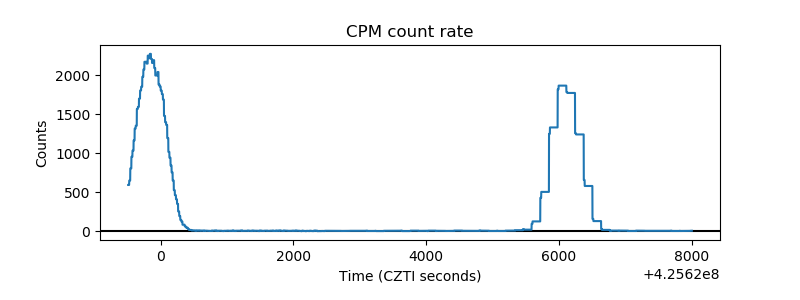 |
| CZT Counter | 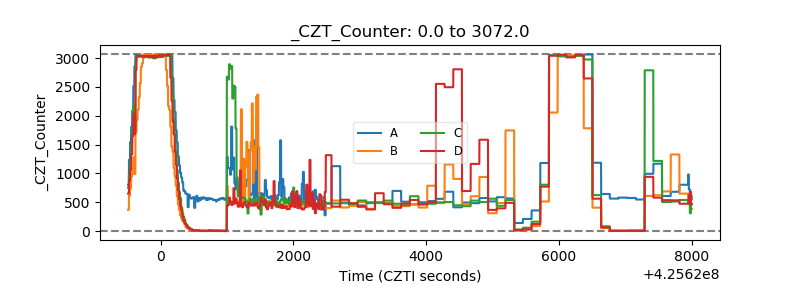 |
| +2.5 Volts monitor |  |
| +5 Volts monitor |  |
| _ROLL_ROT |  |
| _Roll_DEC | 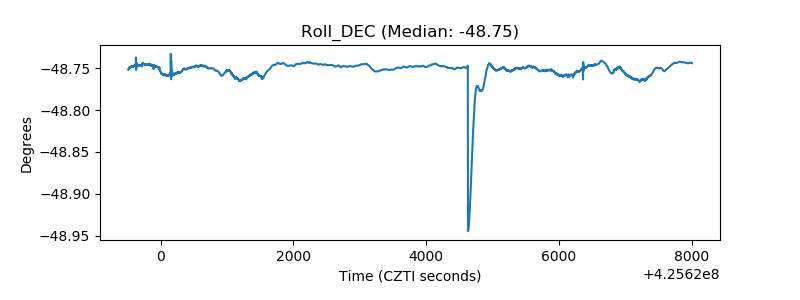 |
| _Roll_RA | 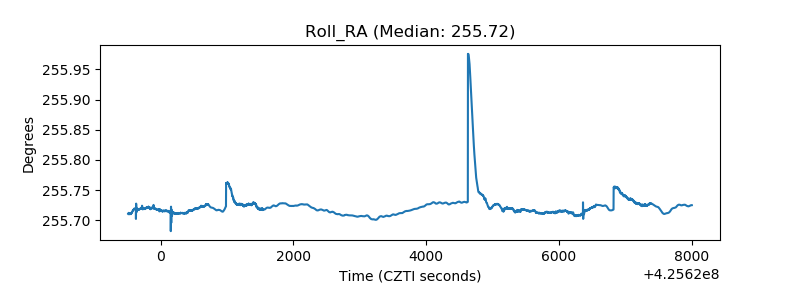 |
| Veto Counter | 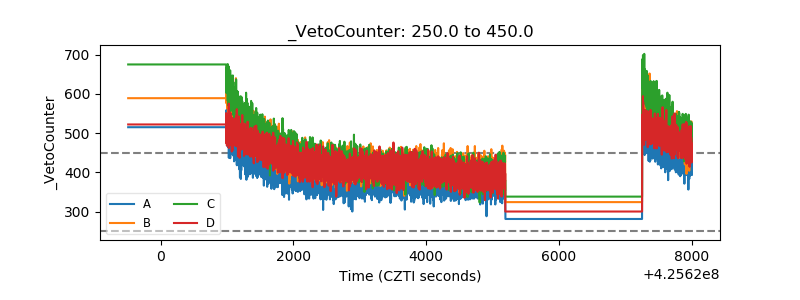 |