| Param | Original file | Final file |
|---|---|---|
| Filename | modeM0/AS1A12_099T01_9000005716_41895cztM0_level2.fits | modeM0/AS1A12_099T01_9000005716_41895cztM0_level2_quad_clean.evt |
| Size (bytes) | 340,660,800 | 88,413,120 |
| Size | 324.9 MB | 84.3 MB |
| Events in quadrant A | 3,088,683 | 605,715 |
| Events in quadrant B | 2,935,360 | 622,676 |
| Events in quadrant C | 3,520,208 | 561,144 |
| Events in quadrant D | 2,685,916 | 545,605 |
| Mode M9 | |||
|---|---|---|---|
| Quadrant | BADHDUFLAG | Total packets | Discarded packets |
| A | 0 | 33 | 0 |
| B | 0 | 33 | 0 |
| C | 0 | 34 | 0 |
| D | 0 | 34 | 0 |
| Mode M0 | |||
|---|---|---|---|
| Quadrant | BADHDUFLAG | Total packets | Discarded packets |
| A | 0 | 12135 | 2 |
| B | 0 | 11827 | 2 |
| C | 0 | 13268 | 2 |
| D | 0 | 11268 | 2 |
| Mode SS | |||
|---|---|---|---|
| Quadrant | BADHDUFLAG | Total packets | Discarded packets |
| A | 0 | 100 | 0 |
| B | 0 | 100 | 0 |
| C | 0 | 100 | 0 |
| D | 0 | 100 | 0 |
| Quadrant | Total seconds | Saturated seconds | Saturation percentage |
|---|---|---|---|
| A | 4879 | 36 | 0.737856% |
| B | 4878 | 139 | 2.849528% |
| C | 4878 | 356 | 7.298073% |
| D | 4878 | 94 | 1.927019% |
Noise dominated data is calculated using 1-second bins in cleaned event files. If a bin has >2000 counts, and if more than 50% of those come from <1% of pixels, then it is considered to be noise-dominated and hence unusable.
| Quadrant | # 1 sec bins | Bins with >0 counts | Bins with >2000 counts | High rate bins dominated by noise | Noise dominated (total time) | Noise dominated (detector-on time) | Marked lightcurve |
|---|---|---|---|---|---|---|---|
| A | 6971 | 4880 | 20 | 20 | 0.29% | 0.41% | 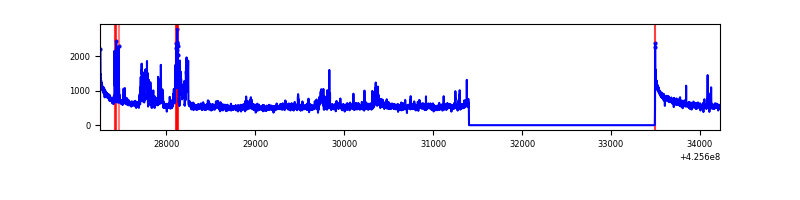 |
| B | 6970 | 4879 | 94 | 94 | 1.35% | 1.93% |  |
| C | 6970 | 4879 | 356 | 356 | 5.11% | 7.30% | 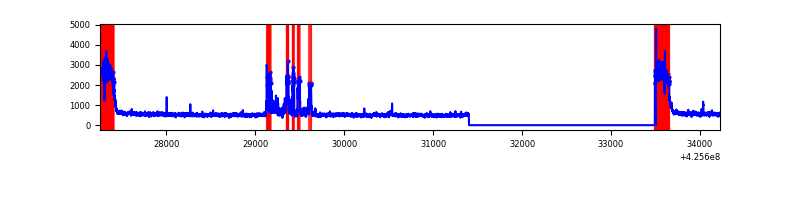 |
| D | 6970 | 4879 | 87 | 87 | 1.25% | 1.78% | 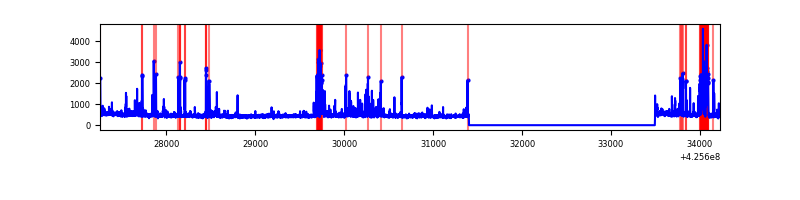 |
Top three noisy pixels from each quadrant. If the there are fewer than three noisy pixels in the level2.evt file, extra rows are filled as -1
| Pixel properties | Quadrant properties | ||||||
|---|---|---|---|---|---|---|---|
| Quadrant | DetID | PixID | Counts | Sigma | Mean | Median | Sigma |
| A | 10 | 83 | 501334 | 4267.24 | 573 | 562 | 117.4 |
| A | 14 | 24 | 346268 | 2945.87 | 573 | 562 | 117.4 |
| A | 2 | 79 | 11833 | 96.04 | 573 | 562 | 117.4 |
| B | 5 | 255 | 663729 | 6231.41 | 566 | 552 | 106.4 |
| B | 0 | 190 | 24251 | 222.68 | 566 | 552 | 106.4 |
| B | 12 | 111 | 13084 | 117.75 | 566 | 552 | 106.4 |
| C | 0 | 10 | 885702 | 7131.56 | 541 | 546 | 124.1 |
| C | 14 | 254 | 312068 | 2509.88 | 541 | 546 | 124.1 |
| C | 15 | 214 | 189902 | 1525.61 | 541 | 546 | 124.1 |
| D | 13 | 112 | 133467 | 978.66 | 559 | 543 | 135.8 |
| D | 12 | 6 | 133148 | 976.31 | 559 | 543 | 135.8 |
| D | 13 | 249 | 99822 | 730.95 | 559 | 543 | 135.8 |
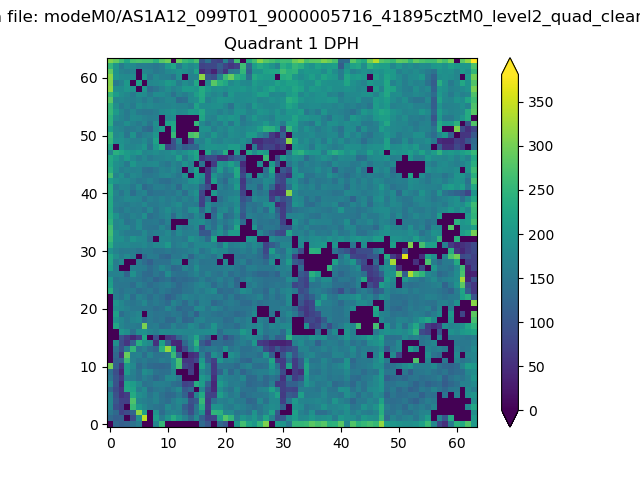
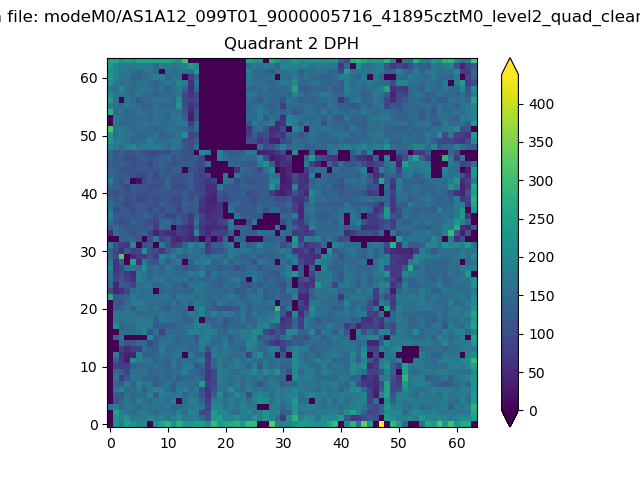
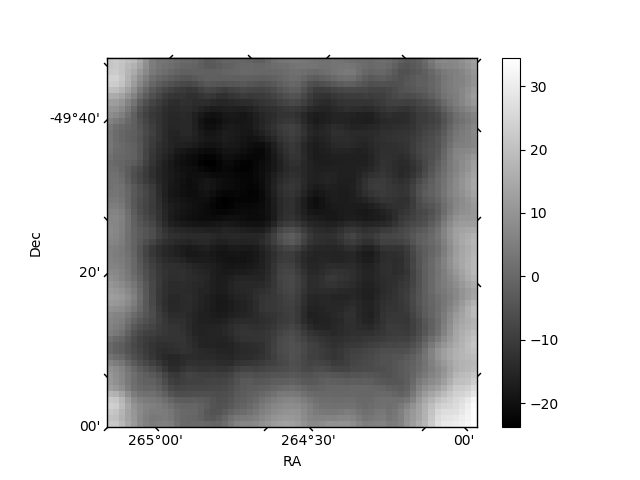
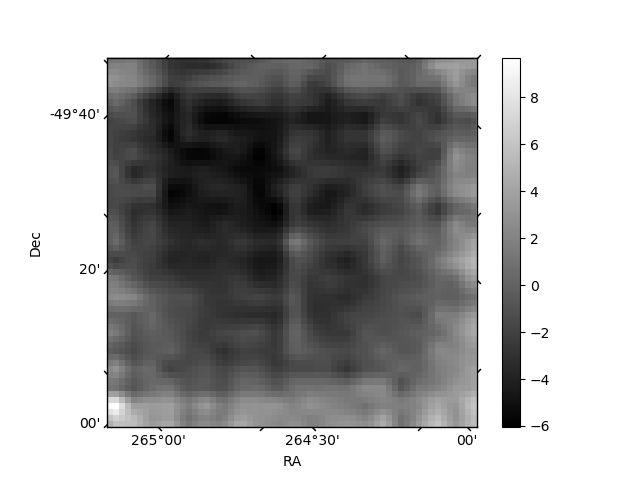
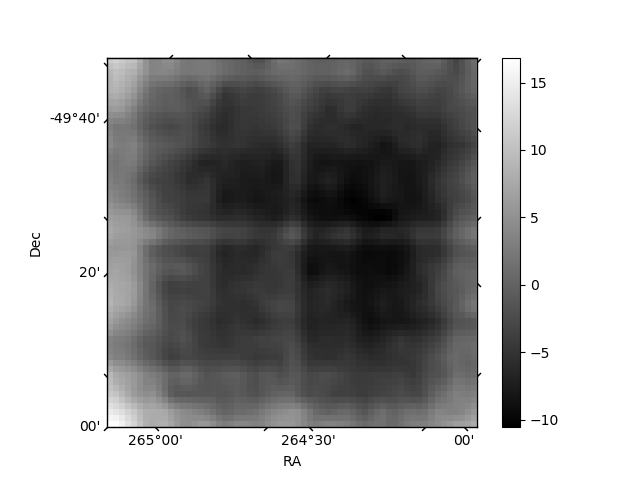
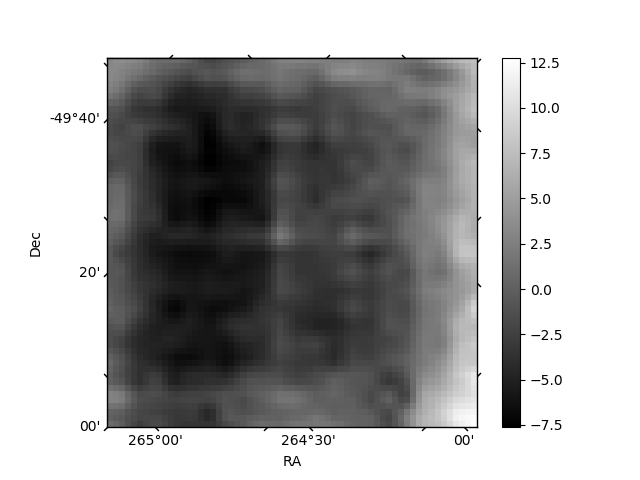
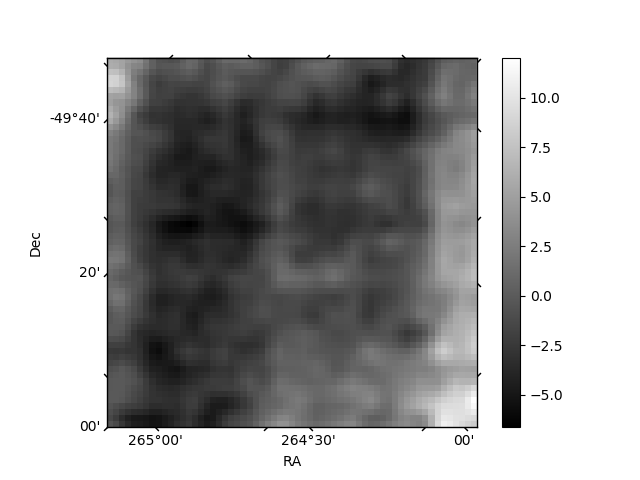
Histogram calculated using DETX and DETY for each event in the final _common_clean file
| Quadrant A | 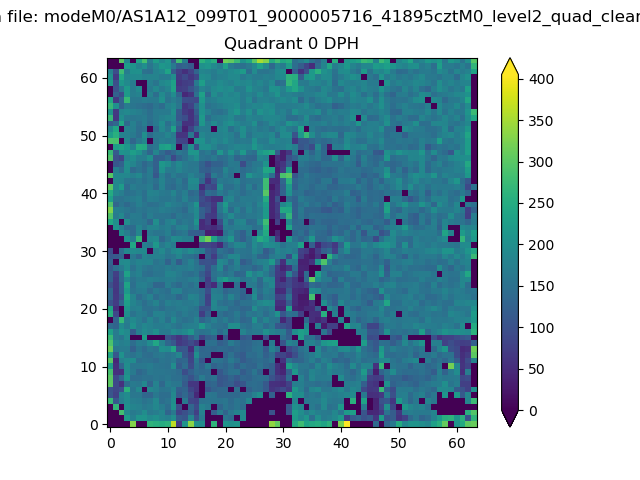 |
 |
Quadrant B |
|---|---|---|---|
| Quadrant D | 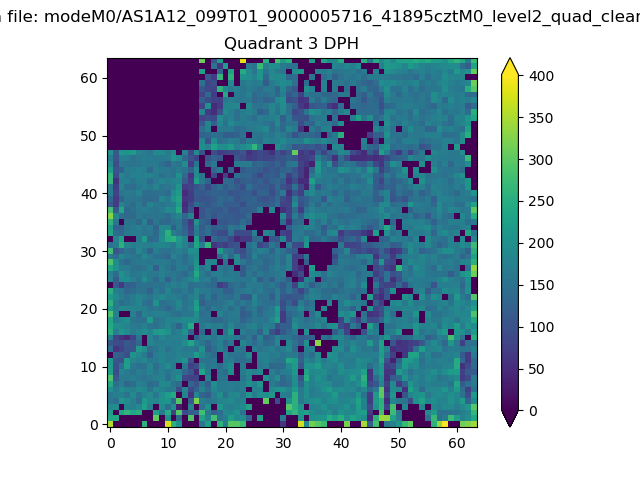 |
 |
Quadrant C |
| Plot type | Count rate plots | Images |
|---|---|---|
| Comparison with Poisson distribution Blue bars denote a histogram of data divided into 1 sec bins. Red curve is a Poisson curve with rate = median count rate of data. |
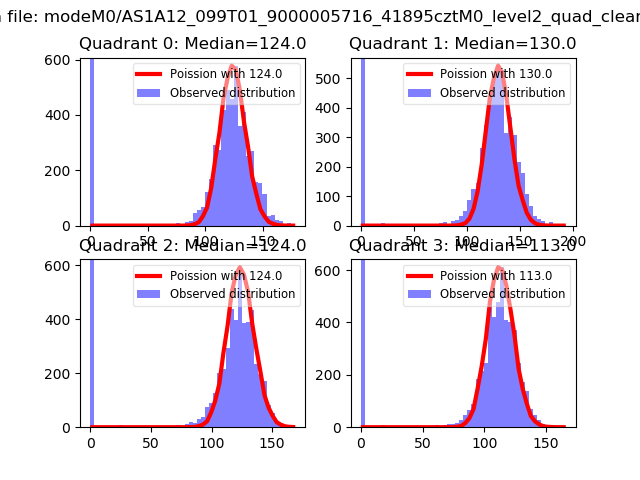 |
 |
| Quadrant-wise count rates Data is divided into 100 sec bins |
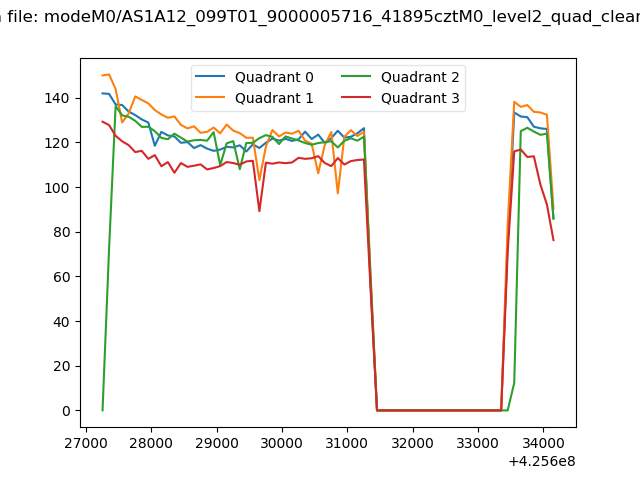 |
|
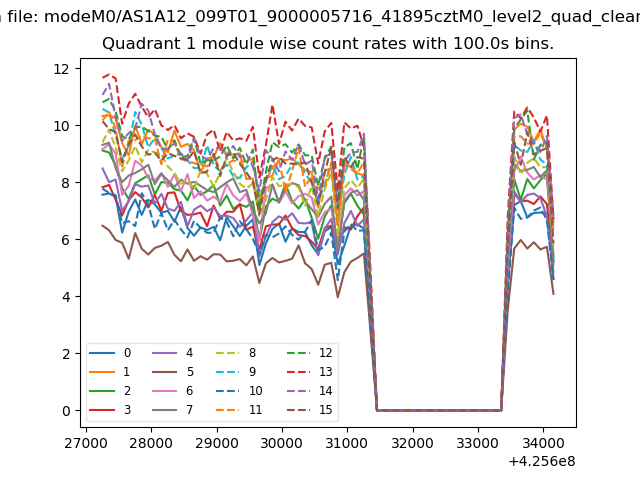
| Module-wise count rates for Quadrant A Data is divided into 100 sec bins |
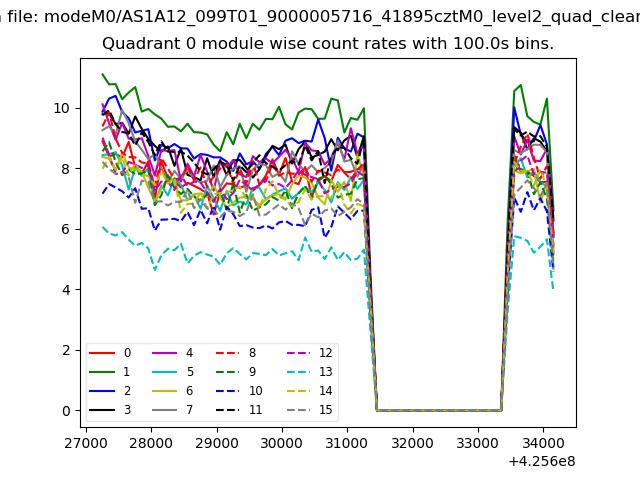 |
 |
| Module-wise count rates for Quadrant B Data is divided into 100 sec bins |
 |
 |
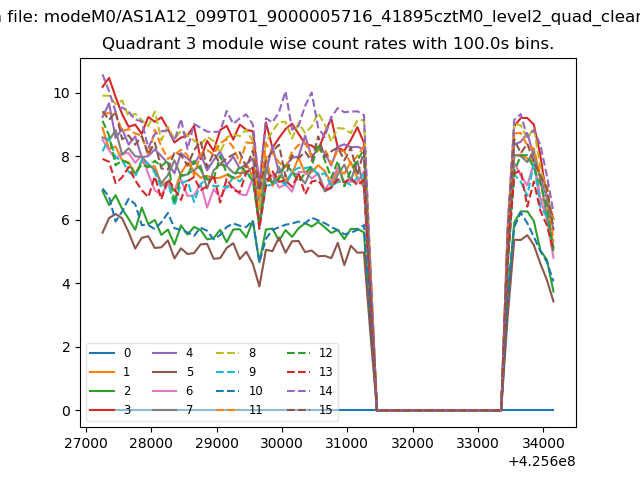
| Module-wise count rates for Quadrant C Data is divided into 100 sec bins |
 |
 |
| Module-wise count rates for Quadrant D Data is divided into 100 sec bins |
 |
 |
| Parameter | Plot |
|---|---|
| CZT HV Monitor |  |
| D_VDD | 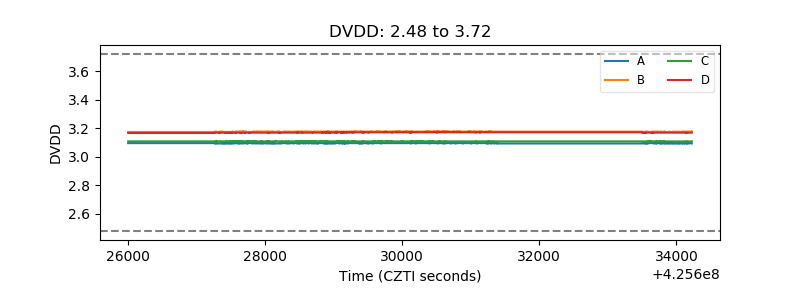 |
| Temperature 1 | 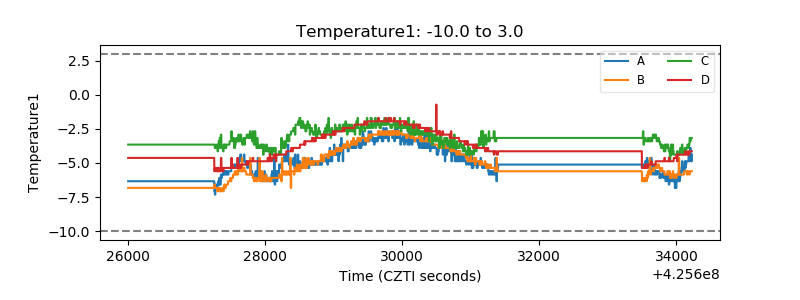 |
| Veto HV Monitor | 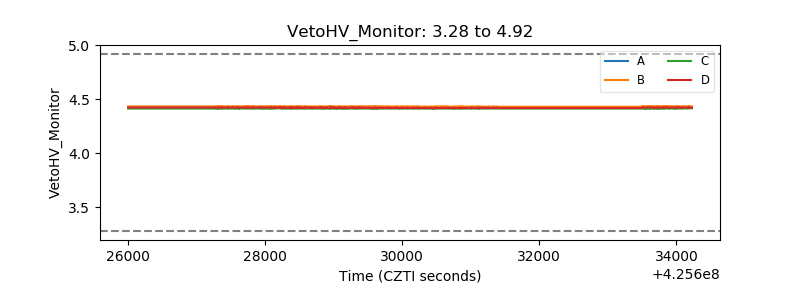 |
| Veto LLD | 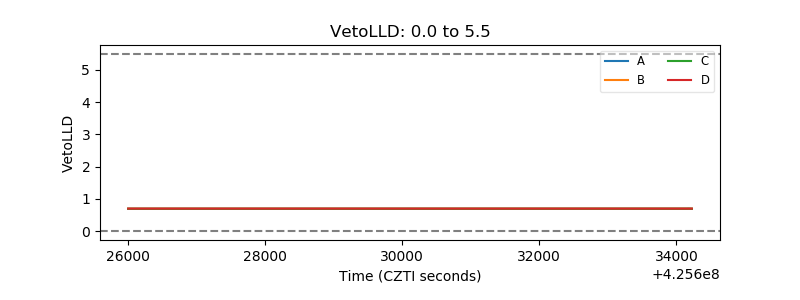 |
| Alpha Counter | 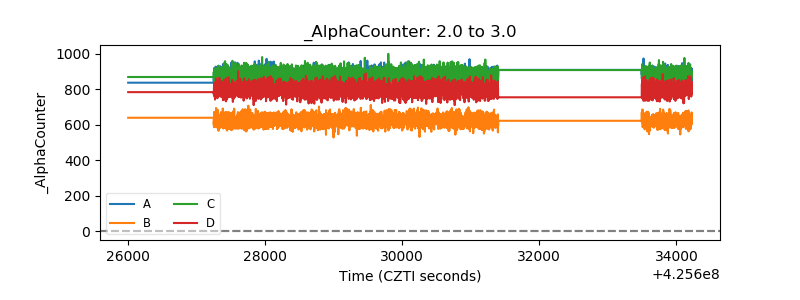 |
| _CPM_Rate |  |
| CZT Counter | 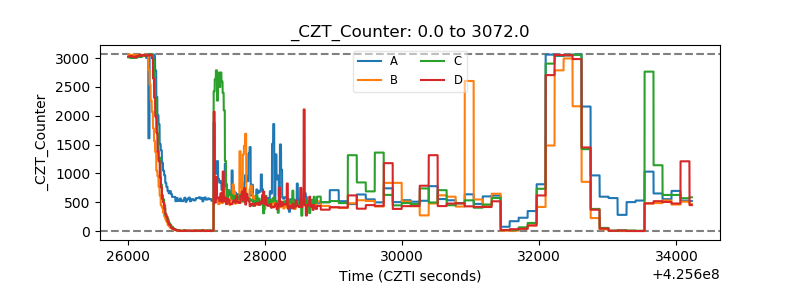 |
| +2.5 Volts monitor |  |
| +5 Volts monitor |  |
| _ROLL_ROT | 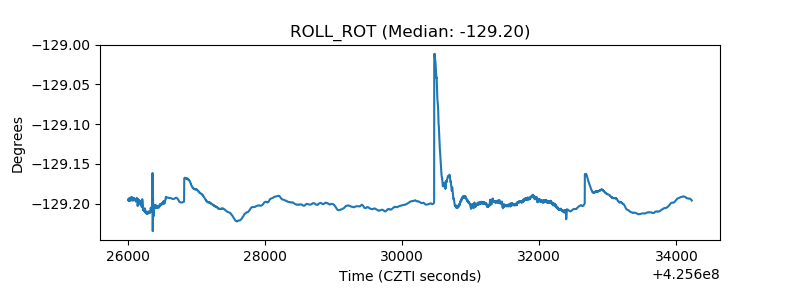 |
| _Roll_DEC |  |
| _Roll_RA | 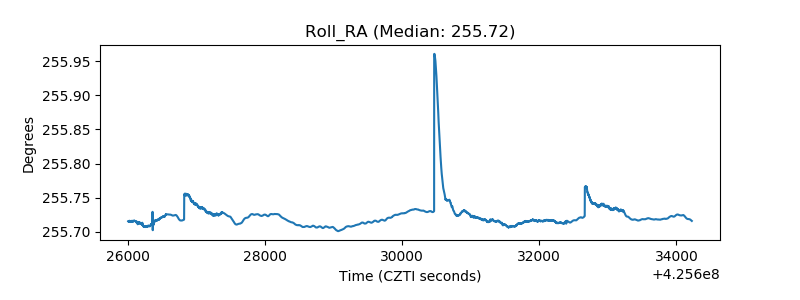 |
| Veto Counter | 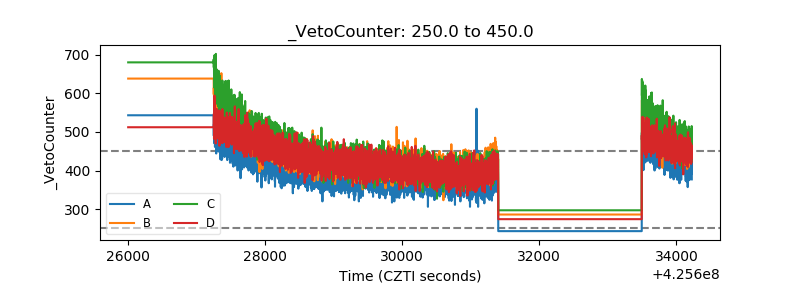 |