| Param | Original file | Final file |
|---|---|---|
| Filename | modeM0/AS1A12_099T01_9000005716_41896cztM0_level2.fits | modeM0/AS1A12_099T01_9000005716_41896cztM0_level2_quad_clean.evt |
| Size (bytes) | 324,270,720 | 85,049,280 |
| Size | 309.2 MB | 81.1 MB |
| Events in quadrant A | 2,800,361 | 579,925 |
| Events in quadrant B | 3,104,536 | 590,296 |
| Events in quadrant C | 3,137,529 | 542,108 |
| Events in quadrant D | 2,583,529 | 523,335 |
| Mode M9 | |||
|---|---|---|---|
| Quadrant | BADHDUFLAG | Total packets | Discarded packets |
| A | 0 | 30 | 0 |
| B | 0 | 30 | 0 |
| C | 0 | 31 | 0 |
| D | 0 | 31 | 0 |
| Mode M0 | |||
|---|---|---|---|
| Quadrant | BADHDUFLAG | Total packets | Discarded packets |
| A | 0 | 11123 | 2 |
| B | 0 | 12383 | 2 |
| C | 0 | 12105 | 2 |
| D | 0 | 10963 | 2 |
| Mode SS | |||
|---|---|---|---|
| Quadrant | BADHDUFLAG | Total packets | Discarded packets |
| A | 0 | 100 | 0 |
| B | 0 | 100 | 0 |
| C | 0 | 100 | 0 |
| D | 0 | 100 | 0 |
| Quadrant | Total seconds | Saturated seconds | Saturation percentage |
|---|---|---|---|
| A | 4842 | 24 | 0.495663% |
| B | 4842 | 176 | 3.634862% |
| C | 4842 | 303 | 6.257745% |
| D | 4842 | 74 | 1.528294% |
Noise dominated data is calculated using 1-second bins in cleaned event files. If a bin has >2000 counts, and if more than 50% of those come from <1% of pixels, then it is considered to be noise-dominated and hence unusable.
| Quadrant | # 1 sec bins | Bins with >0 counts | Bins with >2000 counts | High rate bins dominated by noise | Noise dominated (total time) | Noise dominated (detector-on time) | Marked lightcurve |
|---|---|---|---|---|---|---|---|
| A | 6964 | 4843 | 18 | 18 | 0.26% | 0.37% | 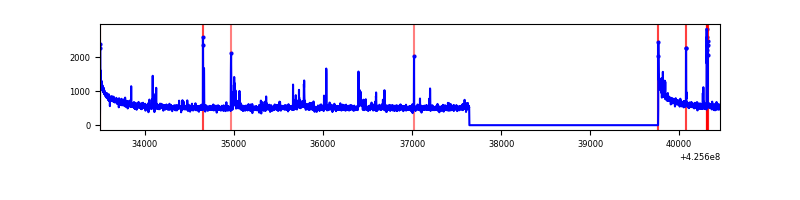 |
| B | 6964 | 4843 | 138 | 138 | 1.98% | 2.85% | 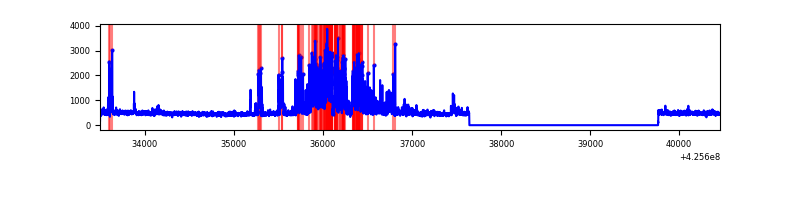 |
| C | 6964 | 4843 | 294 | 294 | 4.22% | 6.07% |  |
| D | 6964 | 4843 | 70 | 70 | 1.01% | 1.45% | 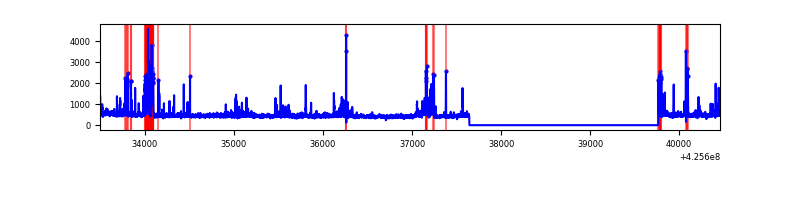 |
Top three noisy pixels from each quadrant. If the there are fewer than three noisy pixels in the level2.evt file, extra rows are filled as -1
| Pixel properties | Quadrant properties | ||||||
|---|---|---|---|---|---|---|---|
| Quadrant | DetID | PixID | Counts | Sigma | Mean | Median | Sigma |
| A | 10 | 83 | 503762 | 4399.21 | 555 | 544 | 114.4 |
| A | 2 | 79 | 79125 | 686.97 | 555 | 544 | 114.4 |
| A | 14 | 24 | 62364 | 540.44 | 555 | 544 | 114.4 |
| B | 5 | 255 | 897240 | 8592.02 | 548 | 535 | 104.4 |
| B | 0 | 190 | 43653 | 413.15 | 548 | 535 | 104.4 |
| B | 12 | 111 | 13163 | 121.0 | 548 | 535 | 104.4 |
| C | 0 | 10 | 887037 | 7392.01 | 521 | 526 | 119.9 |
| C | 15 | 214 | 188976 | 1571.36 | 521 | 526 | 119.9 |
| C | 0 | 15 | 14401 | 115.69 | 521 | 526 | 119.9 |
| D | 13 | 112 | 130356 | 985.54 | 541 | 525 | 131.7 |
| D | 12 | 6 | 118616 | 896.42 | 541 | 525 | 131.7 |
| D | 12 | 79 | 72918 | 549.53 | 541 | 525 | 131.7 |
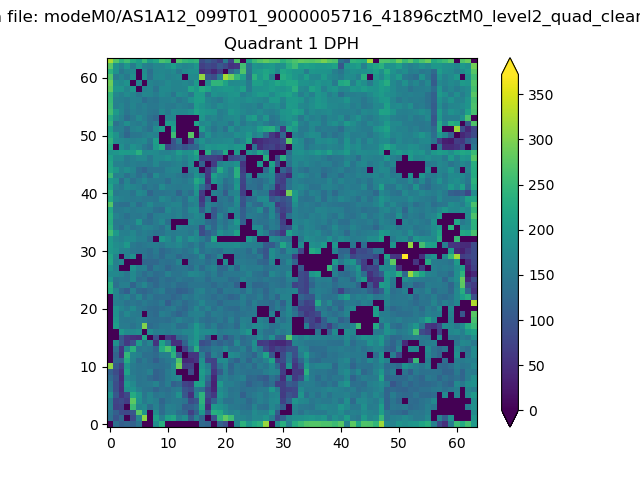
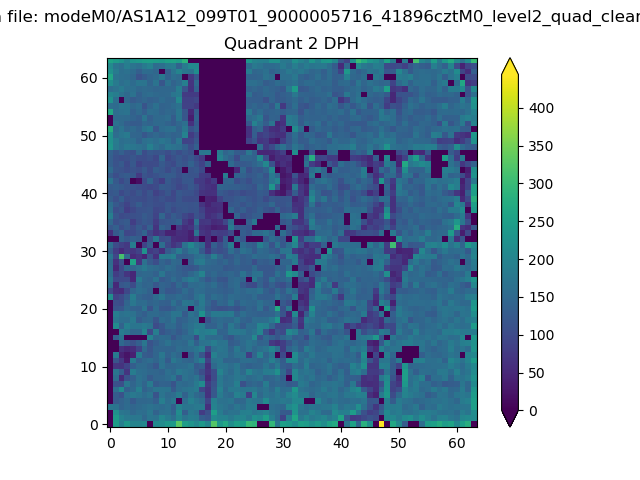
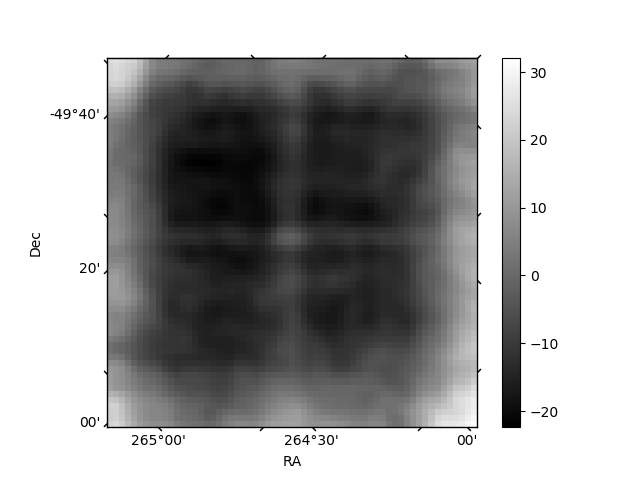
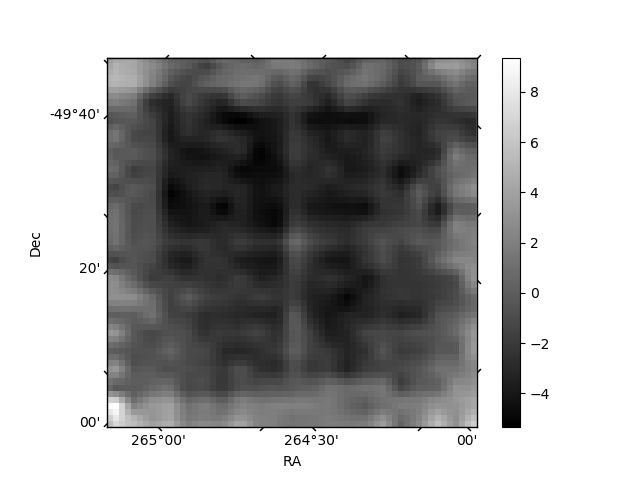
Histogram calculated using DETX and DETY for each event in the final _common_clean file
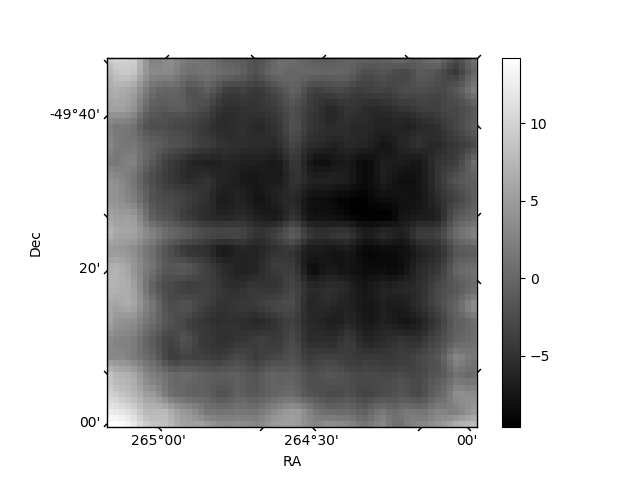
| Quadrant A | 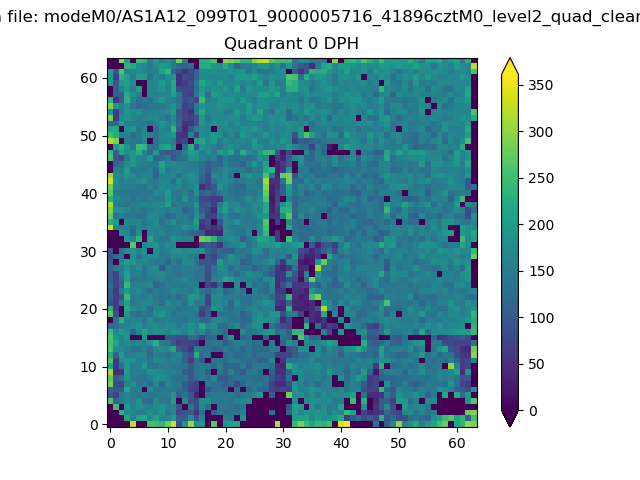 |
 |
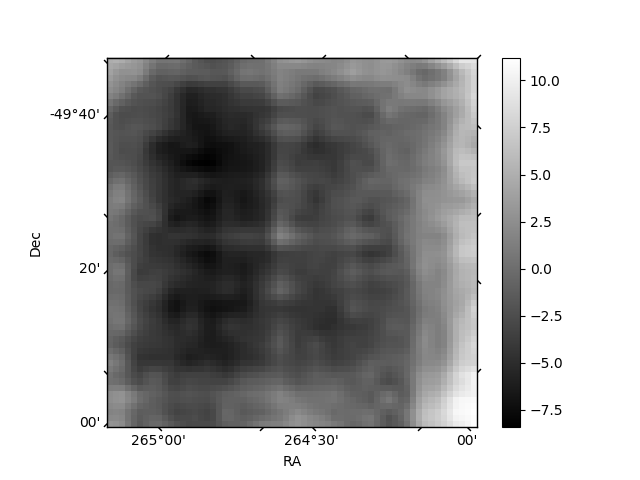
Quadrant B |
|---|---|---|---|
| Quadrant D | 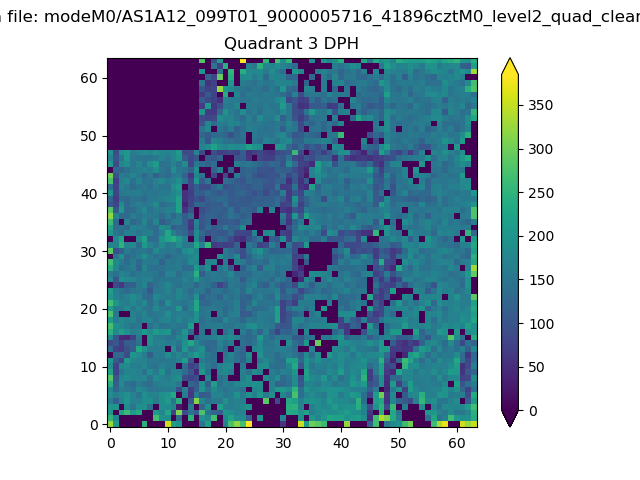 |
 |
Quadrant C |
| Plot type | Count rate plots | Images |
|---|---|---|
| Comparison with Poisson distribution Blue bars denote a histogram of data divided into 1 sec bins. Red curve is a Poisson curve with rate = median count rate of data. |
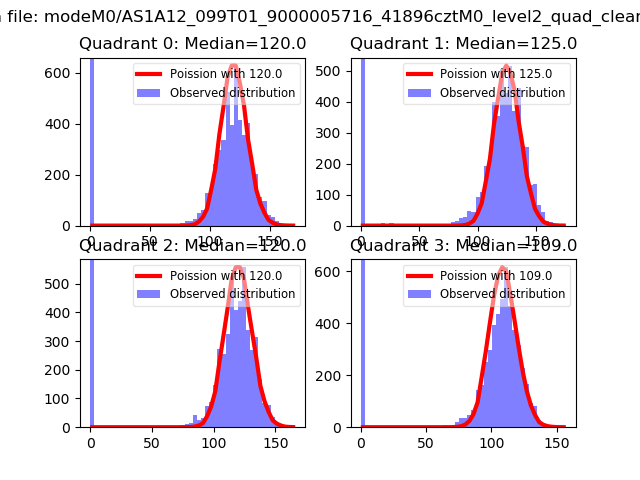 |
 |
| Quadrant-wise count rates Data is divided into 100 sec bins |
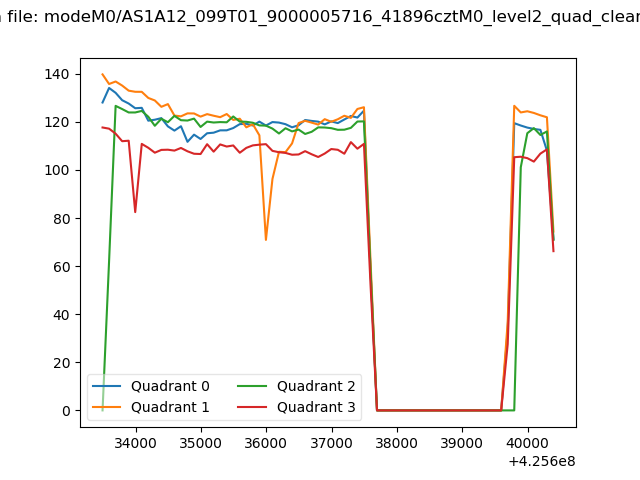 |
|
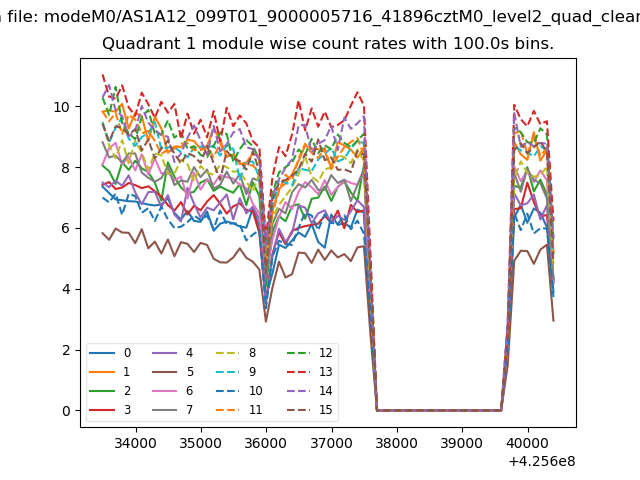
| Module-wise count rates for Quadrant A Data is divided into 100 sec bins |
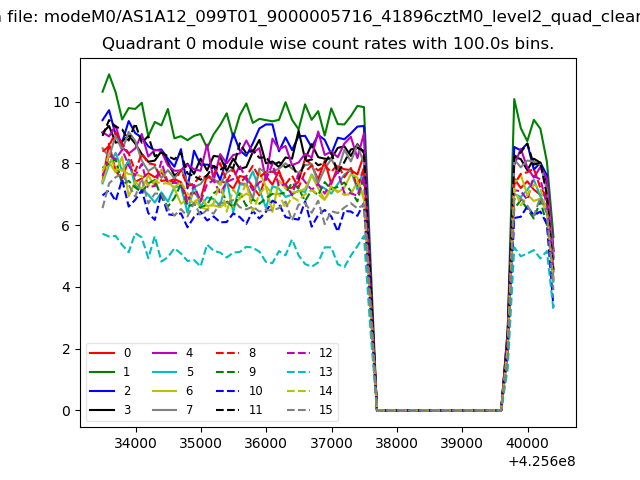 |
 |
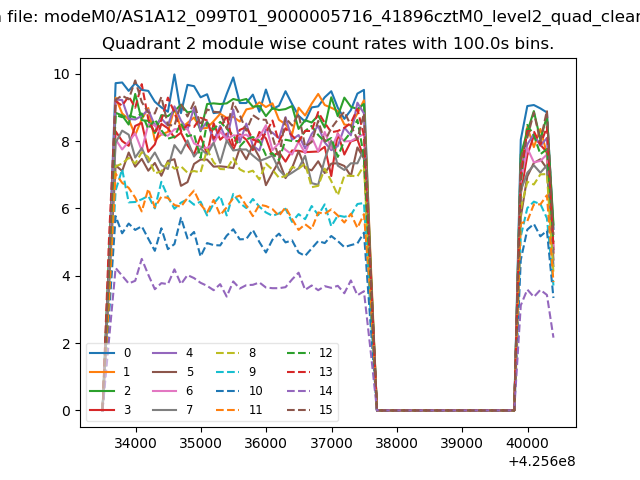
| Module-wise count rates for Quadrant B Data is divided into 100 sec bins |
 |
 |
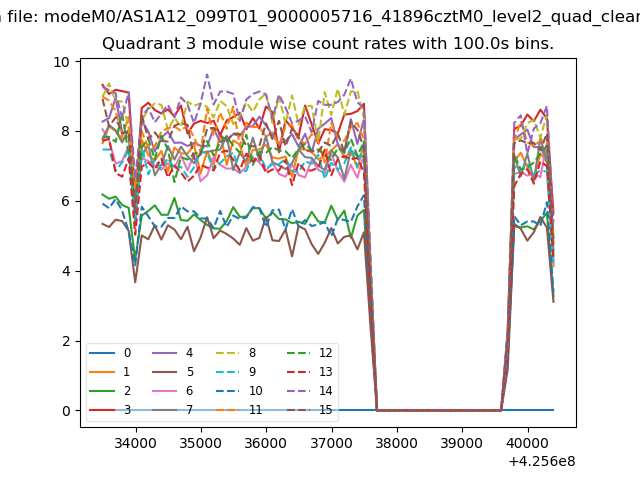
| Module-wise count rates for Quadrant C Data is divided into 100 sec bins |
 |
 |
| Module-wise count rates for Quadrant D Data is divided into 100 sec bins |
 |
 |
| Parameter | Plot |
|---|---|
| CZT HV Monitor | 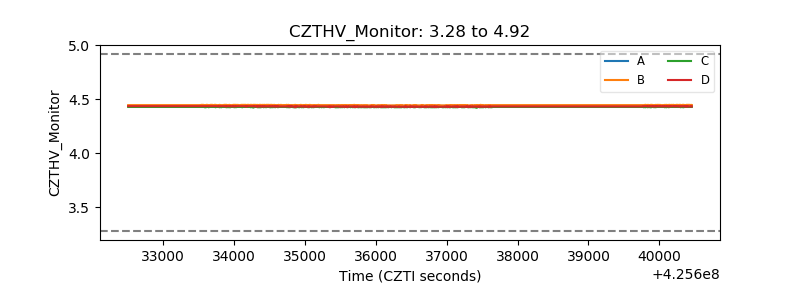 |
| D_VDD | 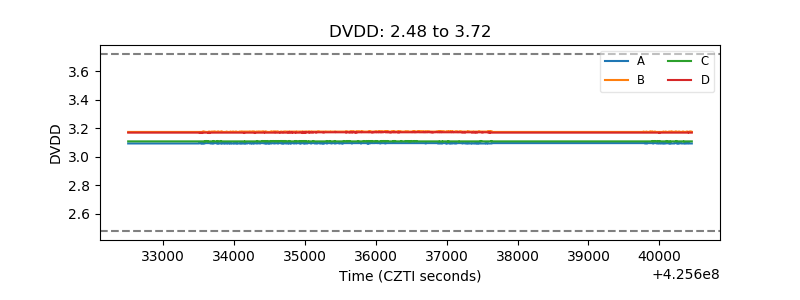 |
| Temperature 1 | 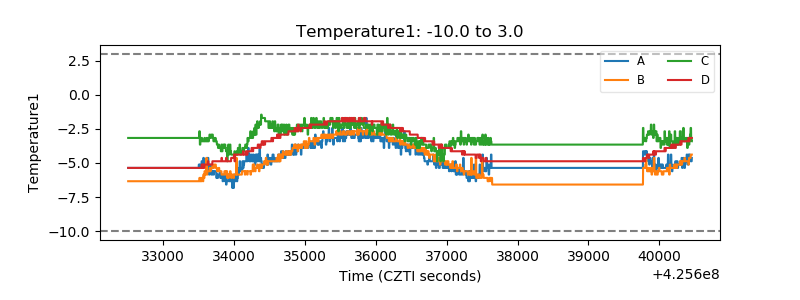 |
| Veto HV Monitor |  |
| Veto LLD | 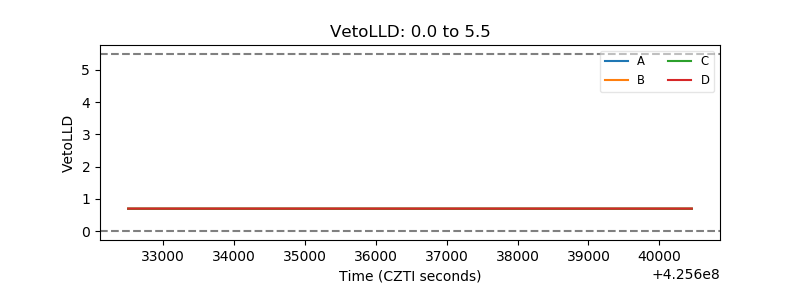 |
| Alpha Counter |  |
| _CPM_Rate |  |
| CZT Counter | 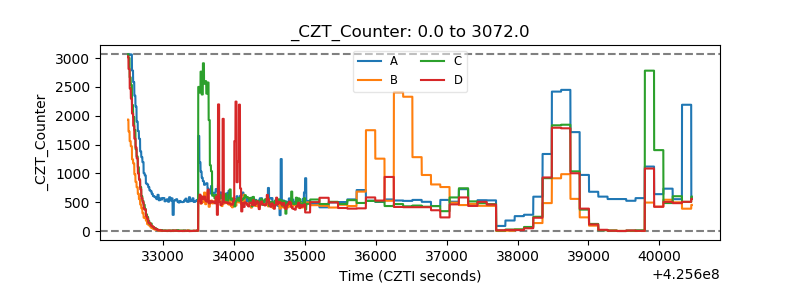 |
| +2.5 Volts monitor | 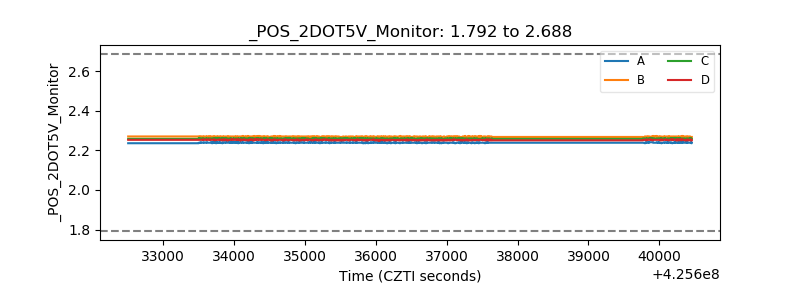 |
| +5 Volts monitor |  |
| _ROLL_ROT | 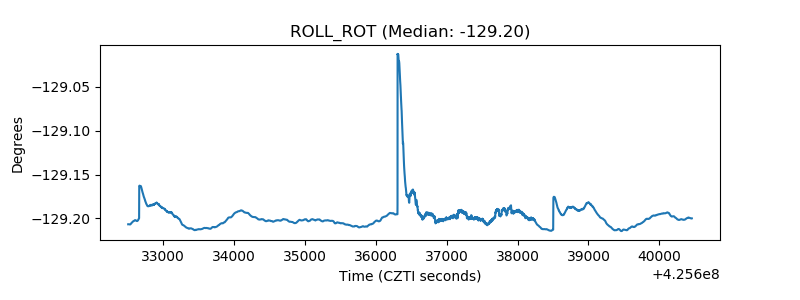 |
| _Roll_DEC | 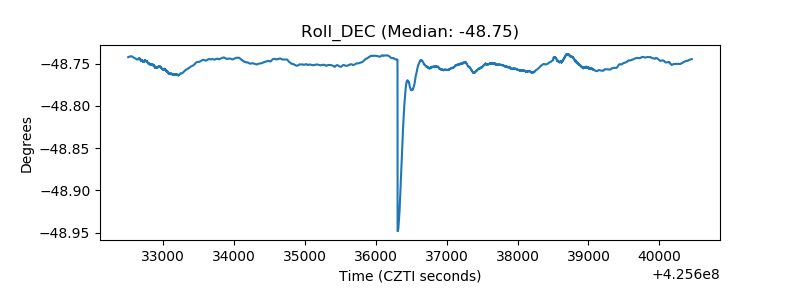 |
| _Roll_RA | 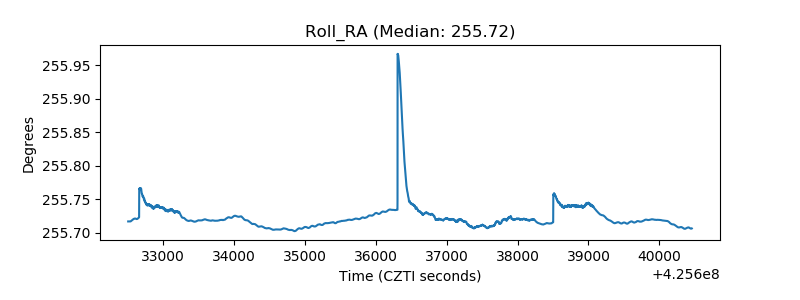 |
| Veto Counter | 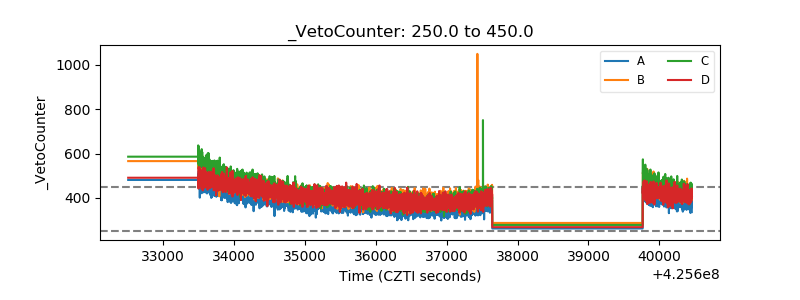 |