| Param | Original file | Final file |
|---|---|---|
| Filename | modeM0/AS1A12_099T01_9000005716_41897cztM0_level2.fits | modeM0/AS1A12_099T01_9000005716_41897cztM0_level2_quad_clean.evt |
| Size (bytes) | 386,504,640 | 81,717,120 |
| Size | 368.6 MB | 77.9 MB |
| Events in quadrant A | 2,863,862 | 569,965 |
| Events in quadrant B | 3,035,934 | 587,622 |
| Events in quadrant C | 3,122,131 | 536,207 |
| Events in quadrant D | 4,894,060 | 428,373 |
| Mode M9 | |||
|---|---|---|---|
| Quadrant | BADHDUFLAG | Total packets | Discarded packets |
| A | 0 | 41 | 0 |
| B | 0 | 42 | 0 |
| C | 0 | 42 | 0 |
| D | 0 | 42 | 0 |
| Mode M0 | |||
|---|---|---|---|
| Quadrant | BADHDUFLAG | Total packets | Discarded packets |
| A | 0 | 11528 | 2 |
| B | 0 | 12373 | 2 |
| C | 0 | 12351 | 2 |
| D | 0 | 17935 | 2 |
| Mode SS | |||
|---|---|---|---|
| Quadrant | BADHDUFLAG | Total packets | Discarded packets |
| A | 0 | 102 | 0 |
| B | 0 | 104 | 0 |
| C | 0 | 104 | 0 |
| D | 0 | 104 | 0 |
| Quadrant | Total seconds | Saturated seconds | Saturation percentage |
|---|---|---|---|
| A | 5025 | 19 | 0.378109% |
| B | 5025 | 106 | 2.109453% |
| C | 5025 | 297 | 5.910448% |
| D | 5025 | 1001 | 19.920398% |
Noise dominated data is calculated using 1-second bins in cleaned event files. If a bin has >2000 counts, and if more than 50% of those come from <1% of pixels, then it is considered to be noise-dominated and hence unusable.
| Quadrant | # 1 sec bins | Bins with >0 counts | Bins with >2000 counts | High rate bins dominated by noise | Noise dominated (total time) | Noise dominated (detector-on time) | Marked lightcurve |
|---|---|---|---|---|---|---|---|
| A | 7057 | 5026 | 14 | 14 | 0.20% | 0.28% | 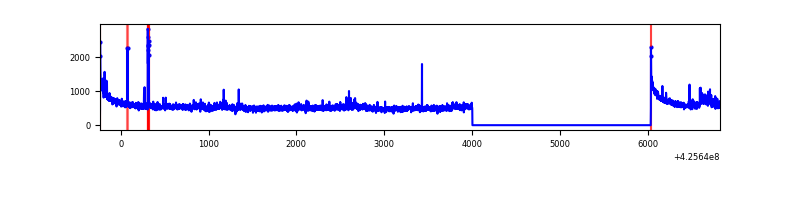 |
| B | 7057 | 5026 | 67 | 67 | 0.95% | 1.33% | 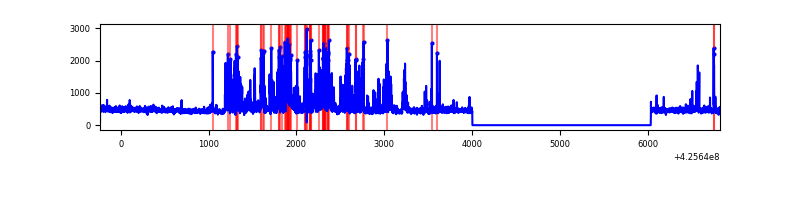 |
| C | 7057 | 5026 | 291 | 291 | 4.12% | 5.79% | 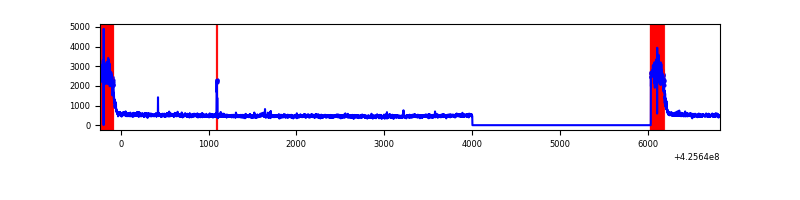 |
| D | 7057 | 5026 | 893 | 893 | 12.65% | 17.77% | 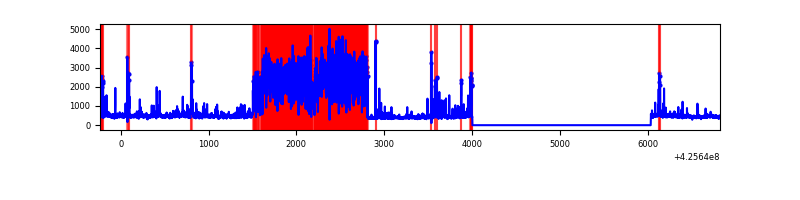 |
Top three noisy pixels from each quadrant. If the there are fewer than three noisy pixels in the level2.evt file, extra rows are filled as -1
| Pixel properties | Quadrant properties | ||||||
|---|---|---|---|---|---|---|---|
| Quadrant | DetID | PixID | Counts | Sigma | Mean | Median | Sigma |
| A | 10 | 83 | 518821 | 4532.42 | 556 | 546 | 114.3 |
| A | 14 | 24 | 181763 | 1584.78 | 556 | 546 | 114.3 |
| A | 13 | 254 | 7555 | 61.3 | 556 | 546 | 114.3 |
| B | 5 | 255 | 792422 | 7397.41 | 552 | 536 | 107.0 |
| B | 0 | 190 | 53598 | 495.68 | 552 | 536 | 107.0 |
| B | 7 | 202 | 14952 | 134.67 | 552 | 536 | 107.0 |
| C | 0 | 10 | 855568 | 7077.82 | 519 | 523 | 120.8 |
| C | 15 | 214 | 195234 | 1611.76 | 519 | 523 | 120.8 |
| C | 14 | 254 | 24623 | 199.49 | 519 | 523 | 120.8 |
| D | 5 | 222 | 2593086 | 21317.02 | 500 | 486 | 121.6 |
| D | 12 | 6 | 119463 | 978.26 | 500 | 486 | 121.6 |
| D | 13 | 249 | 93779 | 767.08 | 500 | 486 | 121.6 |
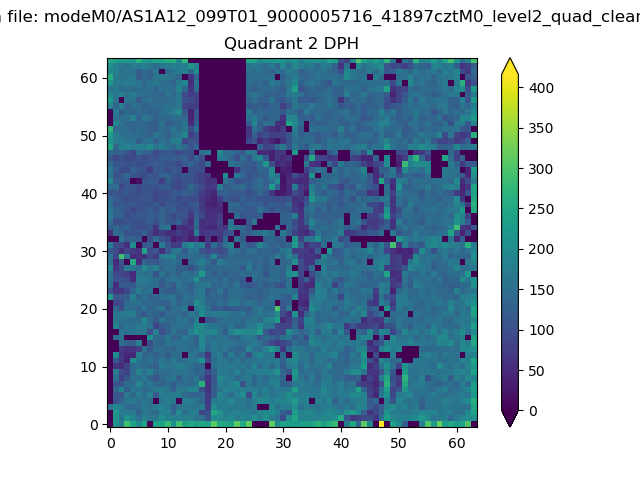
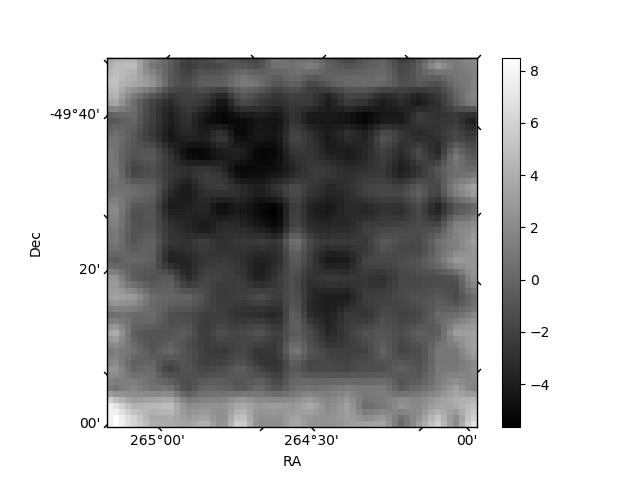
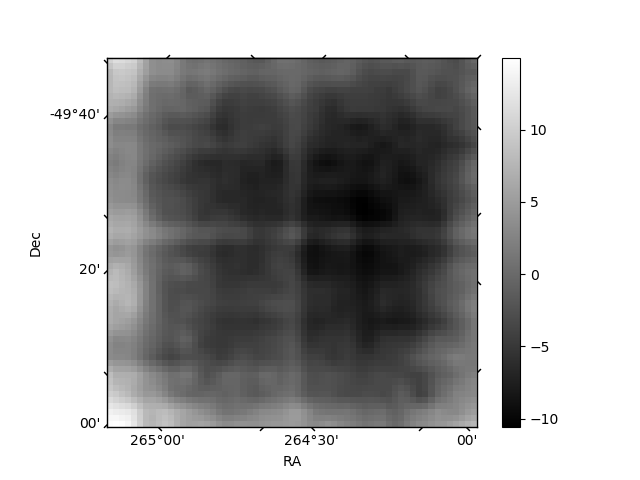
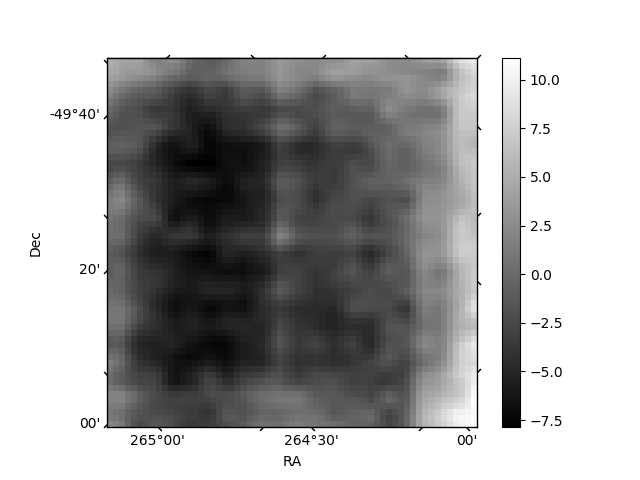
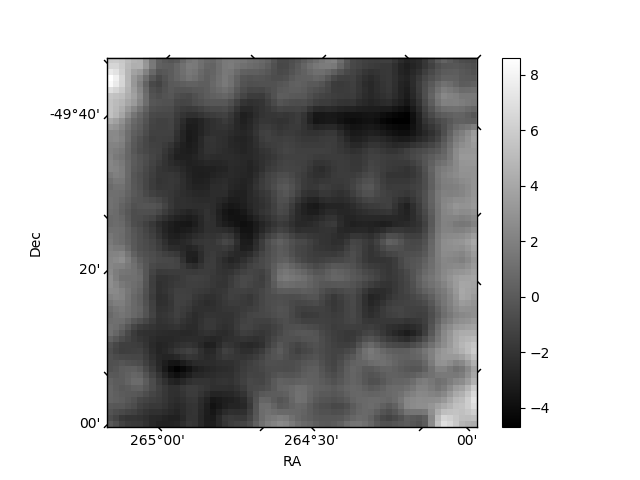
Histogram calculated using DETX and DETY for each event in the final _common_clean file
| Quadrant A |  |
 |
Quadrant B |
|---|---|---|---|
| Quadrant D | 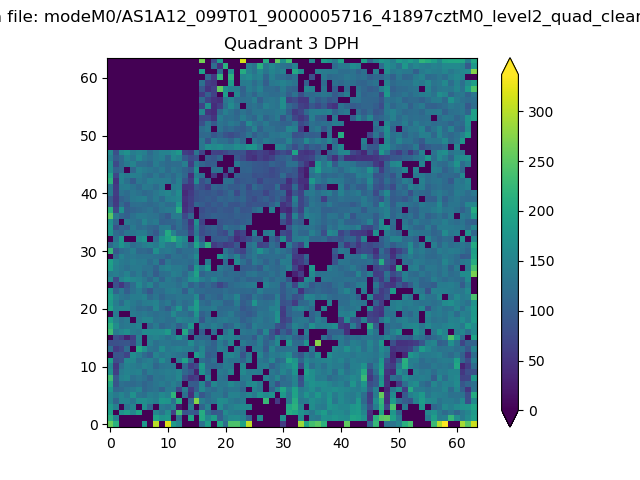 |
 |
Quadrant C |
| Plot type | Count rate plots | Images |
|---|---|---|
| Comparison with Poisson distribution Blue bars denote a histogram of data divided into 1 sec bins. Red curve is a Poisson curve with rate = median count rate of data. |
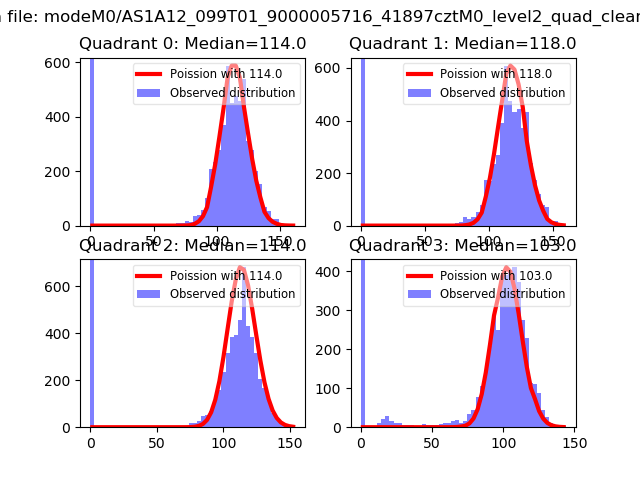 |
 |
| Quadrant-wise count rates Data is divided into 100 sec bins |
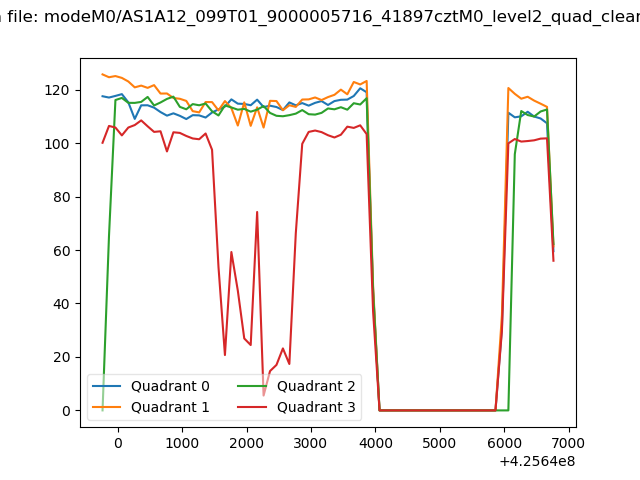 |
|
| Module-wise count rates for Quadrant A Data is divided into 100 sec bins |
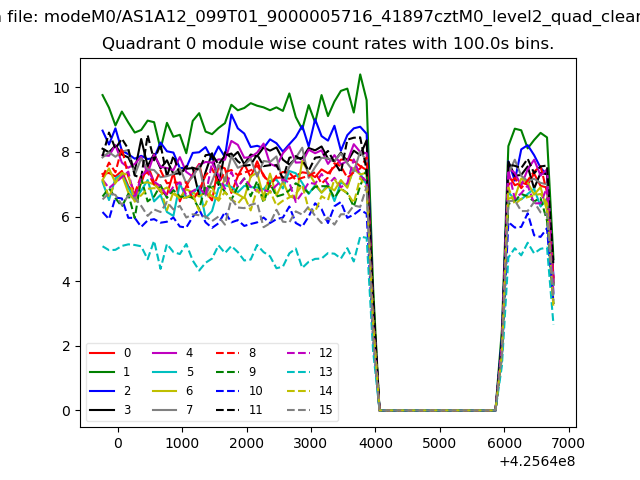 |
 |
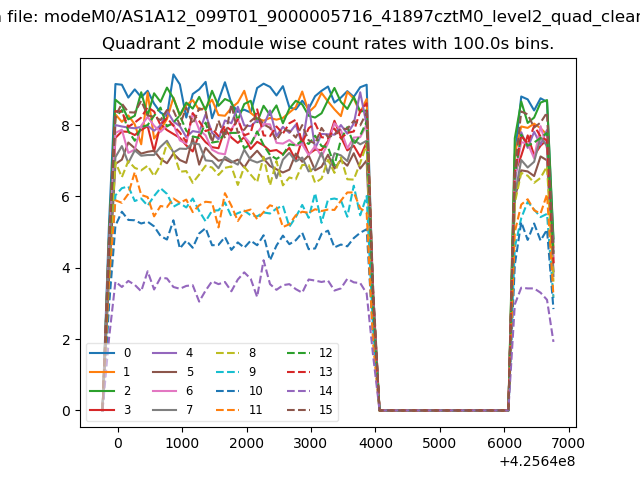
| Module-wise count rates for Quadrant B Data is divided into 100 sec bins |
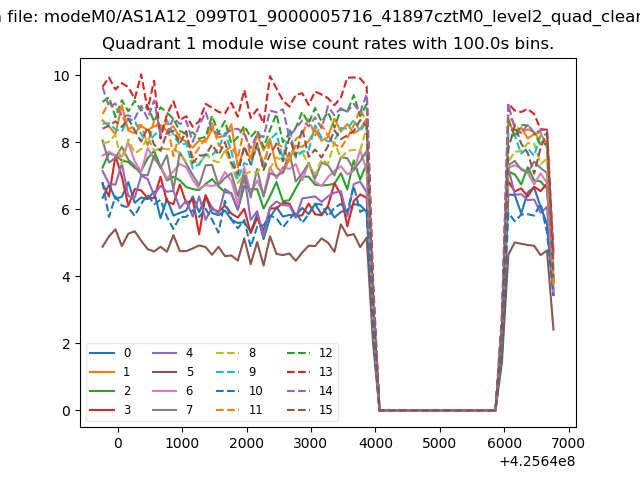 |
 |
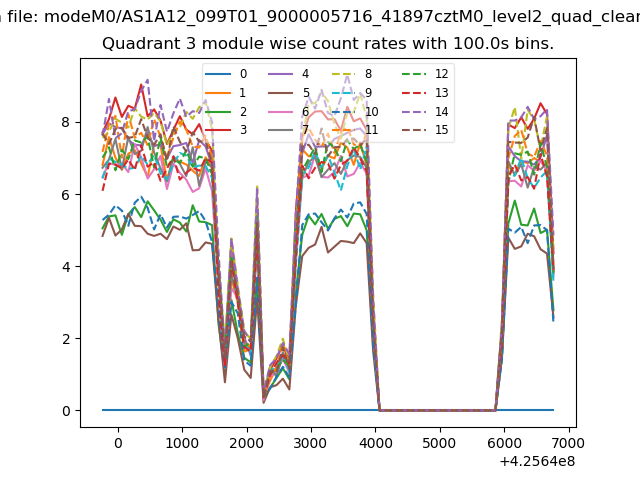
| Module-wise count rates for Quadrant C Data is divided into 100 sec bins |
 |
 |
| Module-wise count rates for Quadrant D Data is divided into 100 sec bins |
 |
 |
| Parameter | Plot |
|---|---|
| CZT HV Monitor | 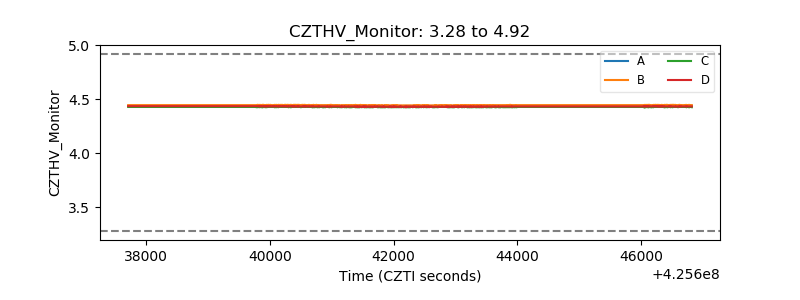 |
| D_VDD | 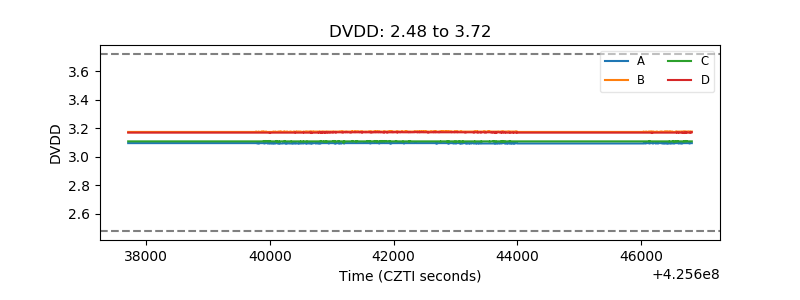 |
| Temperature 1 | 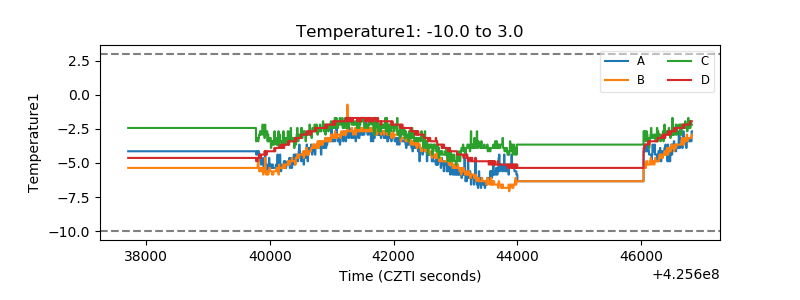 |
| Veto HV Monitor | 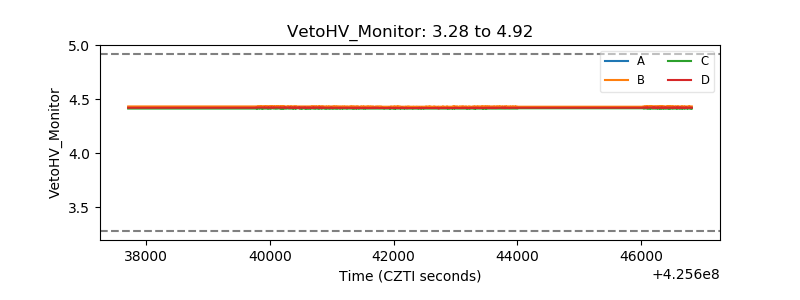 |
| Veto LLD | 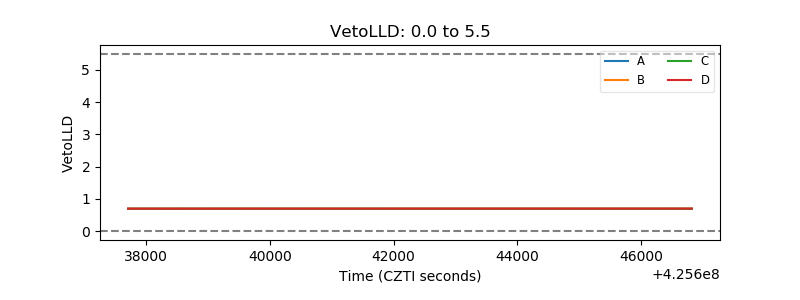 |
| Alpha Counter | 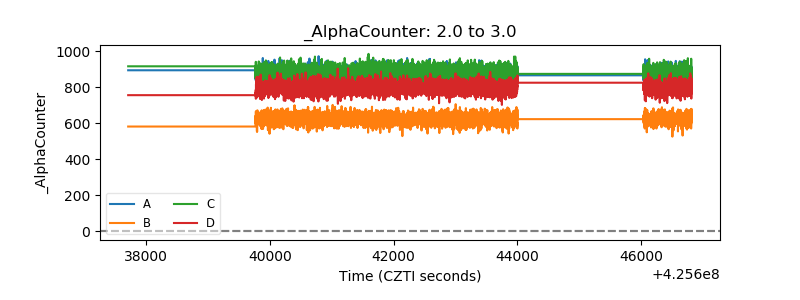 |
| _CPM_Rate | 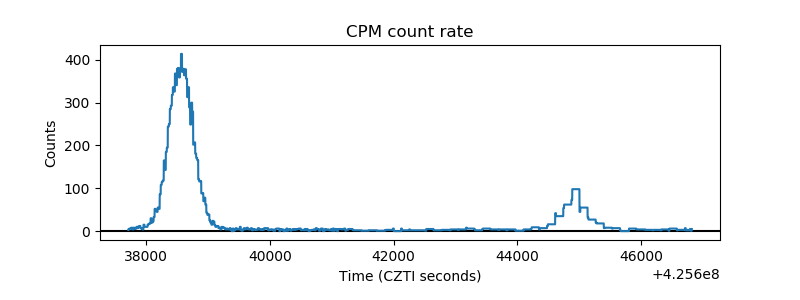 |
| CZT Counter | 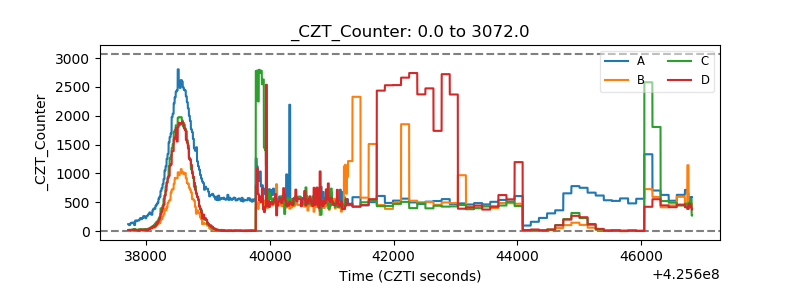 |
| +2.5 Volts monitor |  |
| +5 Volts monitor | 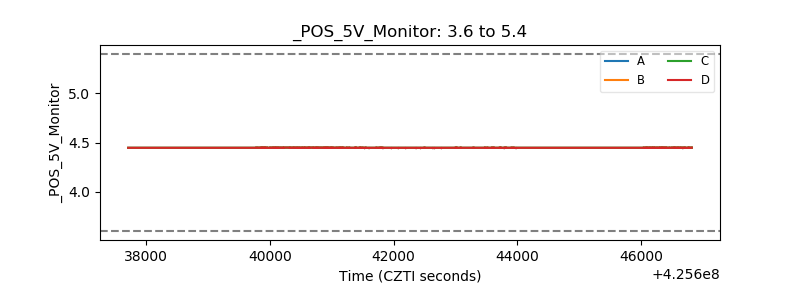 |
| _ROLL_ROT | 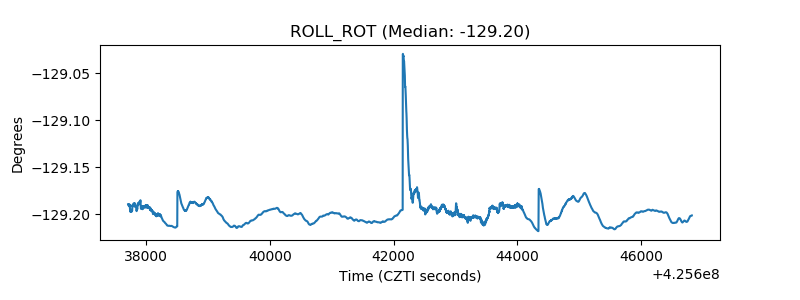 |
| _Roll_DEC | 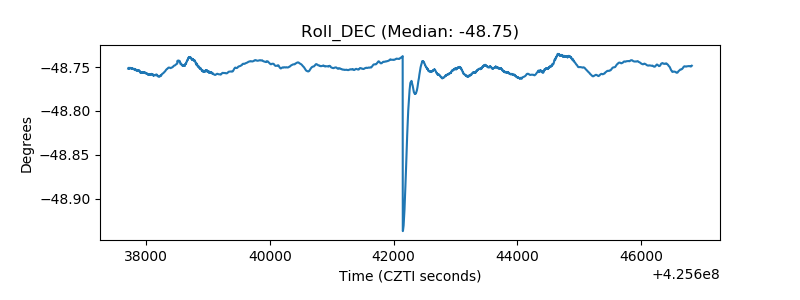 |
| _Roll_RA | 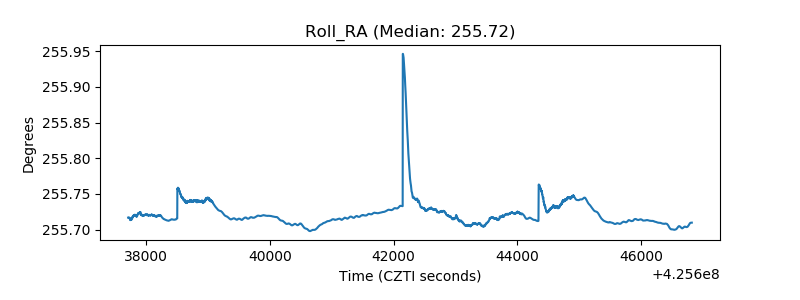 |
| Veto Counter | 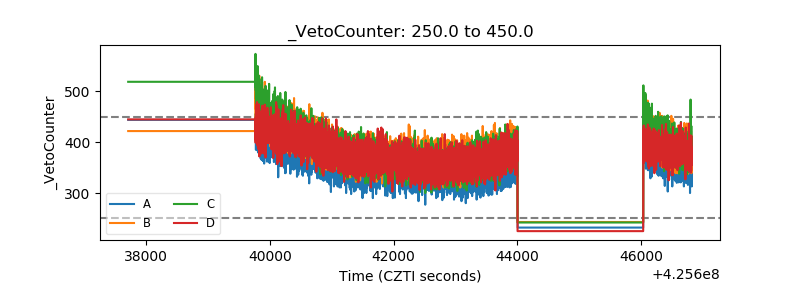 |