| Param | Original file | Final file |
|---|---|---|
| Filename | modeM0/AS1A12_099T01_9000005716_41898cztM0_level2.fits | modeM0/AS1A12_099T01_9000005716_41898cztM0_level2_quad_clean.evt |
| Size (bytes) | 403,125,120 | 86,184,000 |
| Size | 384.5 MB | 82.2 MB |
| Events in quadrant A | 5,653,309 | 534,546 |
| Events in quadrant B | 2,568,194 | 606,625 |
| Events in quadrant C | 3,251,908 | 557,339 |
| Events in quadrant D | 3,032,088 | 535,383 |
| Mode M9 | |||
|---|---|---|---|
| Quadrant | BADHDUFLAG | Total packets | Discarded packets |
| A | 0 | 31 | 0 |
| B | 0 | 31 | 0 |
| C | 0 | 31 | 0 |
| D | 0 | 32 | 0 |
| Mode M0 | |||
|---|---|---|---|
| Quadrant | BADHDUFLAG | Total packets | Discarded packets |
| A | 0 | 20483 | 3 |
| B | 0 | 11349 | 2 |
| C | 0 | 13114 | 2 |
| D | 0 | 12838 | 2 |
| Mode SS | |||
|---|---|---|---|
| Quadrant | BADHDUFLAG | Total packets | Discarded packets |
| A | 0 | 110 | 0 |
| B | 0 | 110 | 0 |
| C | 0 | 110 | 0 |
| D | 0 | 110 | 0 |
| Quadrant | Total seconds | Saturated seconds | Saturation percentage |
|---|---|---|---|
| A | 5362 | 617 | 11.506900% |
| B | 5362 | 36 | 0.671391% |
| C | 5362 | 282 | 5.259232% |
| D | 5362 | 93 | 1.734427% |
Noise dominated data is calculated using 1-second bins in cleaned event files. If a bin has >2000 counts, and if more than 50% of those come from <1% of pixels, then it is considered to be noise-dominated and hence unusable.
| Quadrant | # 1 sec bins | Bins with >0 counts | Bins with >2000 counts | High rate bins dominated by noise | Noise dominated (total time) | Noise dominated (detector-on time) | Marked lightcurve |
|---|---|---|---|---|---|---|---|
| A | 7094 | 5363 | 599 | 599 | 8.44% | 11.17% | 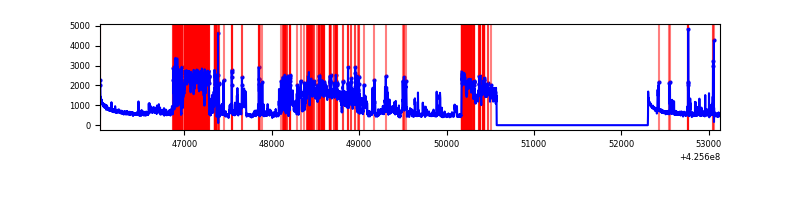 |
| B | 7094 | 5363 | 16 | 16 | 0.23% | 0.30% | 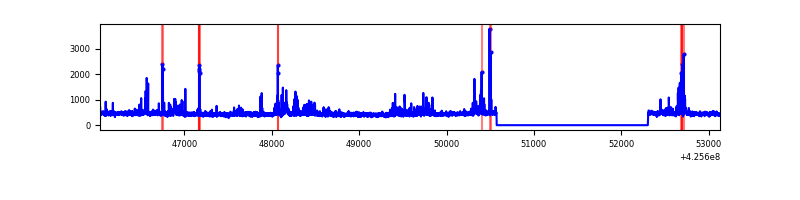 |
| C | 7094 | 5363 | 265 | 265 | 3.74% | 4.94% | 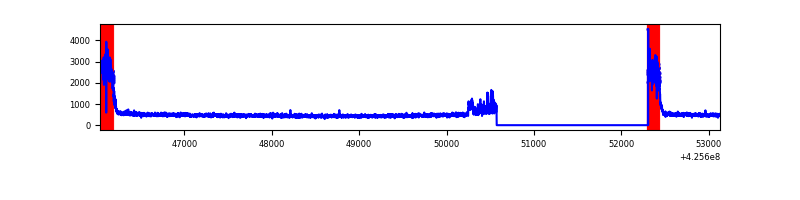 |
| D | 7094 | 5363 | 98 | 98 | 1.38% | 1.83% | 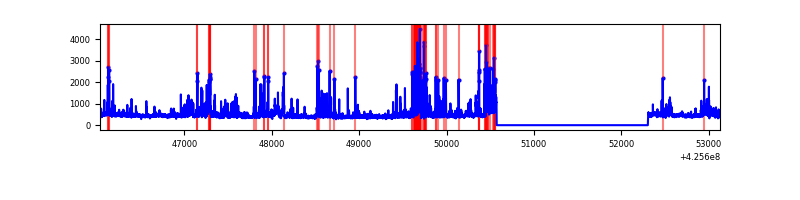 |
Top three noisy pixels from each quadrant. If the there are fewer than three noisy pixels in the level2.evt file, extra rows are filled as -1
| Pixel properties | Quadrant properties | ||||||
|---|---|---|---|---|---|---|---|
| Quadrant | DetID | PixID | Counts | Sigma | Mean | Median | Sigma |
| A | 14 | 24 | 2934064 | 25388.45 | 562 | 550 | 115.5 |
| A | 10 | 83 | 533498 | 4612.46 | 562 | 550 | 115.5 |
| A | 2 | 79 | 8433 | 68.22 | 562 | 550 | 115.5 |
| B | 5 | 255 | 170598 | 1521.06 | 578 | 561 | 111.8 |
| B | 0 | 190 | 63147 | 559.86 | 578 | 561 | 111.8 |
| B | 0 | 245 | 32851 | 288.85 | 578 | 561 | 111.8 |
| C | 0 | 10 | 789079 | 6193.18 | 544 | 546 | 127.3 |
| C | 15 | 214 | 209578 | 1641.75 | 544 | 546 | 127.3 |
| C | 14 | 254 | 101412 | 792.2 | 544 | 546 | 127.3 |
| D | 12 | 6 | 269093 | 1942.45 | 564 | 547 | 138.3 |
| D | 12 | 79 | 116453 | 838.37 | 564 | 547 | 138.3 |
| D | 5 | 222 | 105744 | 760.91 | 564 | 547 | 138.3 |
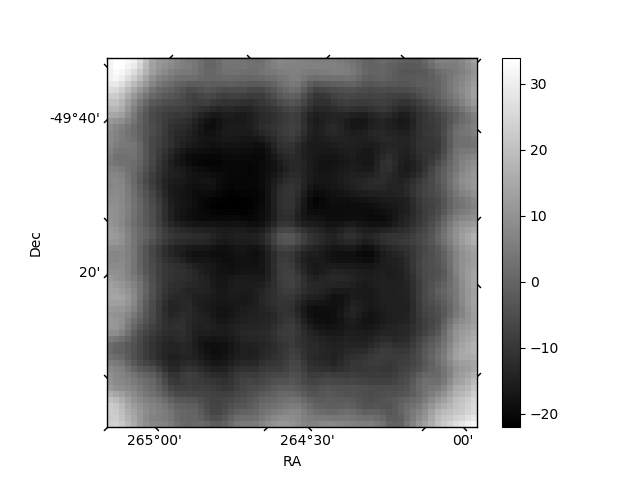
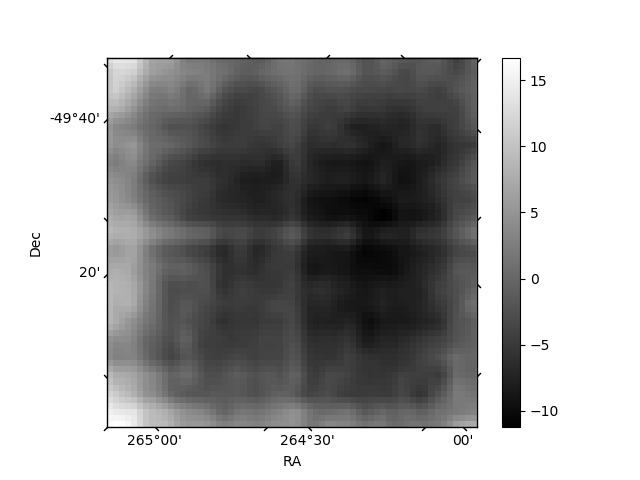
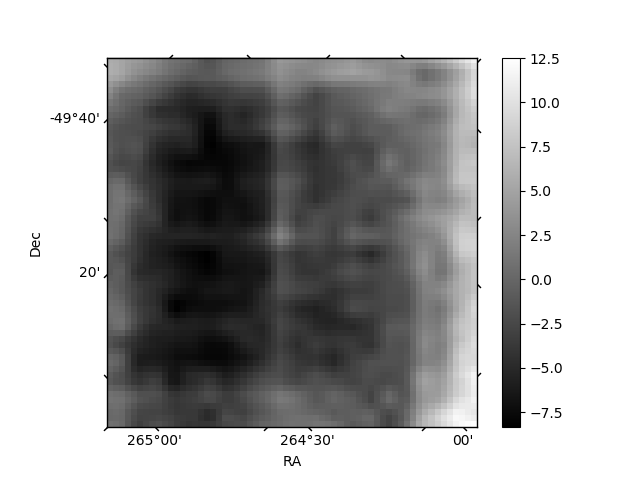
Histogram calculated using DETX and DETY for each event in the final _common_clean file
| Quadrant A | 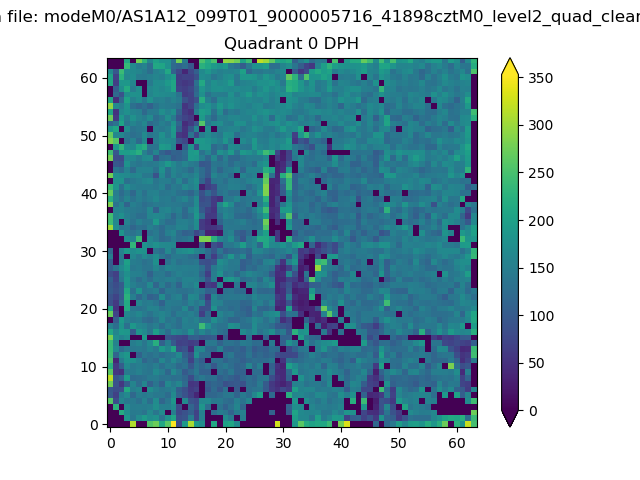 |
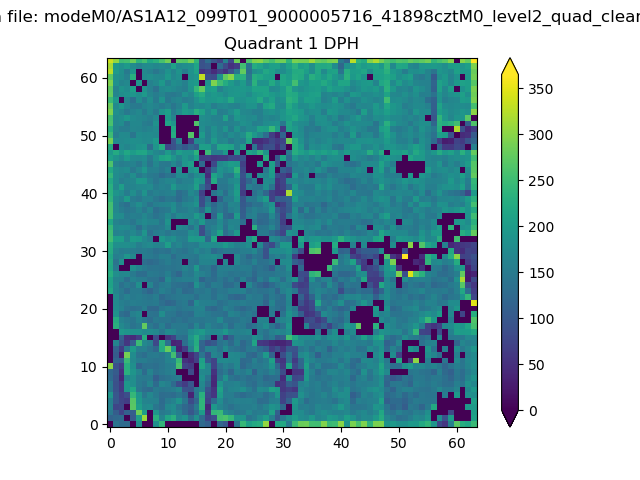 |
Quadrant B |
|---|---|---|---|
| Quadrant D | 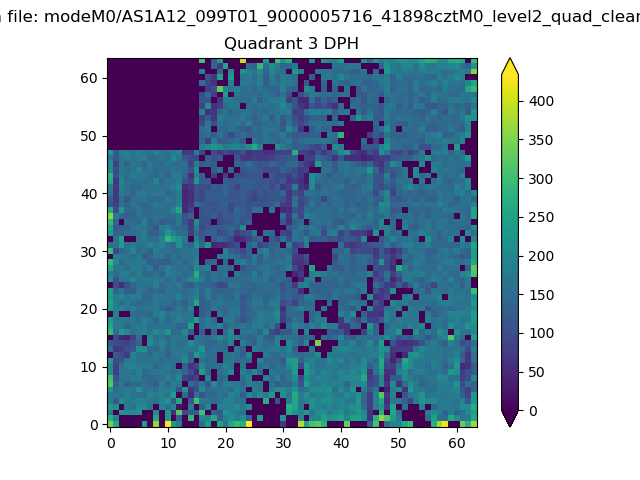 |
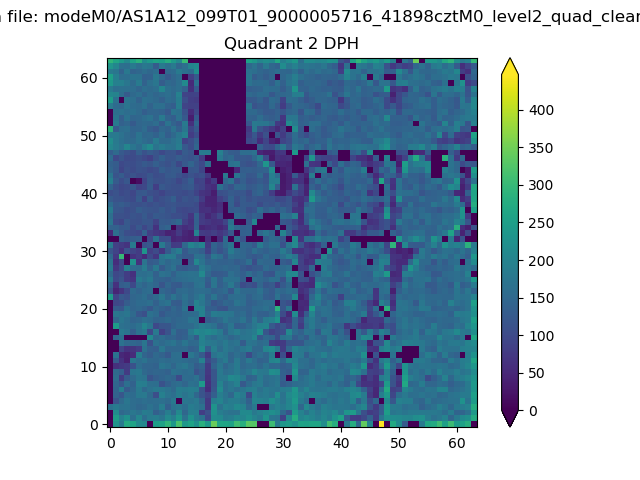 |
Quadrant C |
| Plot type | Count rate plots | Images |
|---|---|---|
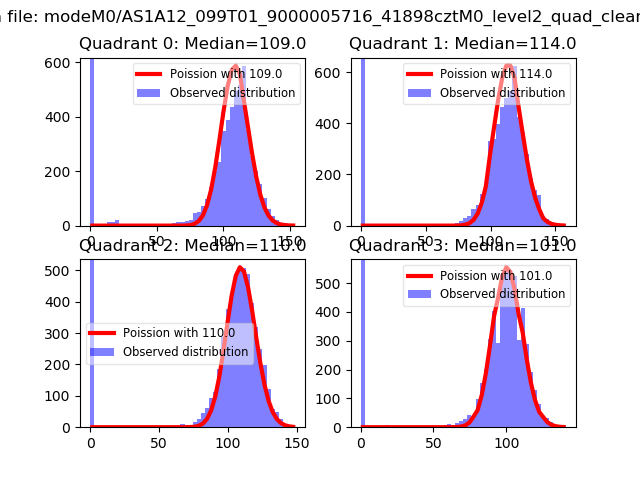
| Comparison with Poisson distribution Blue bars denote a histogram of data divided into 1 sec bins. Red curve is a Poisson curve with rate = median count rate of data. |
 |
 |
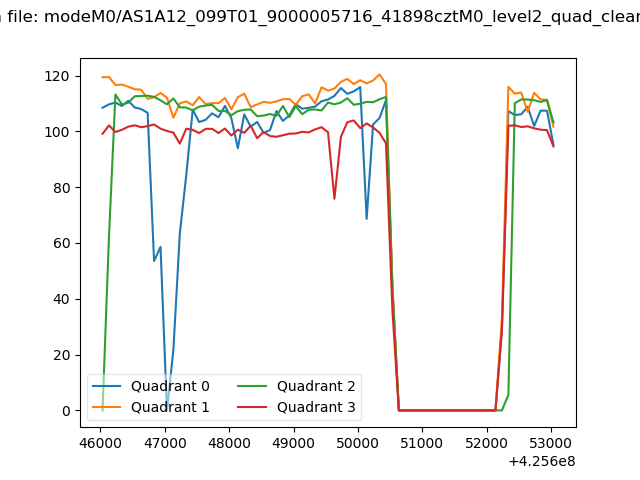
| Quadrant-wise count rates Data is divided into 100 sec bins |
 |
|
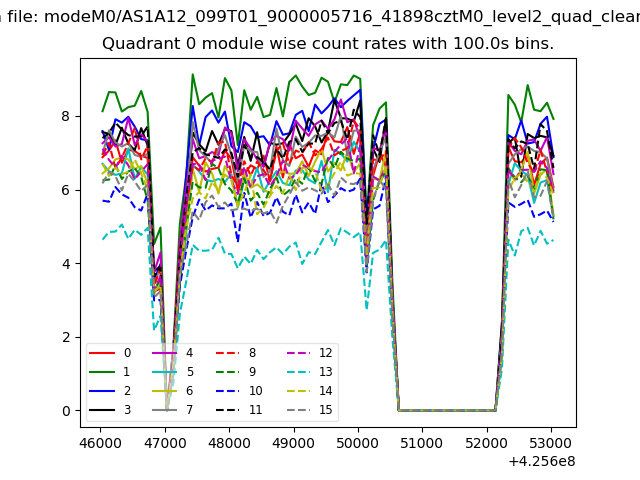
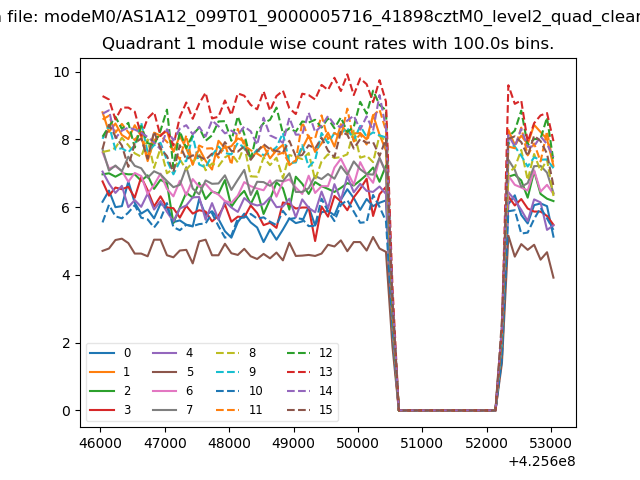
| Module-wise count rates for Quadrant A Data is divided into 100 sec bins |
 |
 |
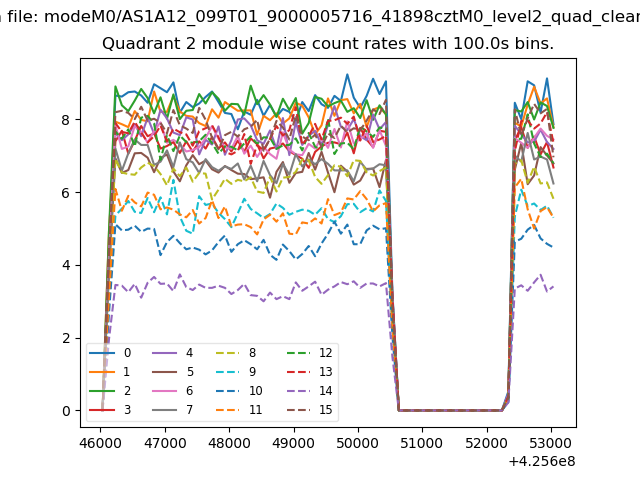
| Module-wise count rates for Quadrant B Data is divided into 100 sec bins |
 |
 |
| Module-wise count rates for Quadrant C Data is divided into 100 sec bins |
 |
 |
| Module-wise count rates for Quadrant D Data is divided into 100 sec bins |
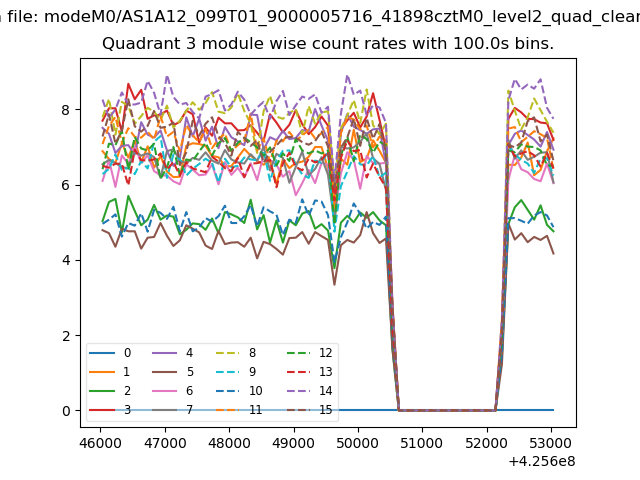 |
 |
| Parameter | Plot |
|---|---|
| CZT HV Monitor | 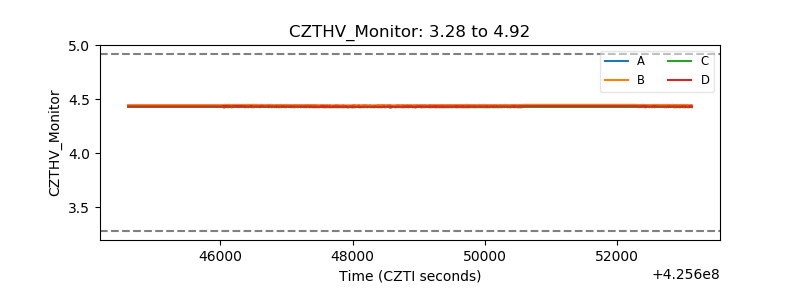 |
| D_VDD | 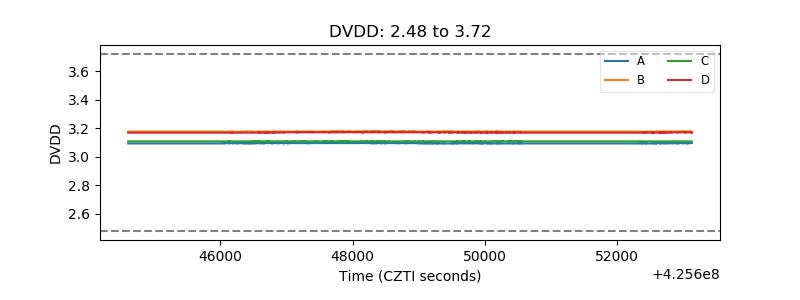 |
| Temperature 1 | 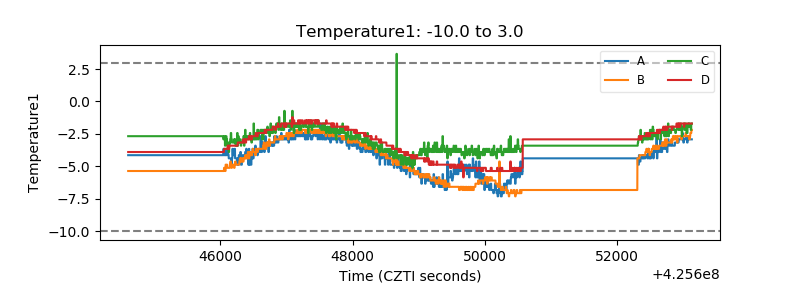 |
| Veto HV Monitor | 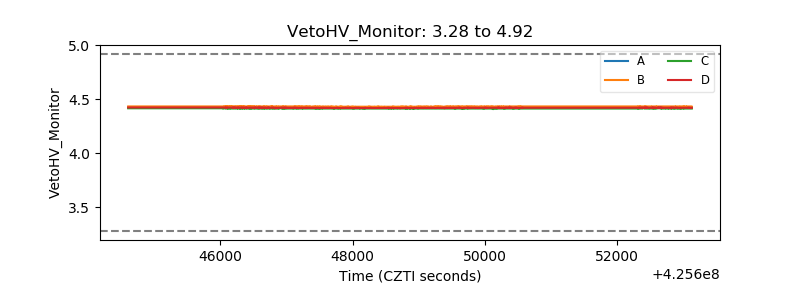 |
| Veto LLD | 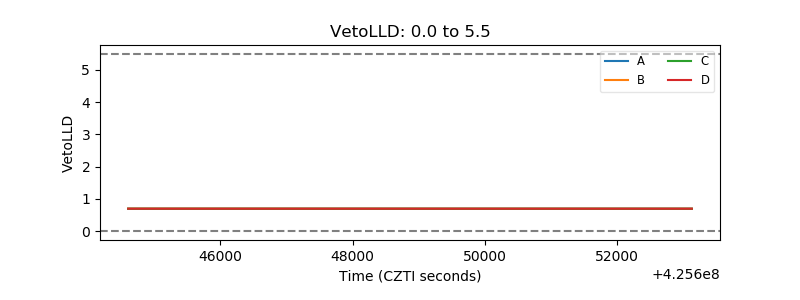 |
| Alpha Counter | 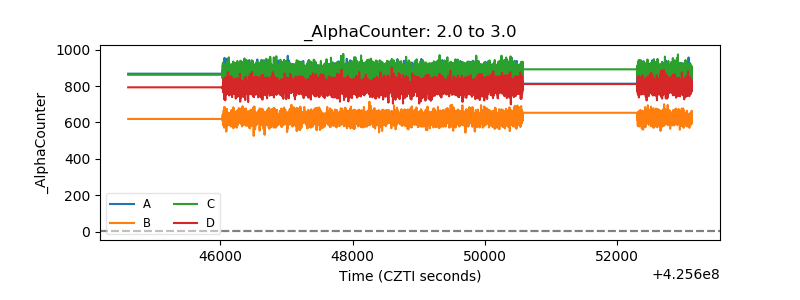 |
| _CPM_Rate |  |
| CZT Counter | 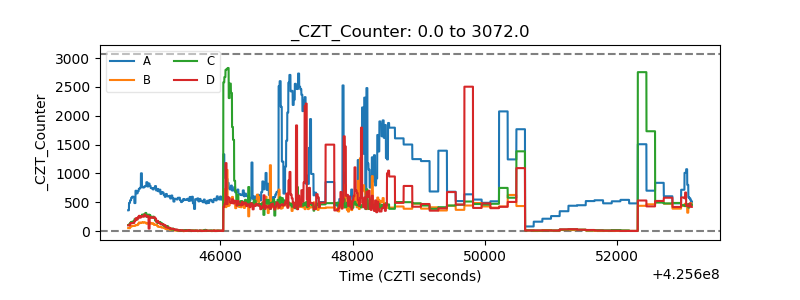 |
| +2.5 Volts monitor | 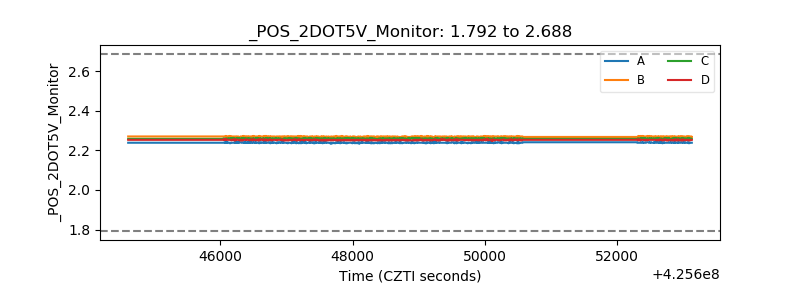 |
| +5 Volts monitor | 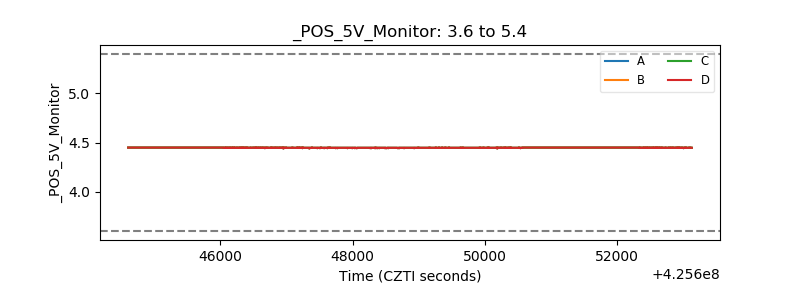 |
| _ROLL_ROT | 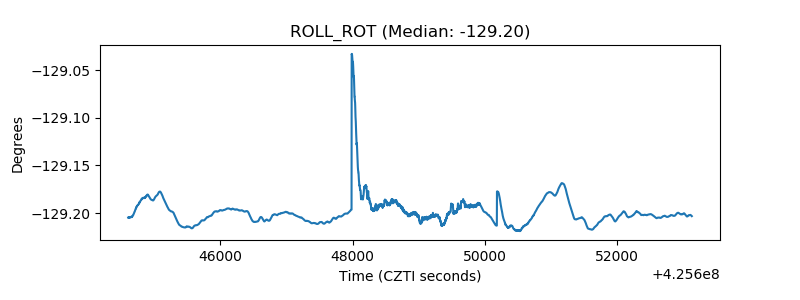 |
| _Roll_DEC | 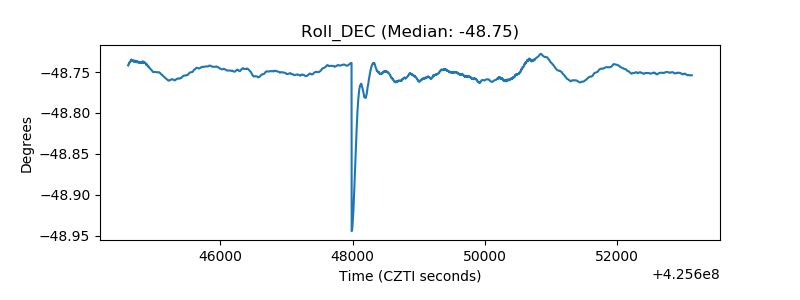 |
| _Roll_RA | 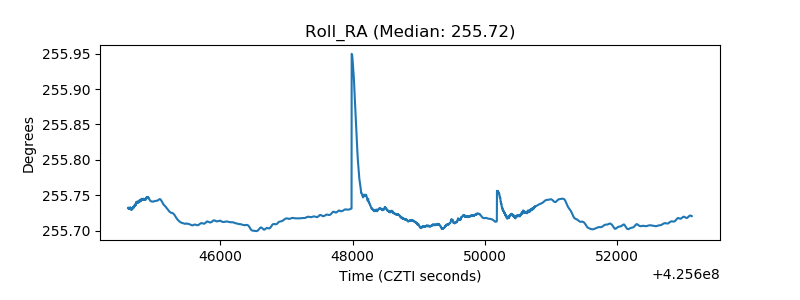 |
| Veto Counter | 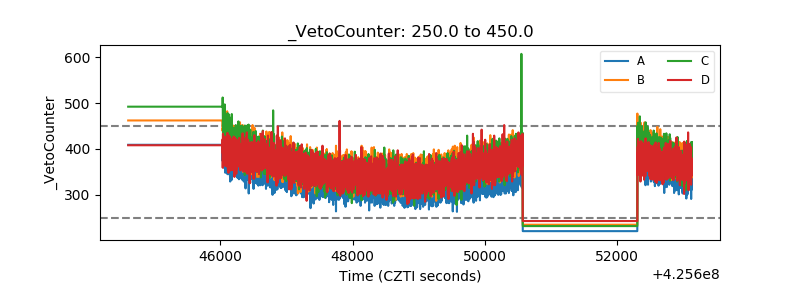 |