| Param | Original file | Final file |
|---|---|---|
| Filename | modeM0/AS1A12_099T01_9000005716_41899cztM0_level2.fits | modeM0/AS1A12_099T01_9000005716_41899cztM0_level2_quad_clean.evt |
| Size (bytes) | 364,780,800 | 90,717,120 |
| Size | 347.9 MB | 86.5 MB |
| Events in quadrant A | 3,827,877 | 597,752 |
| Events in quadrant B | 2,814,260 | 626,613 |
| Events in quadrant C | 3,232,979 | 576,086 |
| Events in quadrant D | 3,190,069 | 552,798 |
| Mode M9 | |||
|---|---|---|---|
| Quadrant | BADHDUFLAG | Total packets | Discarded packets |
| A | 0 | 21 | 0 |
| B | 0 | 21 | 0 |
| C | 0 | 22 | 0 |
| D | 0 | 22 | 0 |
| Mode M0 | |||
|---|---|---|---|
| Quadrant | BADHDUFLAG | Total packets | Discarded packets |
| A | 0 | 14956 | 3 |
| B | 0 | 12382 | 2 |
| C | 0 | 13243 | 2 |
| D | 0 | 13482 | 2 |
| Mode SS | |||
|---|---|---|---|
| Quadrant | BADHDUFLAG | Total packets | Discarded packets |
| A | 0 | 116 | 0 |
| B | 0 | 116 | 0 |
| C | 0 | 116 | 0 |
| D | 0 | 116 | 0 |
| Quadrant | Total seconds | Saturated seconds | Saturation percentage |
|---|---|---|---|
| A | 5623 | 207 | 3.681309% |
| B | 5623 | 73 | 1.298239% |
| C | 5623 | 275 | 4.890628% |
| D | 5623 | 112 | 1.991819% |
Noise dominated data is calculated using 1-second bins in cleaned event files. If a bin has >2000 counts, and if more than 50% of those come from <1% of pixels, then it is considered to be noise-dominated and hence unusable.
| Quadrant | # 1 sec bins | Bins with >0 counts | Bins with >2000 counts | High rate bins dominated by noise | Noise dominated (total time) | Noise dominated (detector-on time) | Marked lightcurve |
|---|---|---|---|---|---|---|---|
| A | 7026 | 5624 | 170 | 170 | 2.42% | 3.02% | 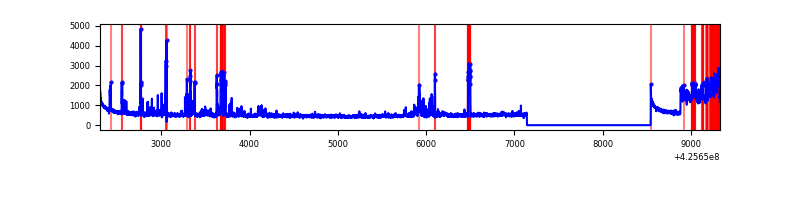 |
| B | 7026 | 5624 | 48 | 48 | 0.68% | 0.85% | 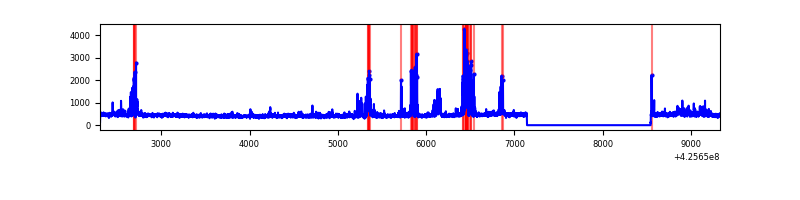 |
| C | 7026 | 5624 | 258 | 258 | 3.67% | 4.59% | 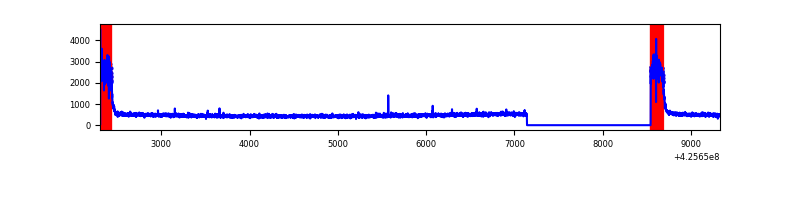 |
| D | 7026 | 5624 | 131 | 131 | 1.86% | 2.33% | 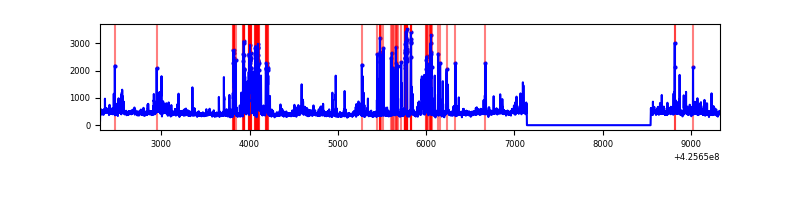 |
Top three noisy pixels from each quadrant. If the there are fewer than three noisy pixels in the level2.evt file, extra rows are filled as -1
| Pixel properties | Quadrant properties | ||||||
|---|---|---|---|---|---|---|---|
| Quadrant | DetID | PixID | Counts | Sigma | Mean | Median | Sigma |
| A | 10 | 83 | 540744 | 4349.02 | 601 | 590 | 124.2 |
| A | 6 | 10 | 540732 | 4348.92 | 601 | 590 | 124.2 |
| A | 14 | 24 | 355991 | 2861.49 | 601 | 590 | 124.2 |
| B | 5 | 255 | 396646 | 3371.13 | 600 | 582 | 117.5 |
| B | 0 | 190 | 38514 | 322.86 | 600 | 582 | 117.5 |
| B | 12 | 111 | 15071 | 123.32 | 600 | 582 | 117.5 |
| C | 0 | 10 | 763889 | 5670.72 | 570 | 573 | 134.6 |
| C | 15 | 214 | 217374 | 1610.63 | 570 | 573 | 134.6 |
| C | 0 | 15 | 26670 | 193.88 | 570 | 573 | 134.6 |
| D | 10 | 199 | 303907 | 2112.0 | 585 | 568 | 143.6 |
| D | 12 | 6 | 228266 | 1585.35 | 585 | 568 | 143.6 |
| D | 13 | 249 | 116379 | 806.33 | 585 | 568 | 143.6 |
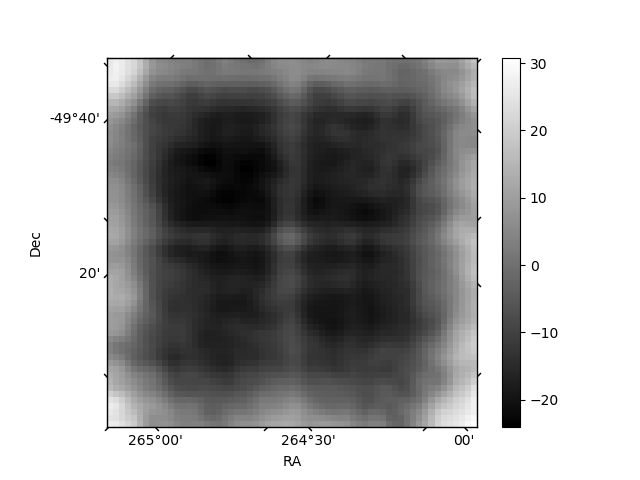
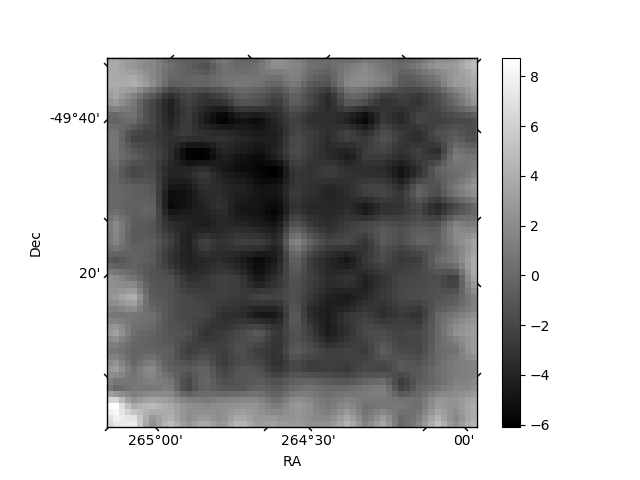
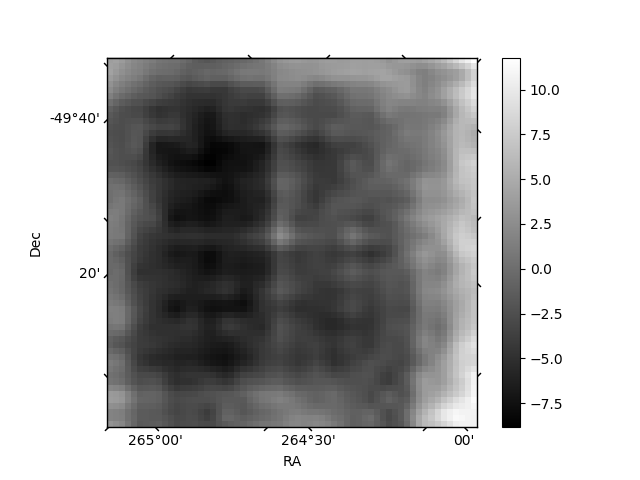
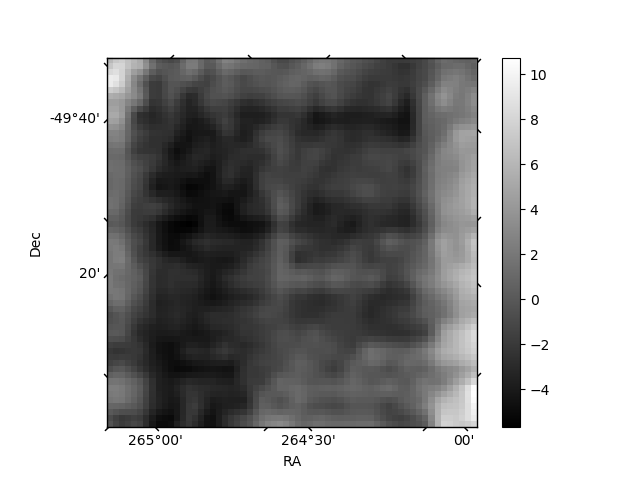
Histogram calculated using DETX and DETY for each event in the final _common_clean file
| Quadrant A | 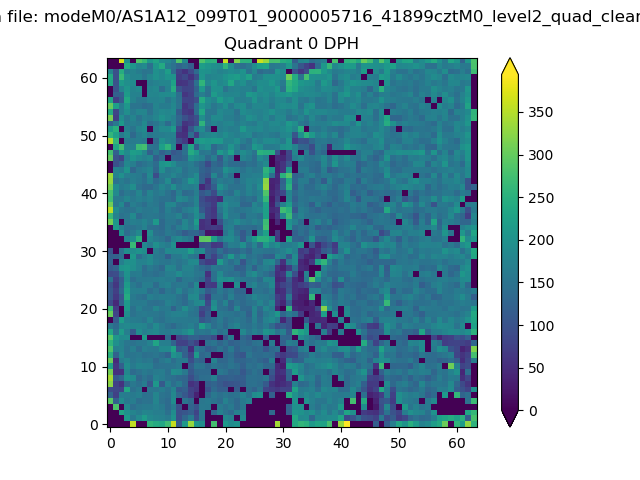 |
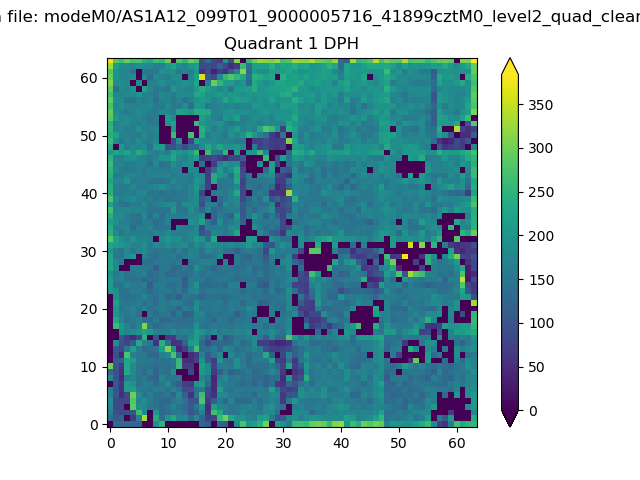 |
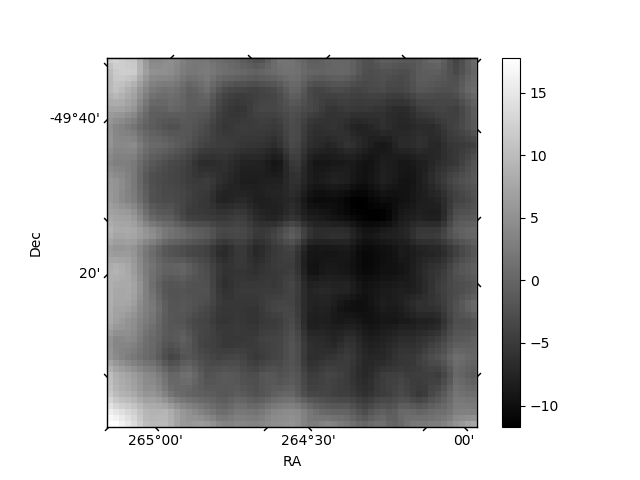
Quadrant B |
|---|---|---|---|
| Quadrant D | 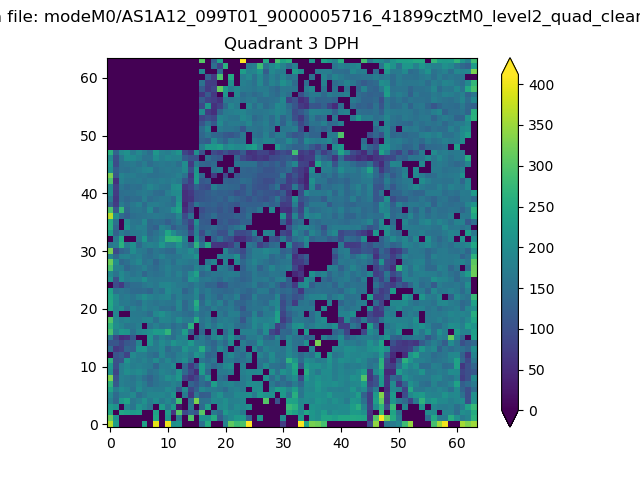 |
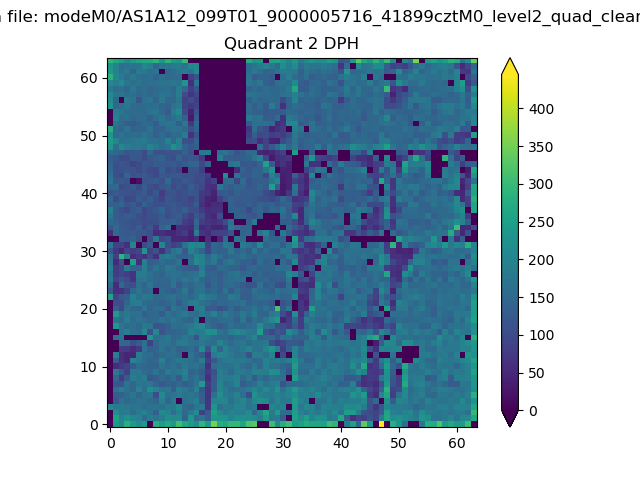 |
Quadrant C |
| Plot type | Count rate plots | Images |
|---|---|---|
| Comparison with Poisson distribution Blue bars denote a histogram of data divided into 1 sec bins. Red curve is a Poisson curve with rate = median count rate of data. |
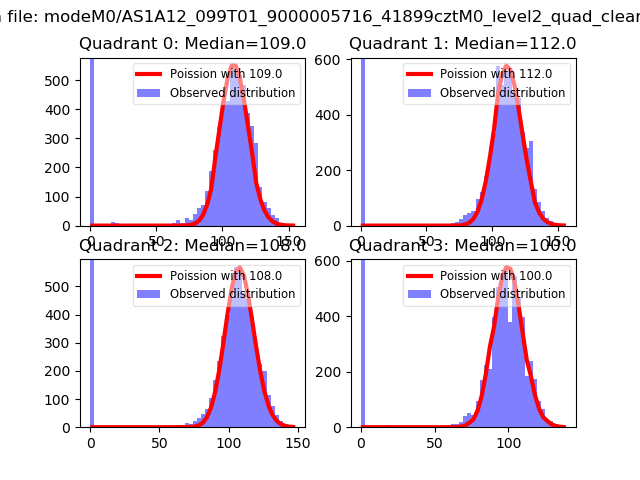 |
 |
| Quadrant-wise count rates Data is divided into 100 sec bins |
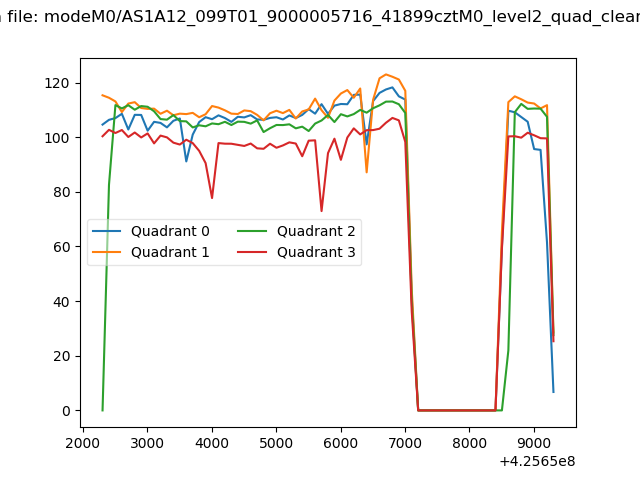 |
|
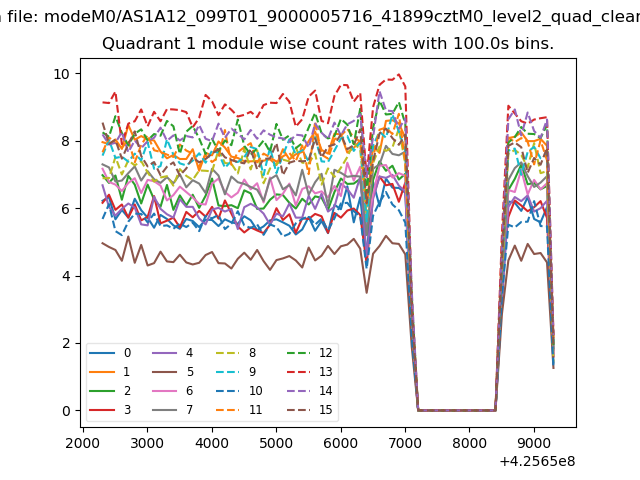
| Module-wise count rates for Quadrant A Data is divided into 100 sec bins |
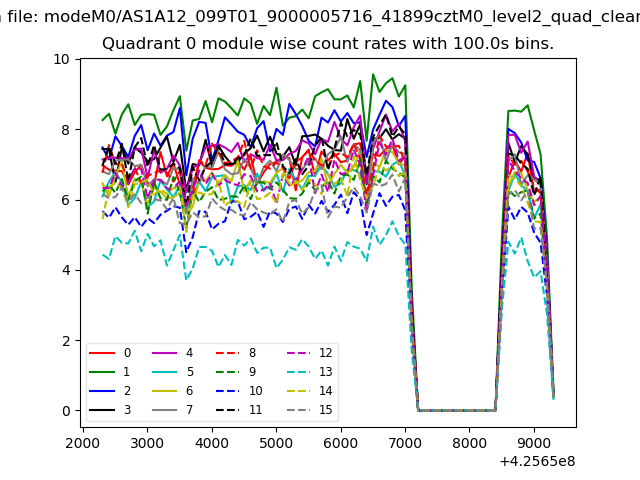 |
 |
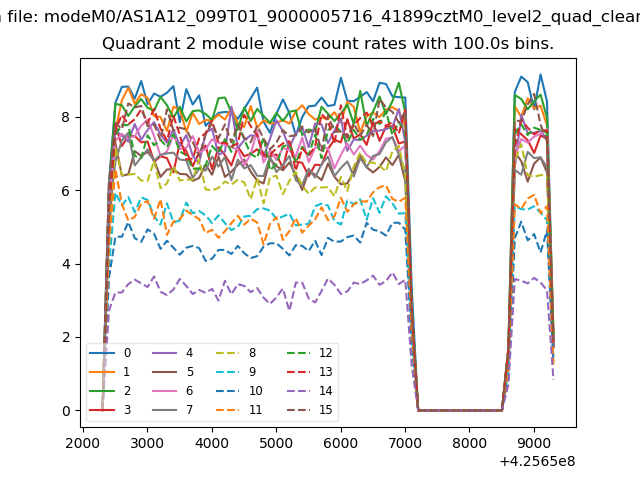
| Module-wise count rates for Quadrant B Data is divided into 100 sec bins |
 |
 |
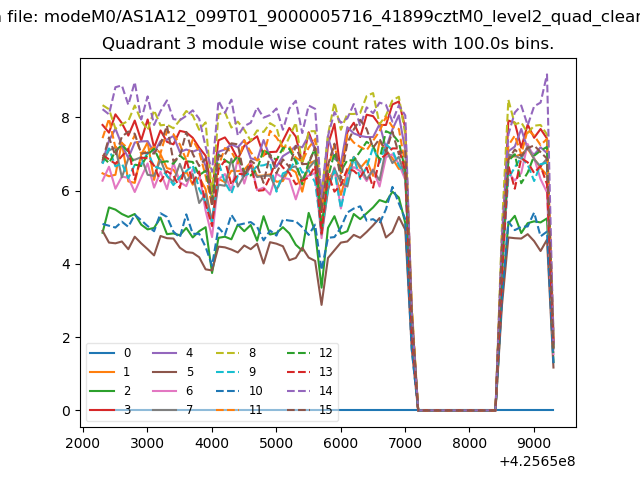
| Module-wise count rates for Quadrant C Data is divided into 100 sec bins |
 |
 |
| Module-wise count rates for Quadrant D Data is divided into 100 sec bins |
 |
 |
| Parameter | Plot |
|---|---|
| CZT HV Monitor | 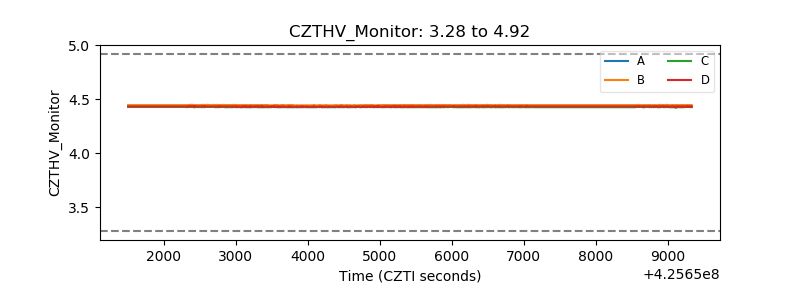 |
| D_VDD | 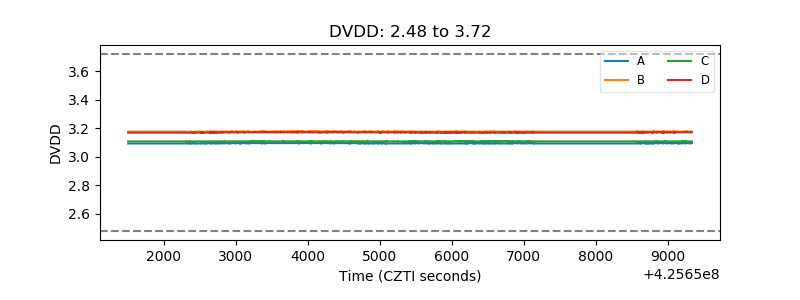 |
| Temperature 1 | 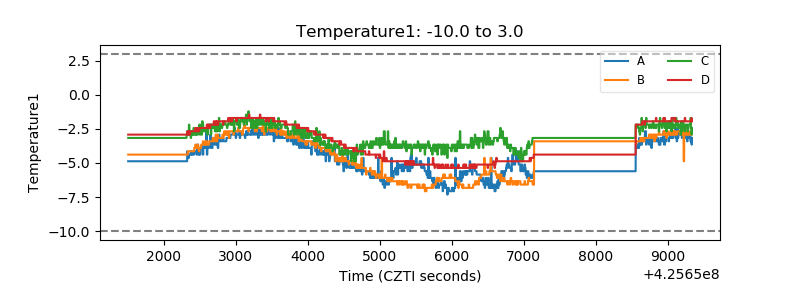 |
| Veto HV Monitor | 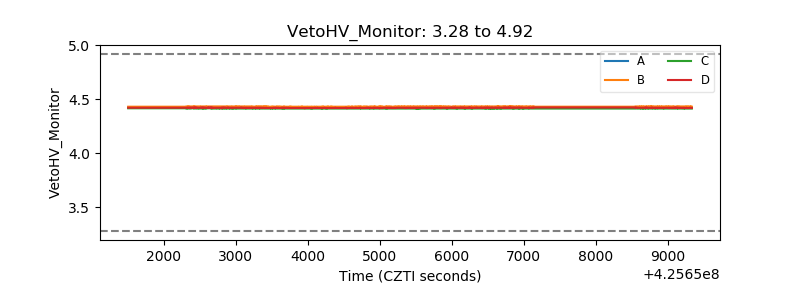 |
| Veto LLD | 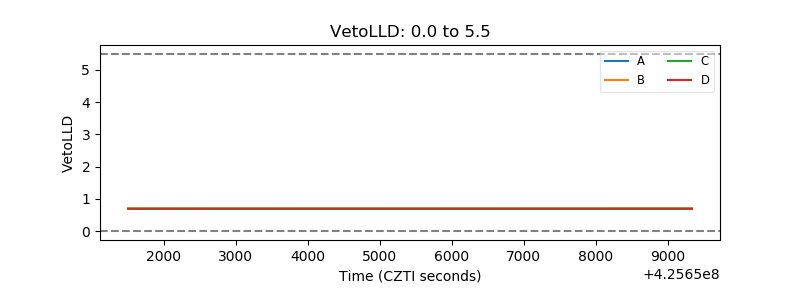 |
| Alpha Counter | 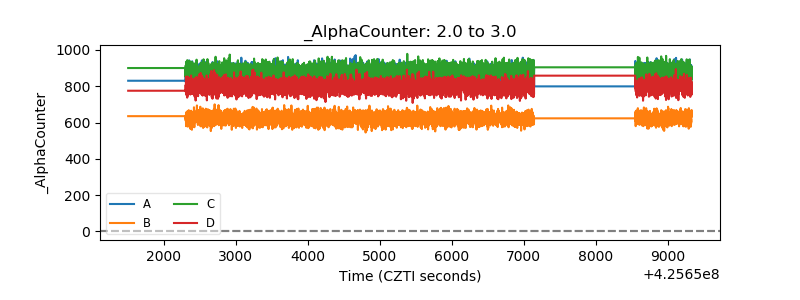 |
| _CPM_Rate | 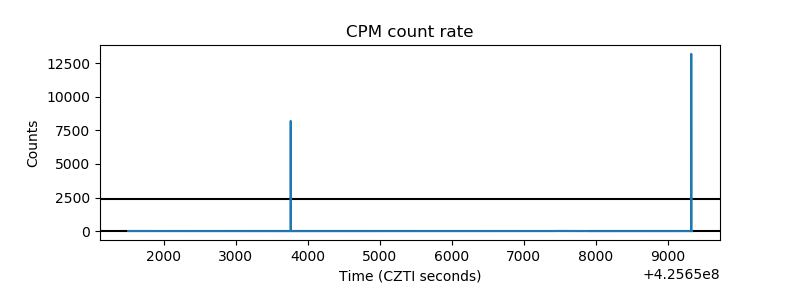 |
| CZT Counter | 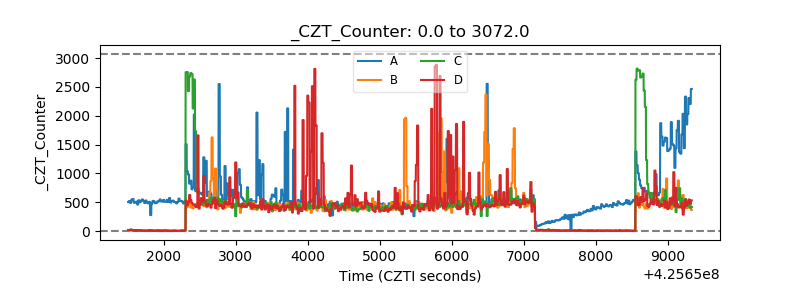 |
| +2.5 Volts monitor |  |
| +5 Volts monitor | 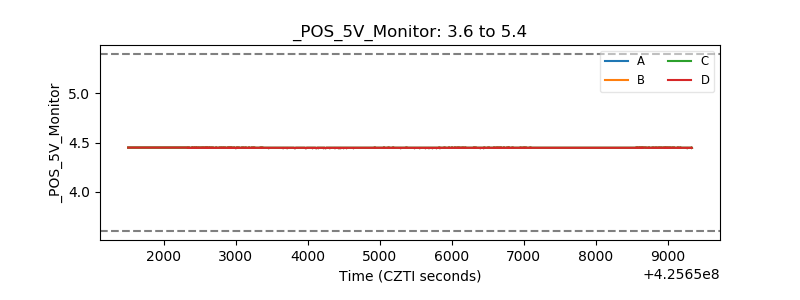 |
| _ROLL_ROT | 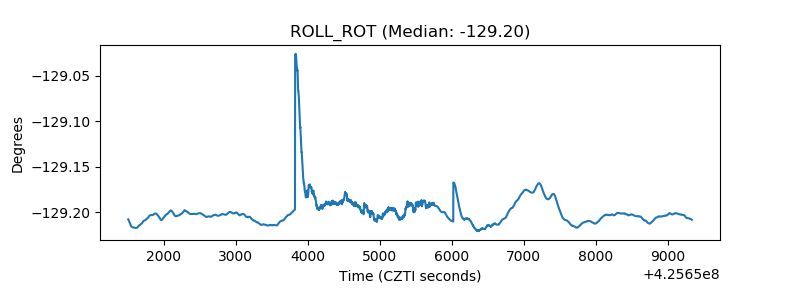 |
| _Roll_DEC | 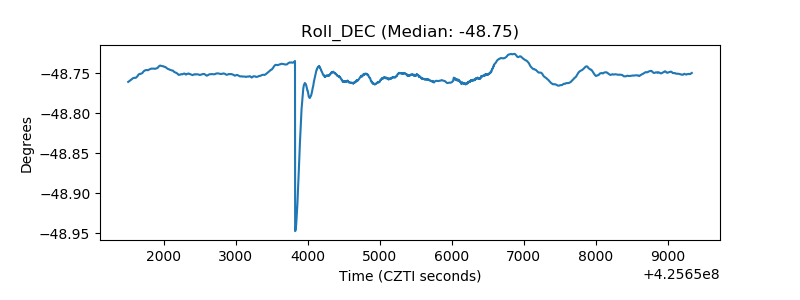 |
| _Roll_RA | 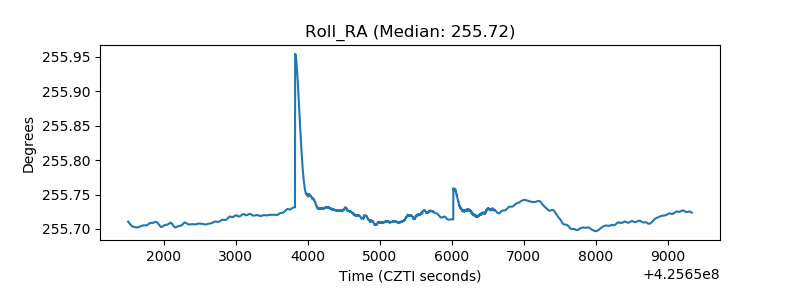 |
| Veto Counter | 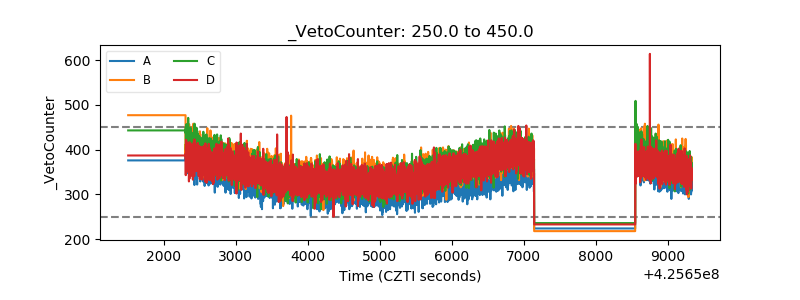 |