| Param | Original file | Final file |
|---|---|---|
| Filename | modeM0/AS1A12_099T01_9000005716_41900cztM0_level2.fits | modeM0/AS1A12_099T01_9000005716_41900cztM0_level2_quad_clean.evt |
| Size (bytes) | 533,666,880 | 106,061,760 |
| Size | 508.9 MB | 101.1 MB |
| Events in quadrant A | 8,020,281 | 674,342 |
| Events in quadrant B | 3,270,881 | 745,431 |
| Events in quadrant C | 3,761,246 | 681,814 |
| Events in quadrant D | 4,185,576 | 645,490 |
| Mode M9 | |||
|---|---|---|---|
| Quadrant | BADHDUFLAG | Total packets | Discarded packets |
| A | 0 | 27 | 0 |
| B | 0 | 27 | 0 |
| C | 0 | 27 | 0 |
| D | 0 | 27 | 0 |
| Mode M0 | |||
|---|---|---|---|
| Quadrant | BADHDUFLAG | Total packets | Discarded packets |
| A | 0 | 28248 | 2 |
| B | 0 | 14368 | 2 |
| C | 0 | 15395 | 2 |
| D | 0 | 17180 | 2 |
| Mode SS | |||
|---|---|---|---|
| Quadrant | BADHDUFLAG | Total packets | Discarded packets |
| A | 0 | 136 | 0 |
| B | 0 | 136 | 0 |
| C | 0 | 136 | 0 |
| D | 0 | 136 | 0 |
| Quadrant | Total seconds | Saturated seconds | Saturation percentage |
|---|---|---|---|
| A | 6662 | 687 | 10.312219% |
| B | 6663 | 28 | 0.420231% |
| C | 6663 | 267 | 4.007204% |
| D | 6663 | 185 | 2.776527% |
Noise dominated data is calculated using 1-second bins in cleaned event files. If a bin has >2000 counts, and if more than 50% of those come from <1% of pixels, then it is considered to be noise-dominated and hence unusable.
| Quadrant | # 1 sec bins | Bins with >0 counts | Bins with >2000 counts | High rate bins dominated by noise | Noise dominated (total time) | Noise dominated (detector-on time) | Marked lightcurve |
|---|---|---|---|---|---|---|---|
| A | 9348 | 6664 | 796 | 796 | 8.52% | 11.94% | 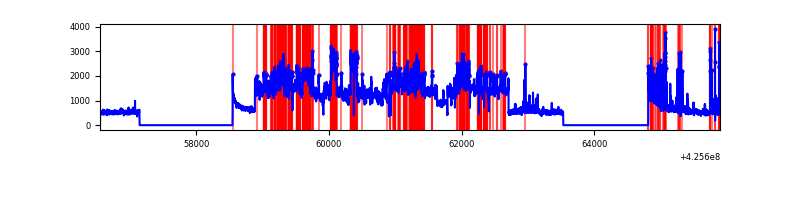 |
| B | 9349 | 6665 | 11 | 11 | 0.12% | 0.17% | 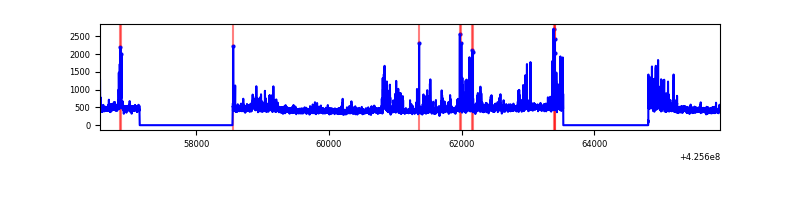 |
| C | 9349 | 6665 | 258 | 258 | 2.76% | 3.87% |  |
| D | 9349 | 6665 | 153 | 153 | 1.64% | 2.30% | 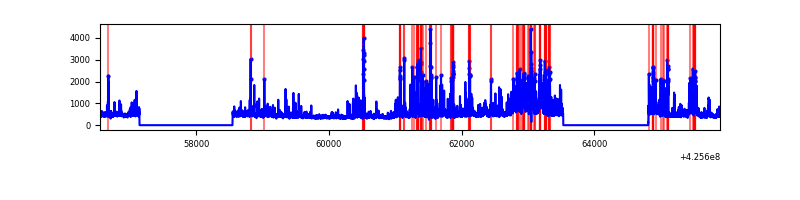 |
Top three noisy pixels from each quadrant. If the there are fewer than three noisy pixels in the level2.evt file, extra rows are filled as -1
| Pixel properties | Quadrant properties | ||||||
|---|---|---|---|---|---|---|---|
| Quadrant | DetID | PixID | Counts | Sigma | Mean | Median | Sigma |
| A | 6 | 10 | 4208606 | 29031.02 | 702 | 688 | 144.9 |
| A | 10 | 83 | 600437 | 4137.75 | 702 | 688 | 144.9 |
| A | 14 | 24 | 473827 | 3264.25 | 702 | 688 | 144.9 |
| B | 5 | 255 | 352650 | 2524.39 | 719 | 699 | 139.4 |
| B | 0 | 190 | 70159 | 498.21 | 719 | 699 | 139.4 |
| B | 12 | 111 | 18283 | 126.12 | 719 | 699 | 139.4 |
| C | 0 | 10 | 797092 | 4919.28 | 686 | 688 | 161.9 |
| C | 15 | 214 | 257272 | 1584.89 | 686 | 688 | 161.9 |
| C | 0 | 15 | 30844 | 186.27 | 686 | 688 | 161.9 |
| D | 12 | 79 | 417966 | 2440.86 | 697 | 675 | 171.0 |
| D | 5 | 222 | 394625 | 2304.33 | 697 | 675 | 171.0 |
| D | 12 | 6 | 302601 | 1766.06 | 697 | 675 | 171.0 |
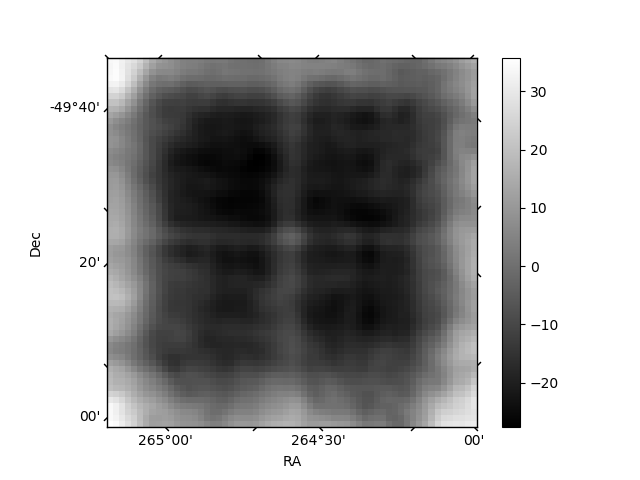
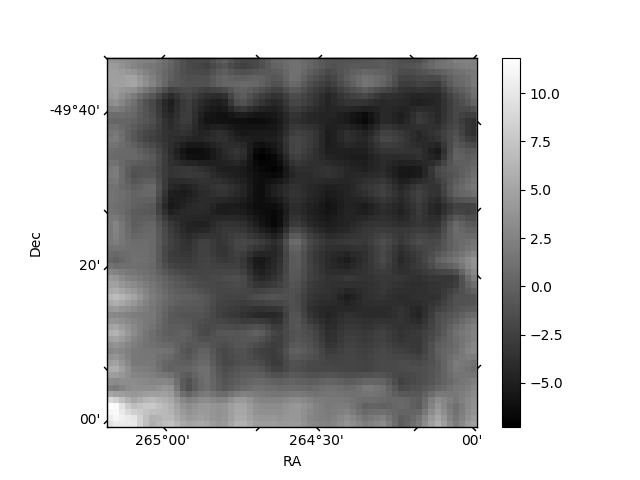
Histogram calculated using DETX and DETY for each event in the final _common_clean file
| Quadrant A | 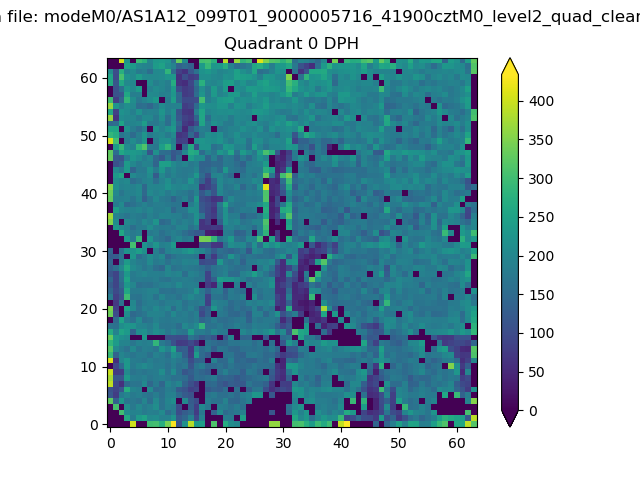 |
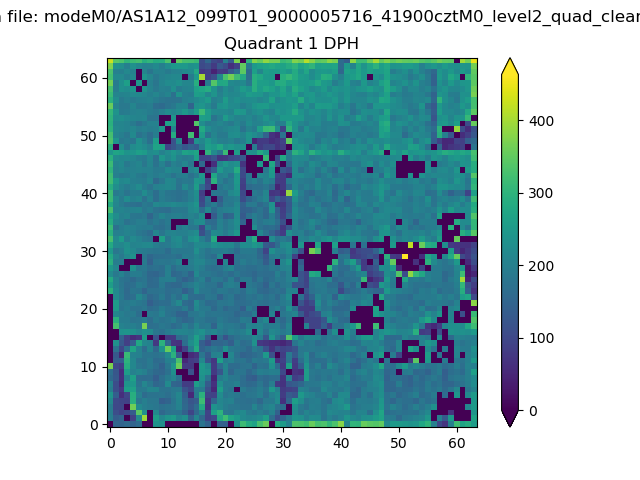 |
Quadrant B |
|---|---|---|---|
| Quadrant D | 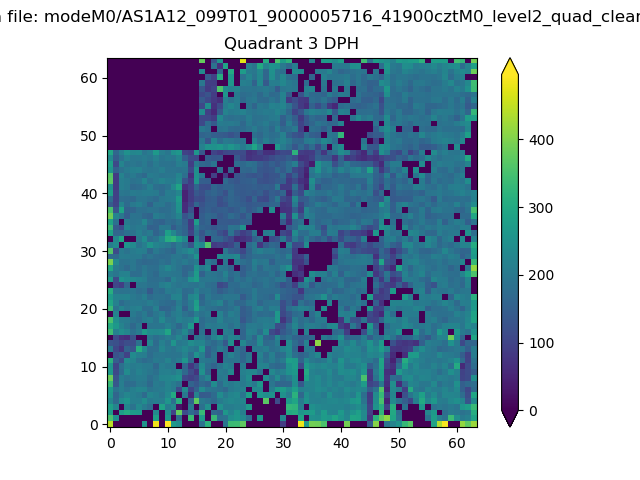 |
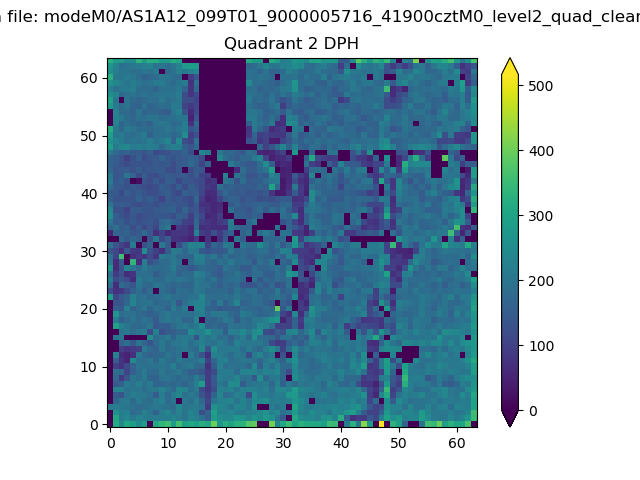 |
Quadrant C |
| Plot type | Count rate plots | Images |
|---|---|---|
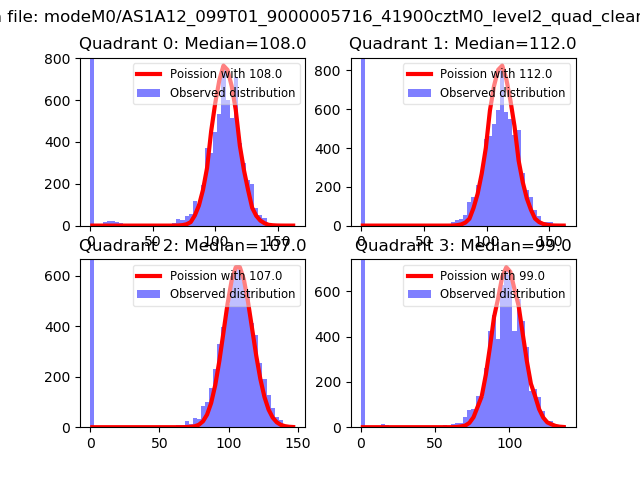
| Comparison with Poisson distribution Blue bars denote a histogram of data divided into 1 sec bins. Red curve is a Poisson curve with rate = median count rate of data. |
 |
 |
| Quadrant-wise count rates Data is divided into 100 sec bins |
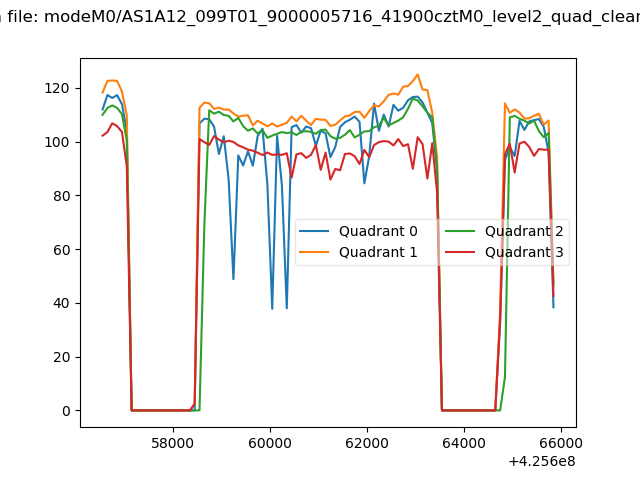 |
|
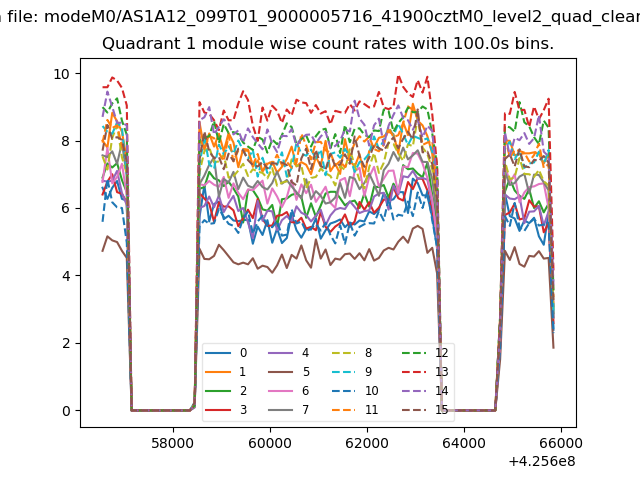
| Module-wise count rates for Quadrant A Data is divided into 100 sec bins |
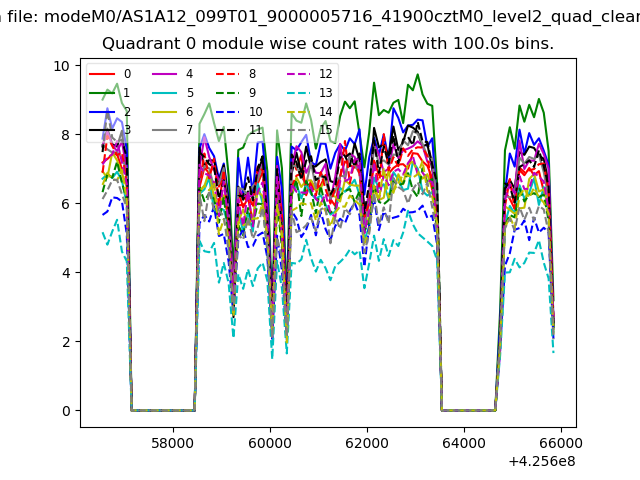 |
 |
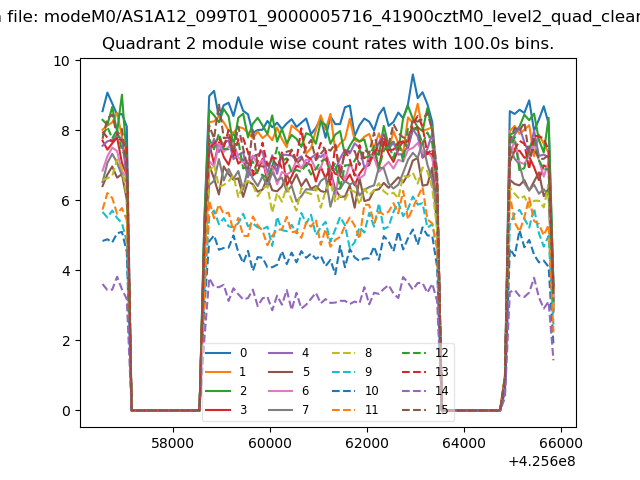
| Module-wise count rates for Quadrant B Data is divided into 100 sec bins |
 |
 |
| Module-wise count rates for Quadrant C Data is divided into 100 sec bins |
 |
 |
| Module-wise count rates for Quadrant D Data is divided into 100 sec bins |
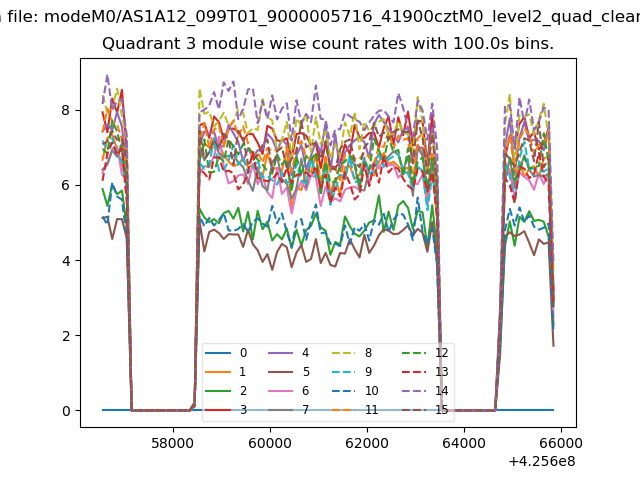 |
 |
| Parameter | Plot |
|---|---|
| CZT HV Monitor | 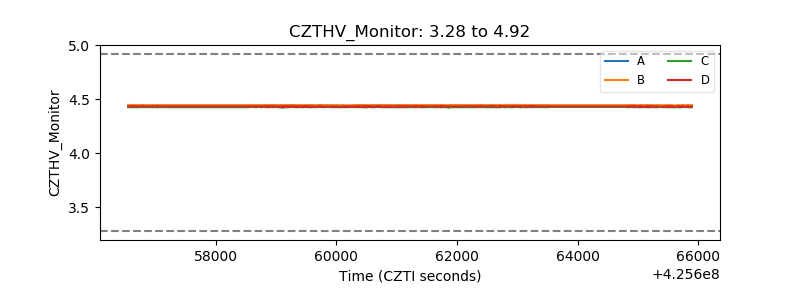 |
| D_VDD | 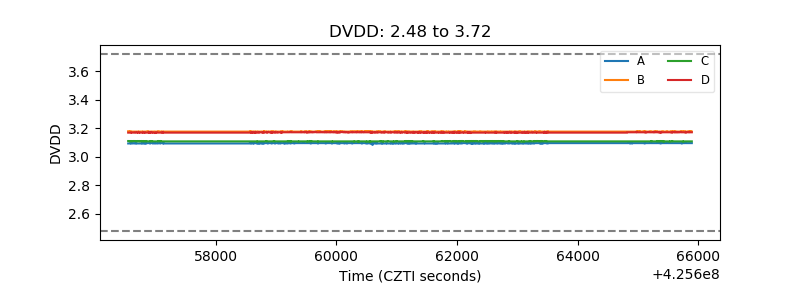 |
| Temperature 1 | 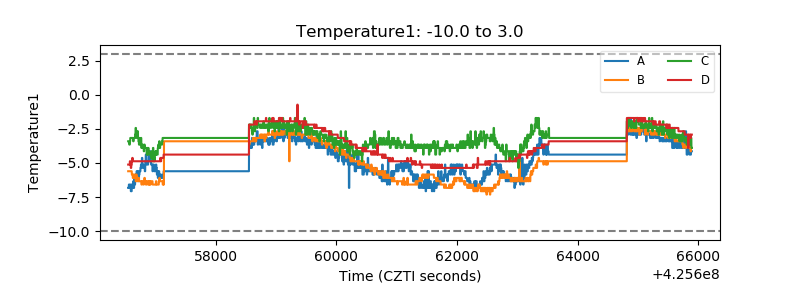 |
| Veto HV Monitor | 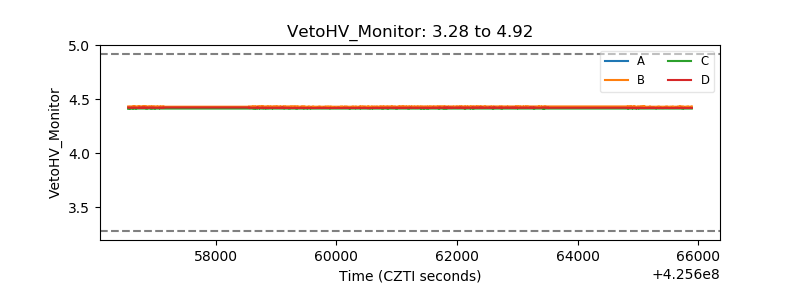 |
| Veto LLD | 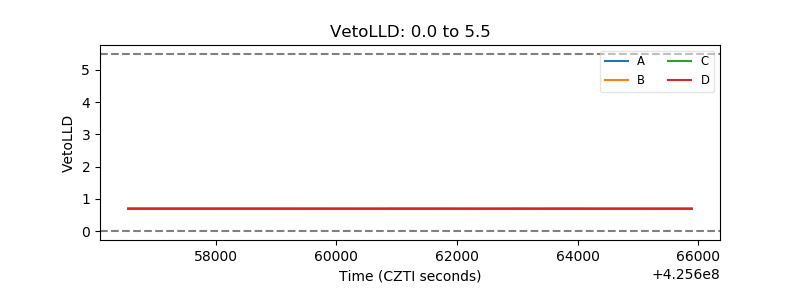 |
| Alpha Counter | 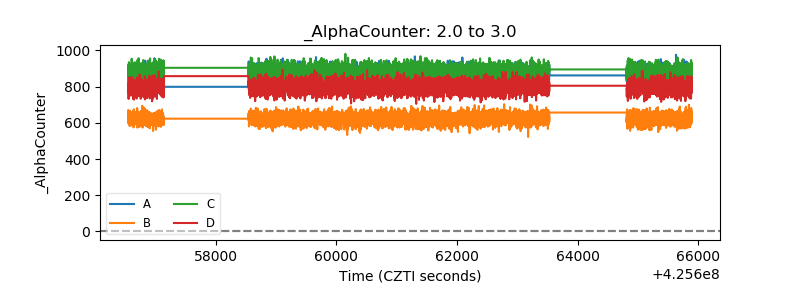 |
| _CPM_Rate |  |
| CZT Counter | 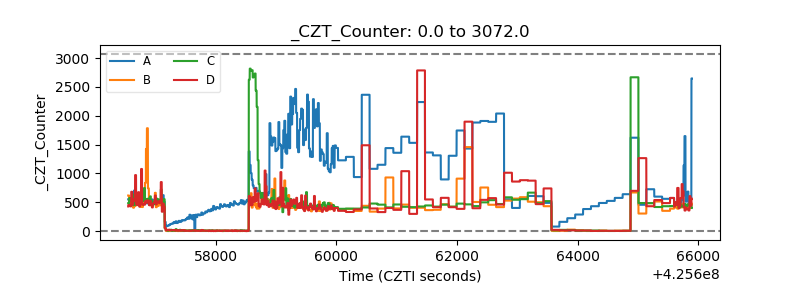 |
| +2.5 Volts monitor |  |
| +5 Volts monitor | 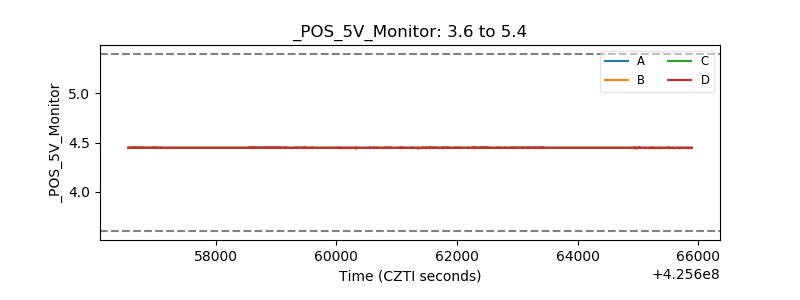 |
| _ROLL_ROT | 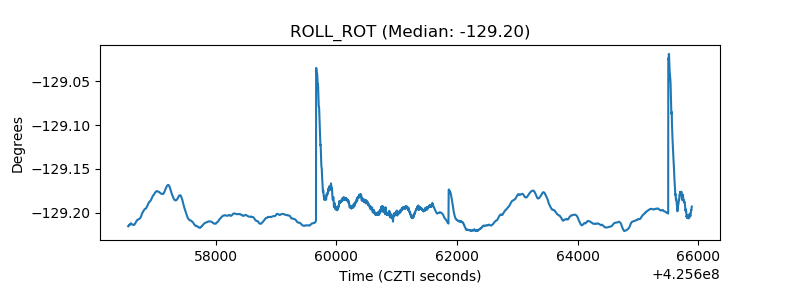 |
| _Roll_DEC | 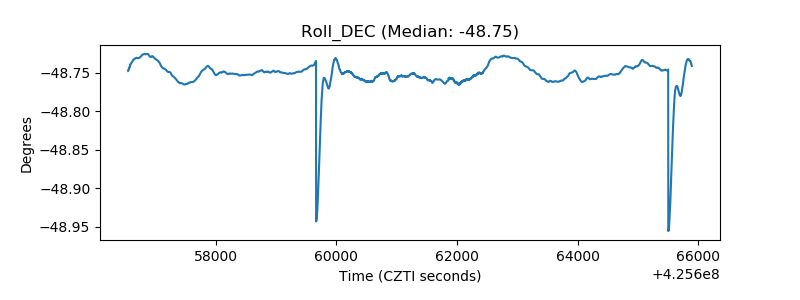 |
| _Roll_RA | 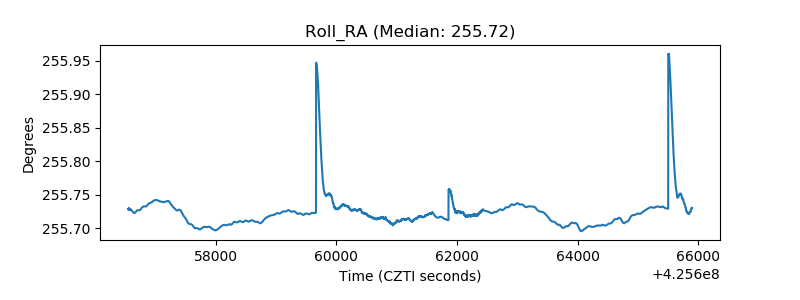 |
| Veto Counter | 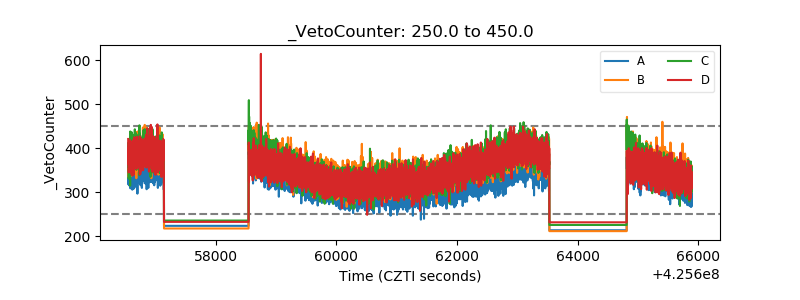 |