| Param | Original file | Final file |
|---|---|---|
| Filename | modeM0/AS1A12_099T01_9000005716_41904cztM0_level2.fits | modeM0/AS1A12_099T01_9000005716_41904cztM0_level2_quad_clean.evt |
| Size (bytes) | 499,089,600 | 82,972,800 |
| Size | 476.0 MB | 79.1 MB |
| Events in quadrant A | 3,585,332 | 590,019 |
| Events in quadrant B | 2,551,153 | 620,652 |
| Events in quadrant C | 3,270,727 | 560,384 |
| Events in quadrant D | 8,630,504 | 348,220 |
| Mode M9 | |||
|---|---|---|---|
| Quadrant | BADHDUFLAG | Total packets | Discarded packets |
| A | 0 | 24 | 0 |
| B | 0 | 24 | 0 |
| C | 0 | 24 | 0 |
| D | 0 | 25 | 0 |
| Mode M0 | |||
|---|---|---|---|
| Quadrant | BADHDUFLAG | Total packets | Discarded packets |
| A | 0 | 14225 | 3 |
| B | 0 | 11682 | 2 |
| C | 0 | 13283 | 2 |
| D | 0 | 29537 | 2 |
| Mode SS | |||
|---|---|---|---|
| Quadrant | BADHDUFLAG | Total packets | Discarded packets |
| A | 0 | 114 | 0 |
| B | 0 | 114 | 0 |
| C | 0 | 114 | 0 |
| D | 0 | 114 | 0 |
| Quadrant | Total seconds | Saturated seconds | Saturation percentage |
|---|---|---|---|
| A | 5616 | 171 | 3.044872% |
| B | 5616 | 40 | 0.712251% |
| C | 5616 | 254 | 4.522792% |
| D | 5616 | 2156 | 38.390313% |
Noise dominated data is calculated using 1-second bins in cleaned event files. If a bin has >2000 counts, and if more than 50% of those come from <1% of pixels, then it is considered to be noise-dominated and hence unusable.
| Quadrant | # 1 sec bins | Bins with >0 counts | Bins with >2000 counts | High rate bins dominated by noise | Noise dominated (total time) | Noise dominated (detector-on time) | Marked lightcurve |
|---|---|---|---|---|---|---|---|
| A | 7227 | 5617 | 114 | 114 | 1.58% | 2.03% | 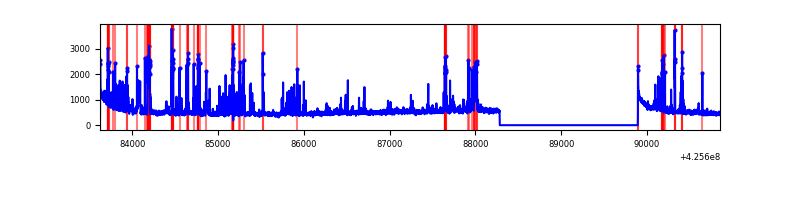 |
| B | 7227 | 5617 | 29 | 29 | 0.40% | 0.52% | 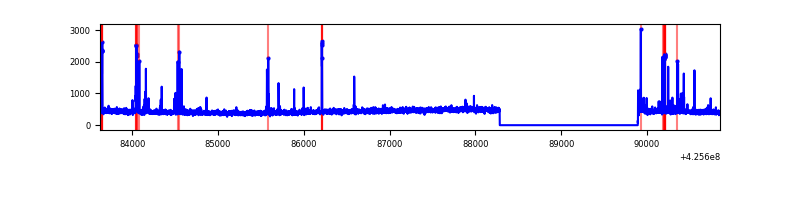 |
| C | 7227 | 5617 | 255 | 255 | 3.53% | 4.54% | 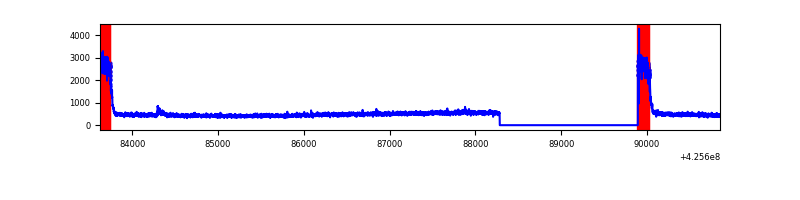 |
| D | 7227 | 5617 | 2108 | 2108 | 29.17% | 37.53% | 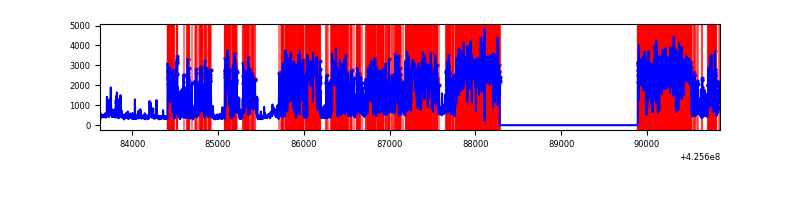 |
Top three noisy pixels from each quadrant. If the there are fewer than three noisy pixels in the level2.evt file, extra rows are filled as -1
| Pixel properties | Quadrant properties | ||||||
|---|---|---|---|---|---|---|---|
| Quadrant | DetID | PixID | Counts | Sigma | Mean | Median | Sigma |
| A | 14 | 24 | 753666 | 6146.3 | 593 | 581 | 122.5 |
| A | 10 | 83 | 532225 | 4339.01 | 593 | 581 | 122.5 |
| A | 13 | 6 | 7920 | 59.9 | 593 | 581 | 122.5 |
| B | 5 | 255 | 171138 | 1457.23 | 601 | 585 | 117.0 |
| B | 12 | 111 | 15236 | 125.18 | 601 | 585 | 117.0 |
| B | 11 | 111 | 14080 | 115.3 | 601 | 585 | 117.0 |
| C | 0 | 10 | 783940 | 5787.91 | 573 | 576 | 135.3 |
| C | 15 | 214 | 220577 | 1625.48 | 573 | 576 | 135.3 |
| C | 0 | 15 | 17629 | 126.0 | 573 | 576 | 135.3 |
| D | 12 | 79 | 6187610 | 55027.2 | 455 | 441 | 112.4 |
| D | 5 | 222 | 296638 | 2634.31 | 455 | 441 | 112.4 |
| D | 12 | 6 | 159406 | 1413.8 | 455 | 441 | 112.4 |
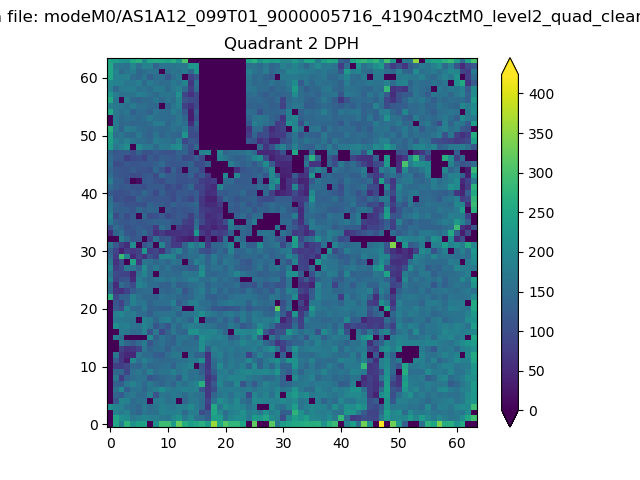
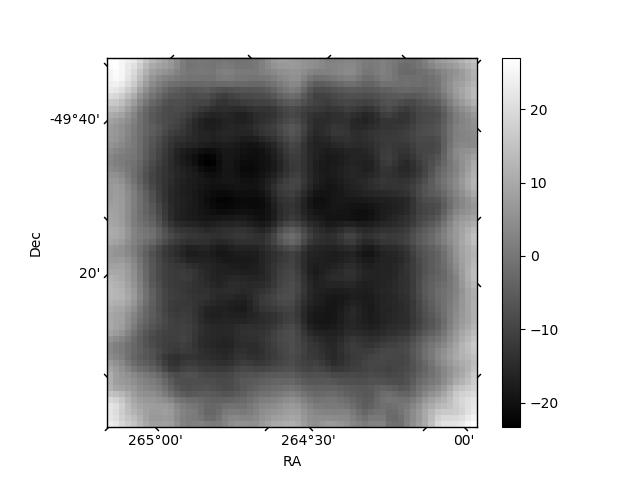
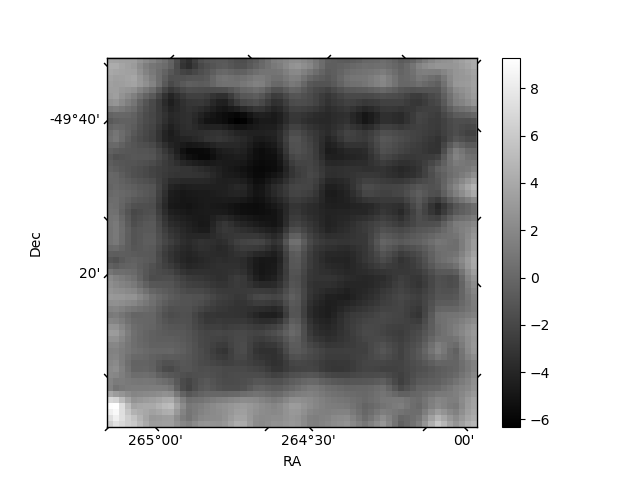
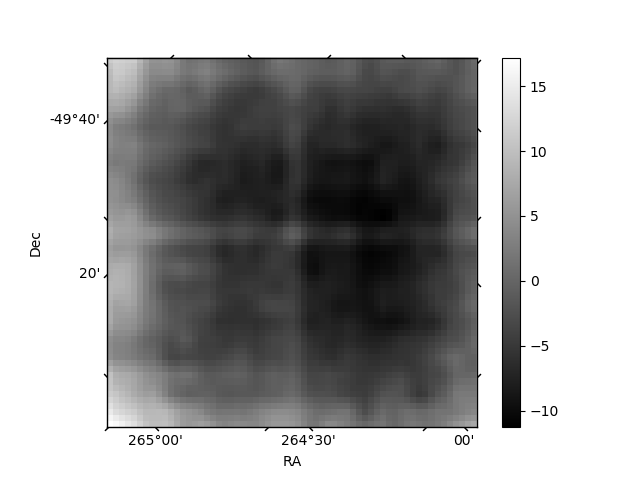
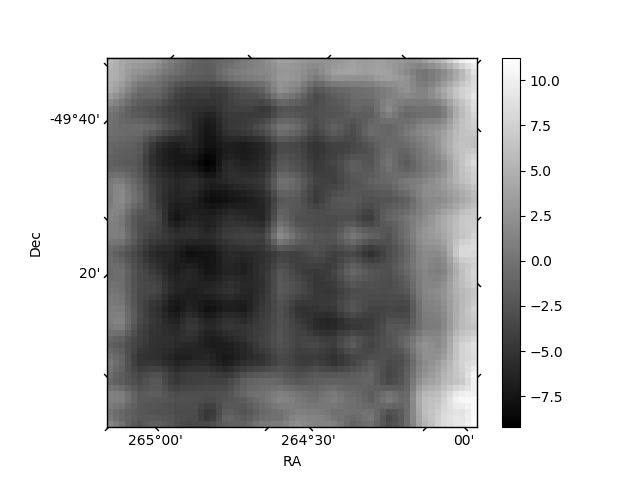
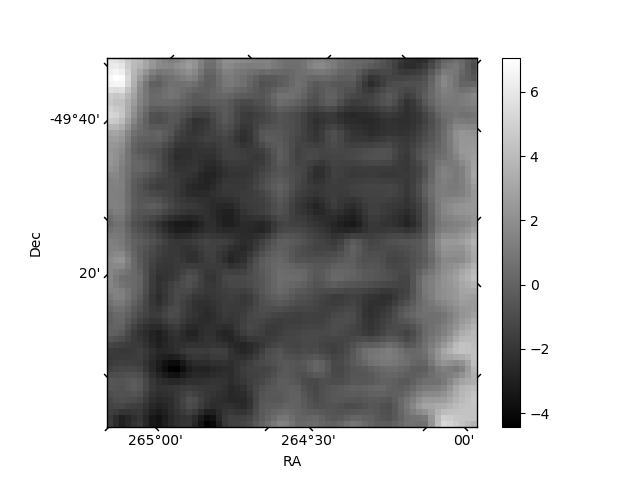
Histogram calculated using DETX and DETY for each event in the final _common_clean file
| Quadrant A | 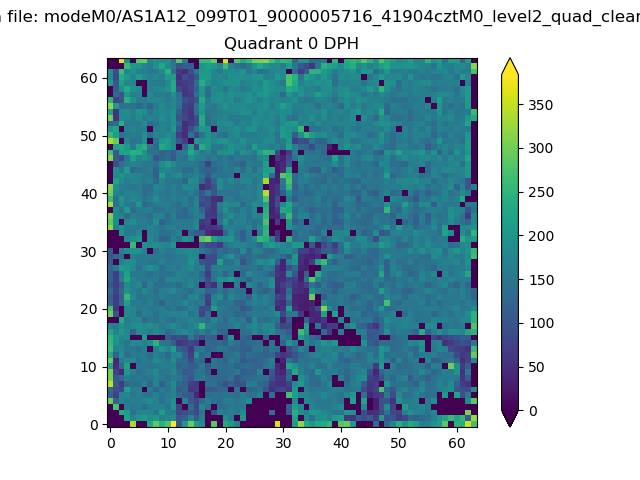 |
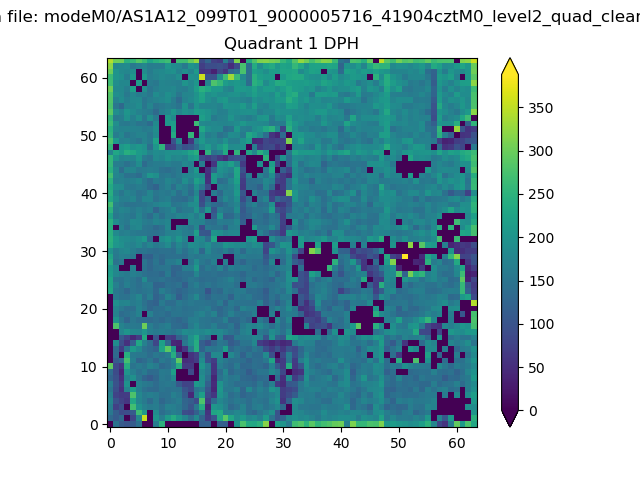 |
Quadrant B |
|---|---|---|---|
| Quadrant D | 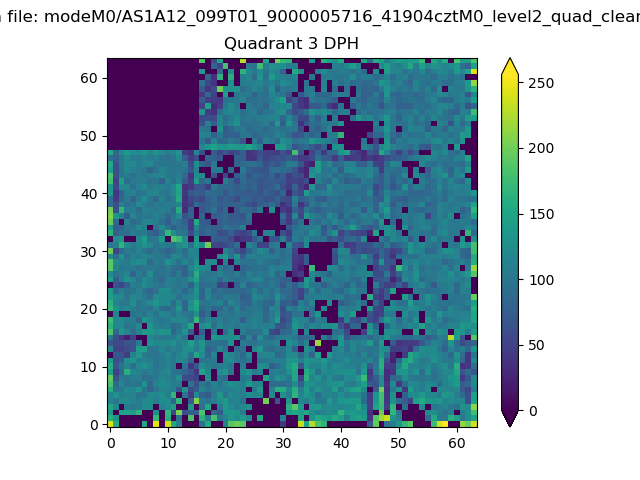 |
 |
Quadrant C |
| Plot type | Count rate plots | Images |
|---|---|---|
| Comparison with Poisson distribution Blue bars denote a histogram of data divided into 1 sec bins. Red curve is a Poisson curve with rate = median count rate of data. |
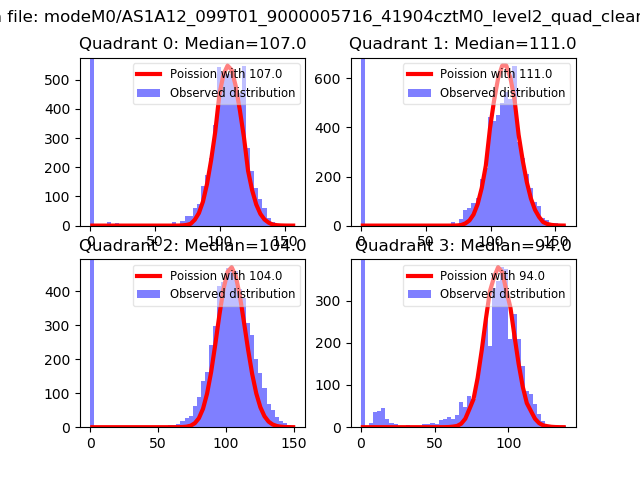 |
 |
| Quadrant-wise count rates Data is divided into 100 sec bins |
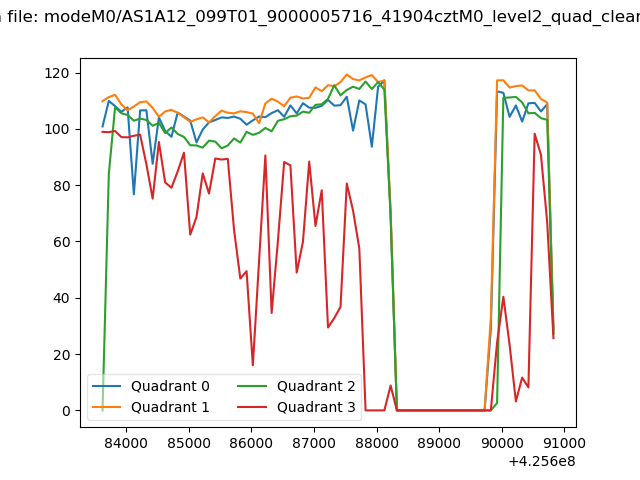 |
|
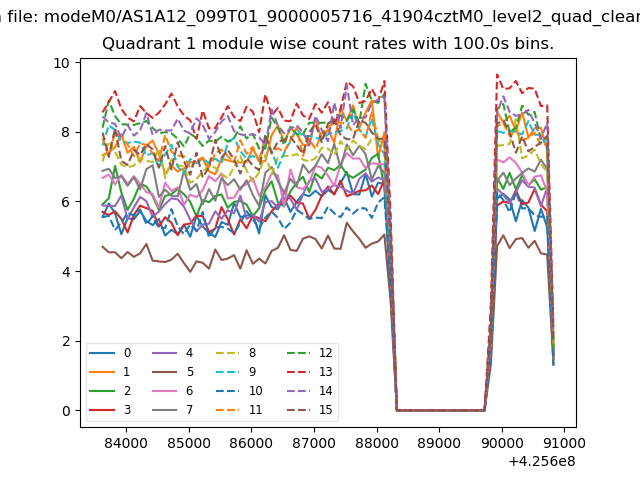
| Module-wise count rates for Quadrant A Data is divided into 100 sec bins |
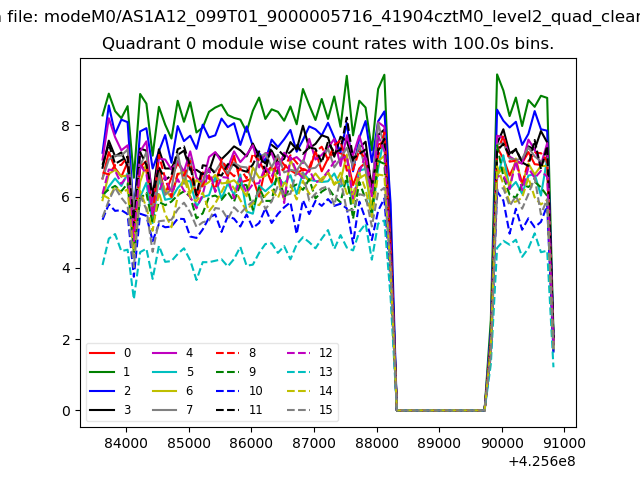 |
 |
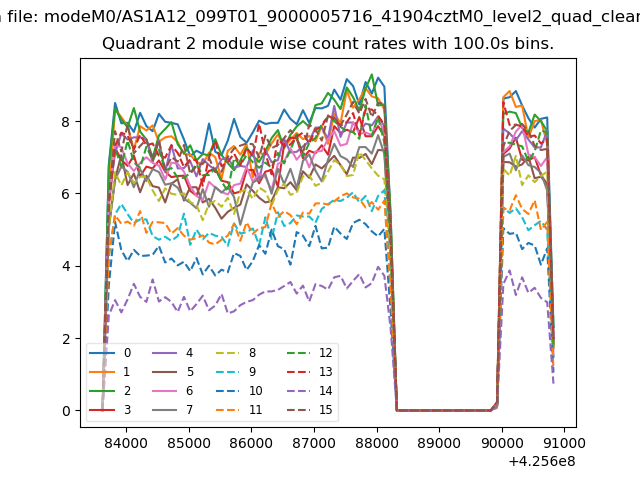
| Module-wise count rates for Quadrant B Data is divided into 100 sec bins |
 |
 |
| Module-wise count rates for Quadrant C Data is divided into 100 sec bins |
 |
 |
| Module-wise count rates for Quadrant D Data is divided into 100 sec bins |
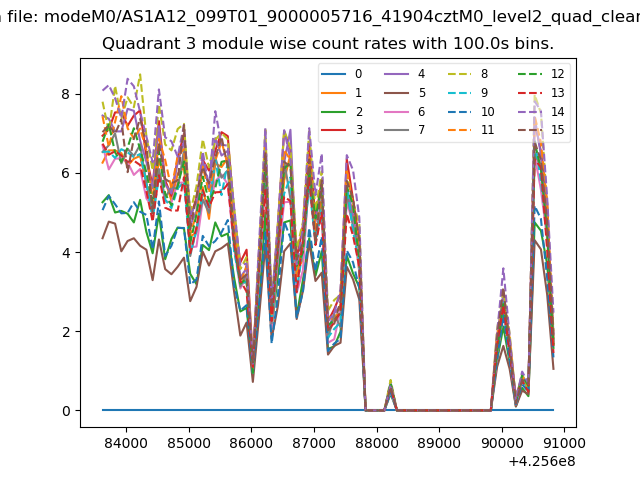 |
 |
| Parameter | Plot |
|---|---|
| CZT HV Monitor | 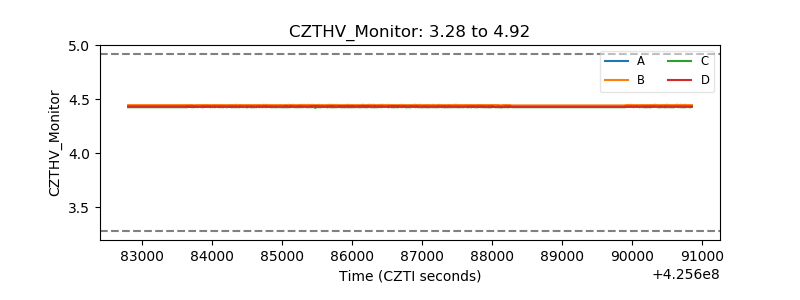 |
| D_VDD | 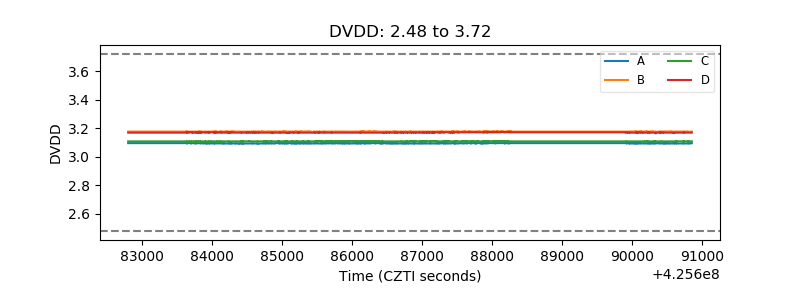 |
| Temperature 1 | 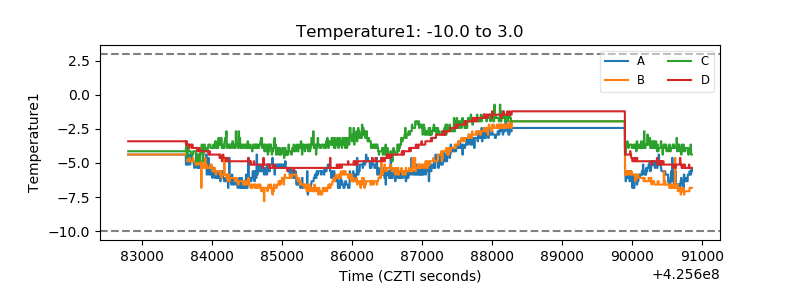 |
| Veto HV Monitor | 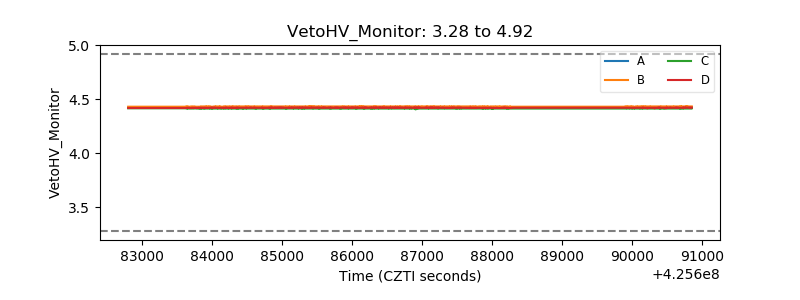 |
| Veto LLD | 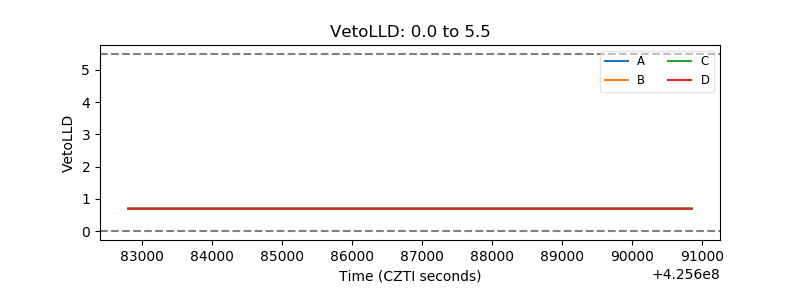 |
| Alpha Counter | 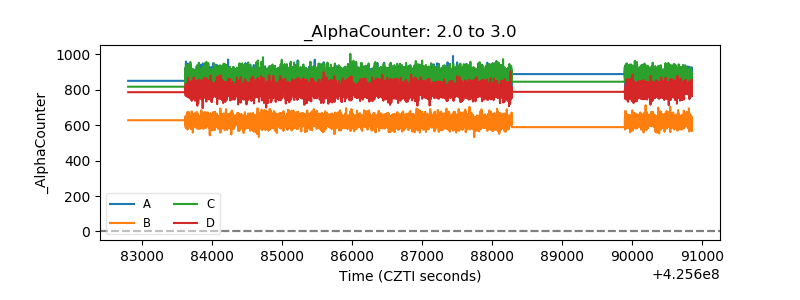 |
| _CPM_Rate | 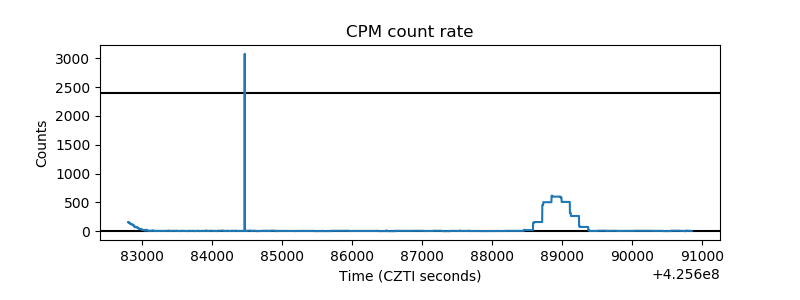 |
| CZT Counter | 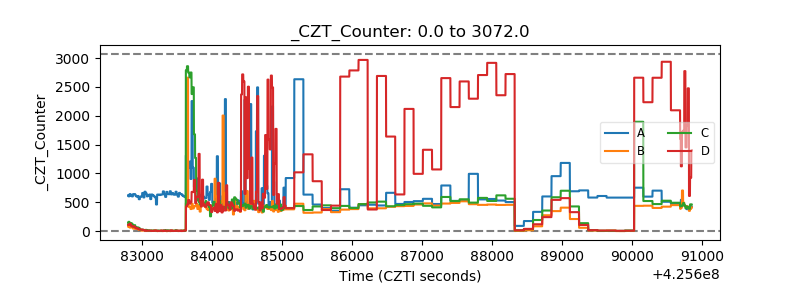 |
| +2.5 Volts monitor | 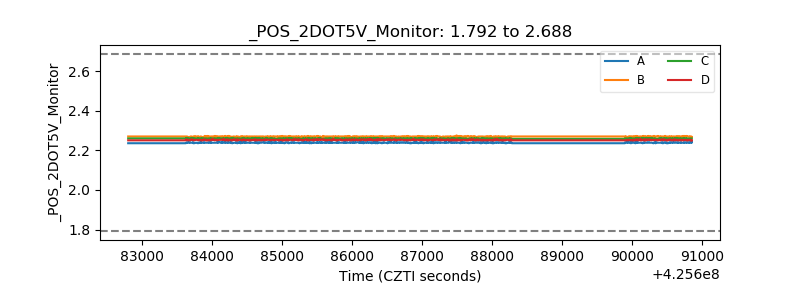 |
| +5 Volts monitor | 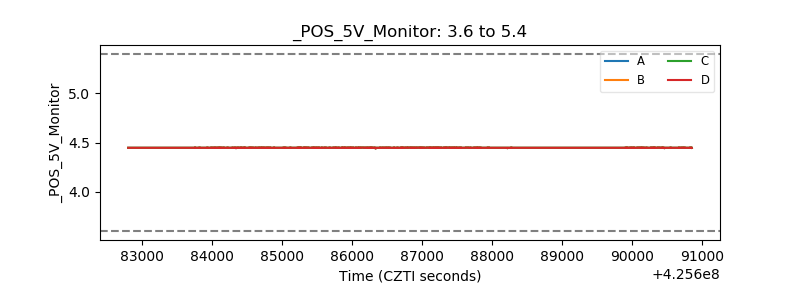 |
| _ROLL_ROT | 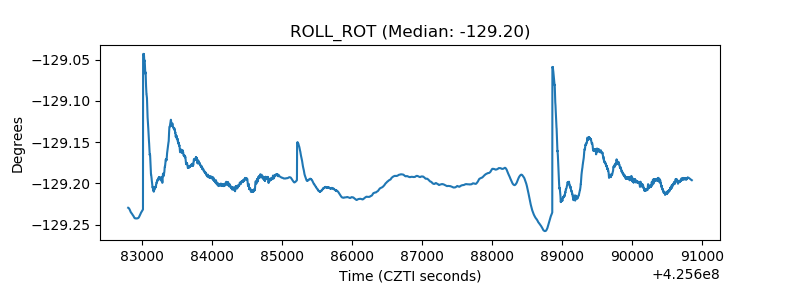 |
| _Roll_DEC | 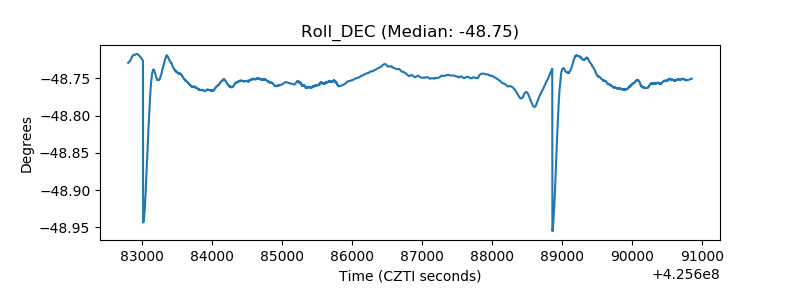 |
| _Roll_RA | 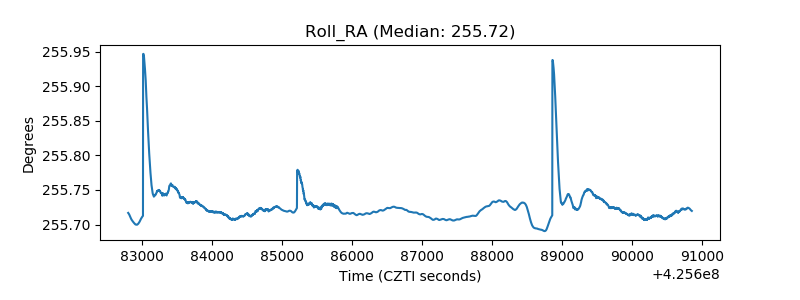 |
| Veto Counter | 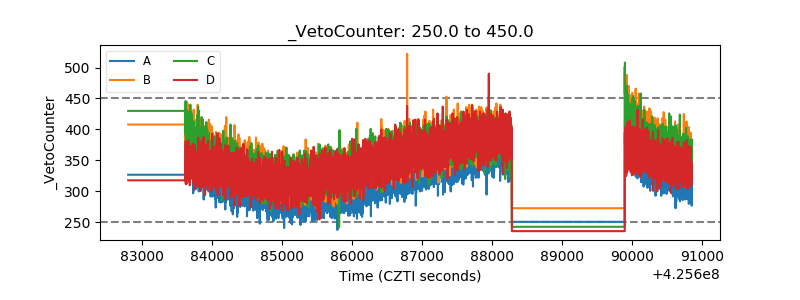 |