| Param | Original file | Final file |
|---|---|---|
| Filename | modeM0/AS1A12_099T01_9000005716_41906cztM0_level2.fits | modeM0/AS1A12_099T01_9000005716_41906cztM0_level2_quad_clean.evt |
| Size (bytes) | 450,319,680 | 86,869,440 |
| Size | 429.5 MB | 82.8 MB |
| Events in quadrant A | 3,248,283 | 606,116 |
| Events in quadrant B | 2,484,302 | 630,642 |
| Events in quadrant C | 3,270,764 | 565,667 |
| Events in quadrant D | 7,237,073 | 441,648 |
| Mode M9 | |||
|---|---|---|---|
| Quadrant | BADHDUFLAG | Total packets | Discarded packets |
| A | 0 | 25 | 0 |
| B | 0 | 25 | 0 |
| C | 0 | 26 | 0 |
| D | 0 | 26 | 0 |
| Mode M0 | |||
|---|---|---|---|
| Quadrant | BADHDUFLAG | Total packets | Discarded packets |
| A | 0 | 13063 | 2 |
| B | 0 | 11333 | 2 |
| C | 0 | 13087 | 2 |
| D | 0 | 25316 | 2 |
| Mode SS | |||
|---|---|---|---|
| Quadrant | BADHDUFLAG | Total packets | Discarded packets |
| A | 0 | 112 | 0 |
| B | 0 | 112 | 0 |
| C | 0 | 112 | 0 |
| D | 0 | 112 | 0 |
| Quadrant | Total seconds | Saturated seconds | Saturation percentage |
|---|---|---|---|
| A | 5519 | 50 | 0.905961% |
| B | 5519 | 17 | 0.308027% |
| C | 5519 | 274 | 4.964668% |
| D | 5519 | 1230 | 22.286646% |
Noise dominated data is calculated using 1-second bins in cleaned event files. If a bin has >2000 counts, and if more than 50% of those come from <1% of pixels, then it is considered to be noise-dominated and hence unusable.
| Quadrant | # 1 sec bins | Bins with >0 counts | Bins with >2000 counts | High rate bins dominated by noise | Noise dominated (total time) | Noise dominated (detector-on time) | Marked lightcurve |
|---|---|---|---|---|---|---|---|
| A | 7251 | 5520 | 38 | 38 | 0.52% | 0.69% | 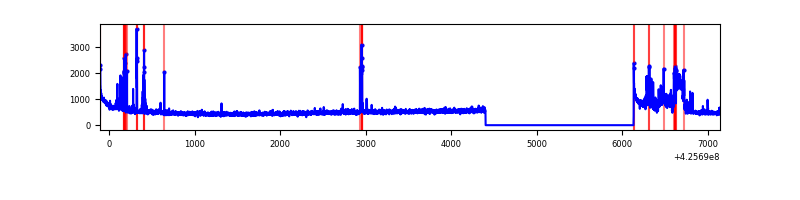 |
| B | 7251 | 5520 | 11 | 11 | 0.15% | 0.20% | 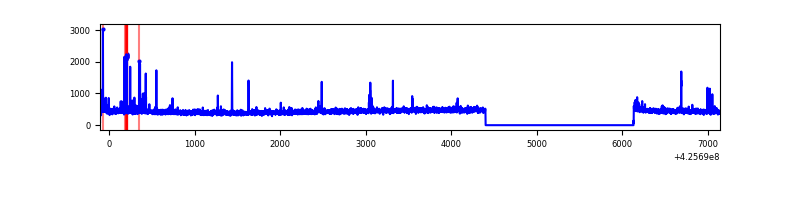 |
| C | 7251 | 5520 | 271 | 271 | 3.74% | 4.91% | 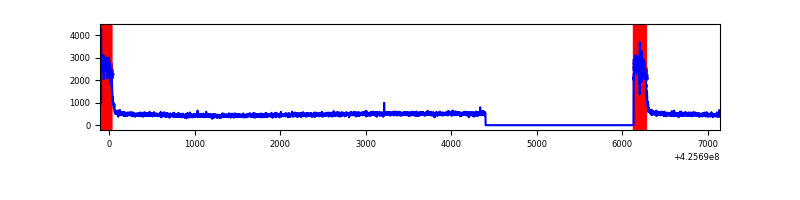 |
| D | 7251 | 5520 | 1312 | 1312 | 18.09% | 23.77% | 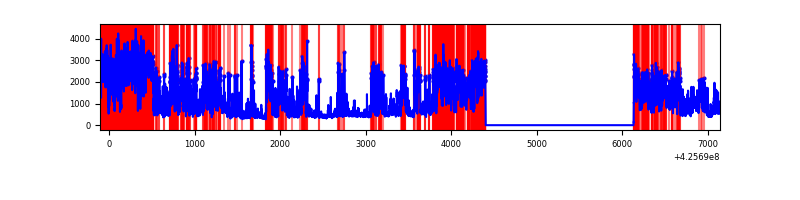 |
Top three noisy pixels from each quadrant. If the there are fewer than three noisy pixels in the level2.evt file, extra rows are filled as -1
| Pixel properties | Quadrant properties | ||||||
|---|---|---|---|---|---|---|---|
| Quadrant | DetID | PixID | Counts | Sigma | Mean | Median | Sigma |
| A | 10 | 83 | 540721 | 4396.93 | 595 | 583 | 122.8 |
| A | 14 | 24 | 402181 | 3269.16 | 595 | 583 | 122.8 |
| A | 3 | 137 | 6739 | 50.11 | 595 | 583 | 122.8 |
| B | 5 | 255 | 103722 | 885.44 | 598 | 581 | 116.5 |
| B | 12 | 111 | 15044 | 124.16 | 598 | 581 | 116.5 |
| B | 14 | 111 | 13634 | 112.06 | 598 | 581 | 116.5 |
| C | 0 | 10 | 814925 | 6086.59 | 570 | 572 | 133.8 |
| C | 15 | 214 | 213351 | 1590.34 | 570 | 572 | 133.8 |
| C | 0 | 15 | 19094 | 138.44 | 570 | 572 | 133.8 |
| D | 12 | 79 | 4525450 | 34670.96 | 528 | 513 | 130.5 |
| D | 5 | 222 | 203694 | 1556.81 | 528 | 513 | 130.5 |
| D | 12 | 6 | 201525 | 1540.19 | 528 | 513 | 130.5 |
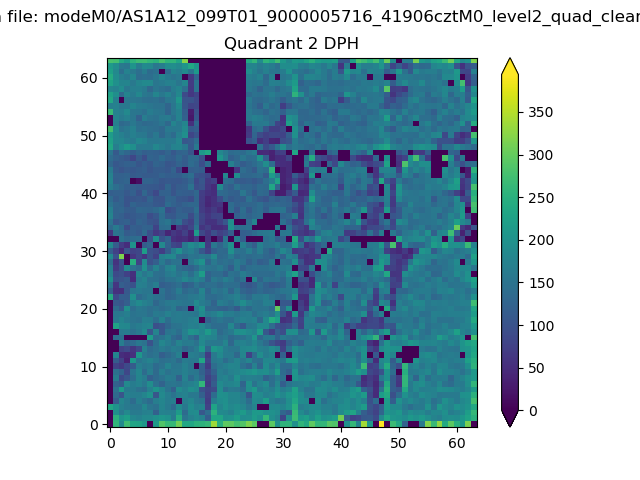
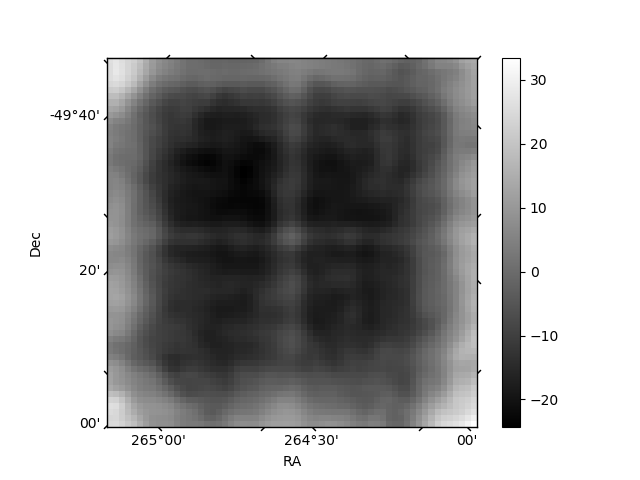
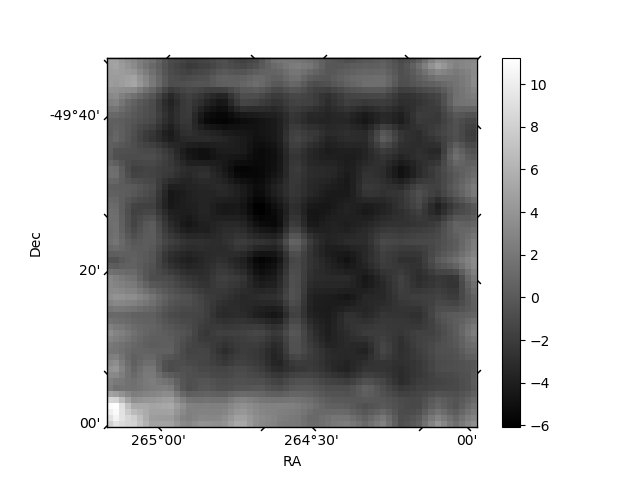
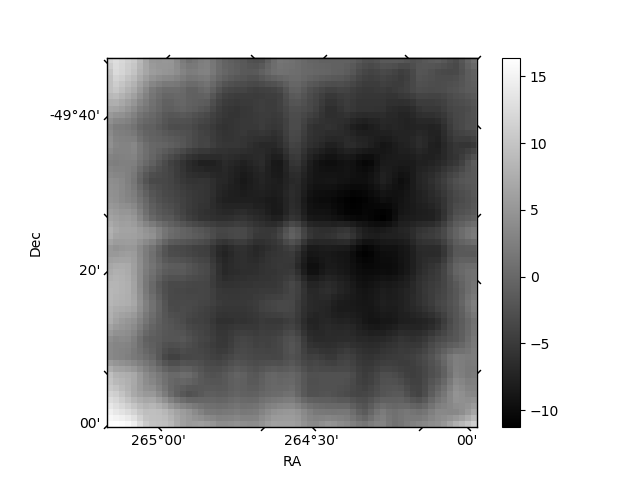
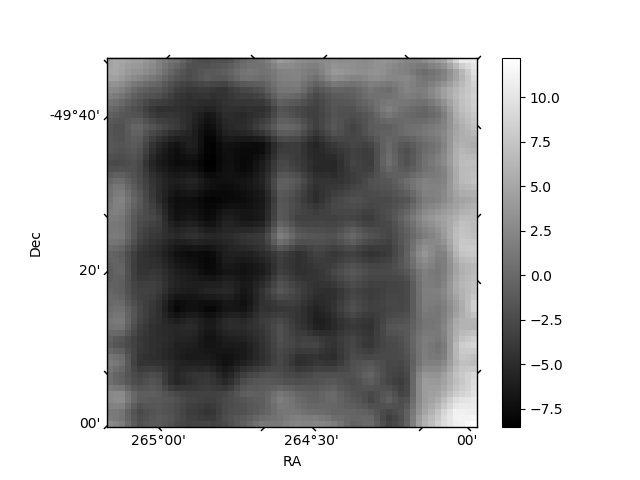
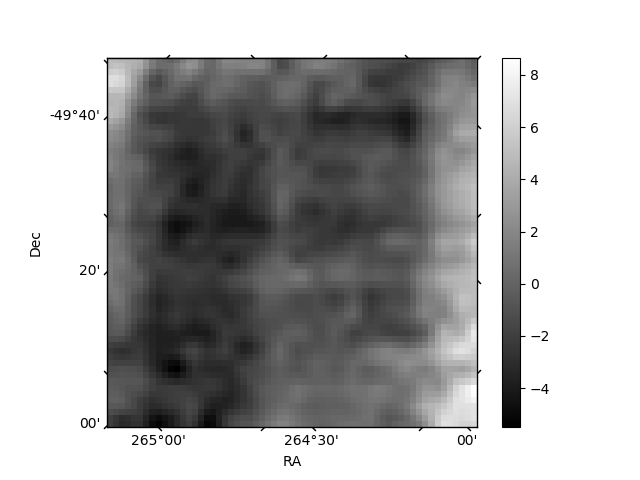
Histogram calculated using DETX and DETY for each event in the final _common_clean file
| Quadrant A | 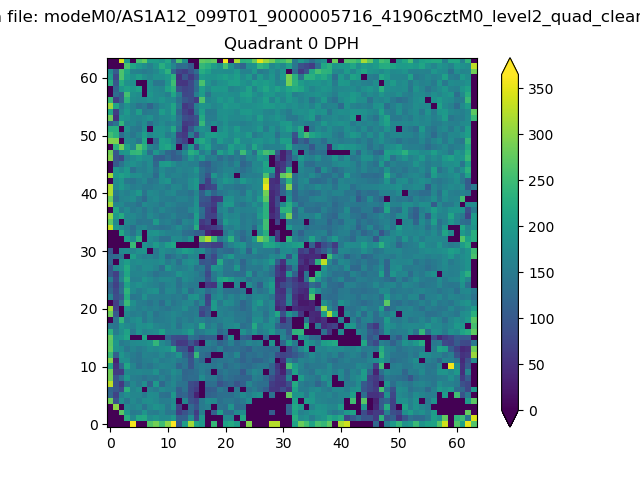 |
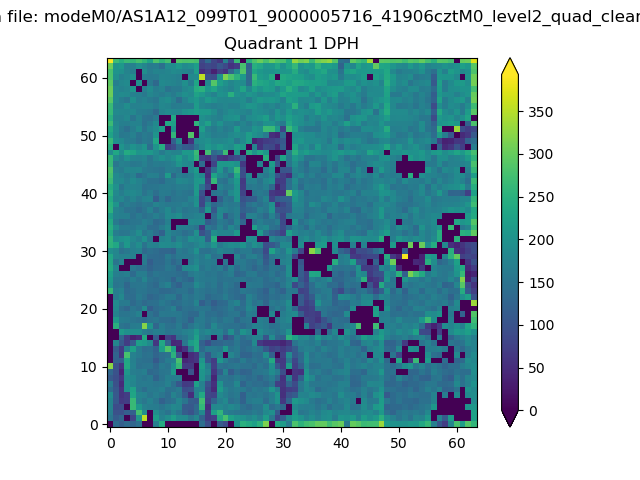 |
Quadrant B |
|---|---|---|---|
| Quadrant D | 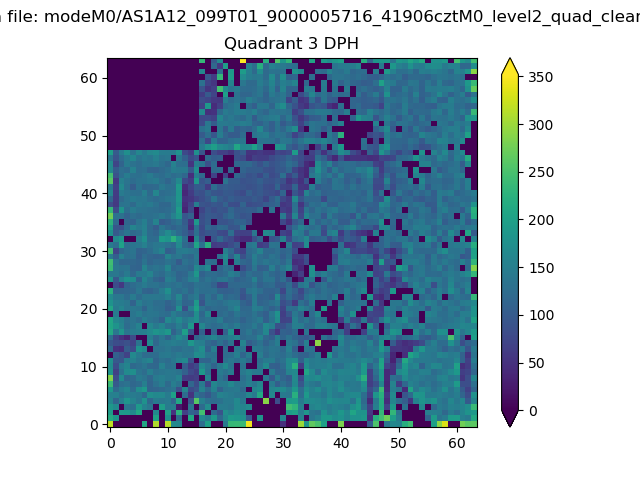 |
 |
Quadrant C |
| Plot type | Count rate plots | Images |
|---|---|---|
| Comparison with Poisson distribution Blue bars denote a histogram of data divided into 1 sec bins. Red curve is a Poisson curve with rate = median count rate of data. |
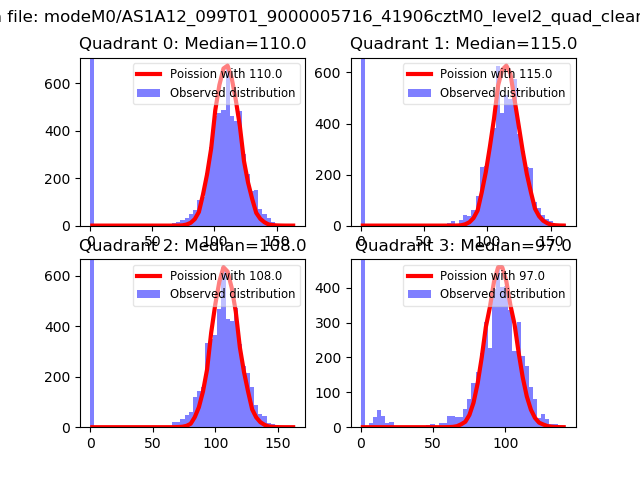 |
 |
| Quadrant-wise count rates Data is divided into 100 sec bins |
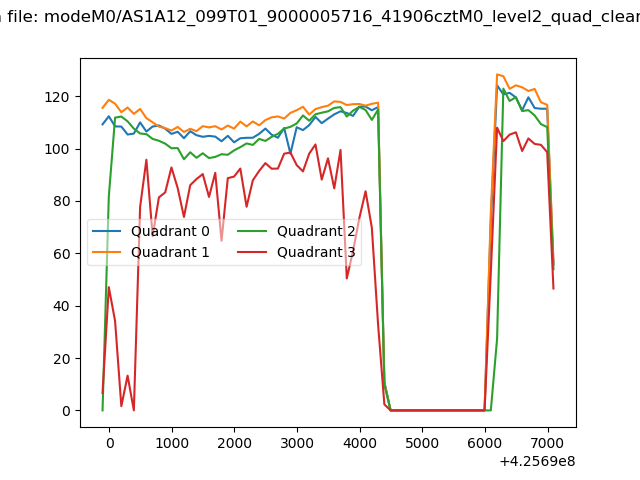 |
|
| Module-wise count rates for Quadrant A Data is divided into 100 sec bins |
 |
 |
| Module-wise count rates for Quadrant B Data is divided into 100 sec bins |
 |
 |
| Module-wise count rates for Quadrant C Data is divided into 100 sec bins |
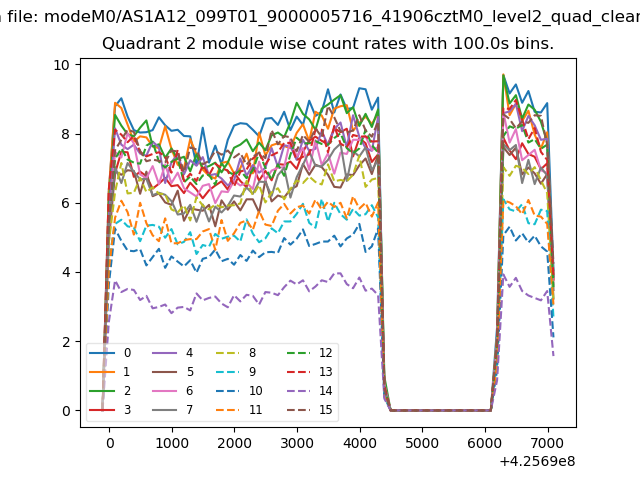 |
 |
| Module-wise count rates for Quadrant D Data is divided into 100 sec bins |
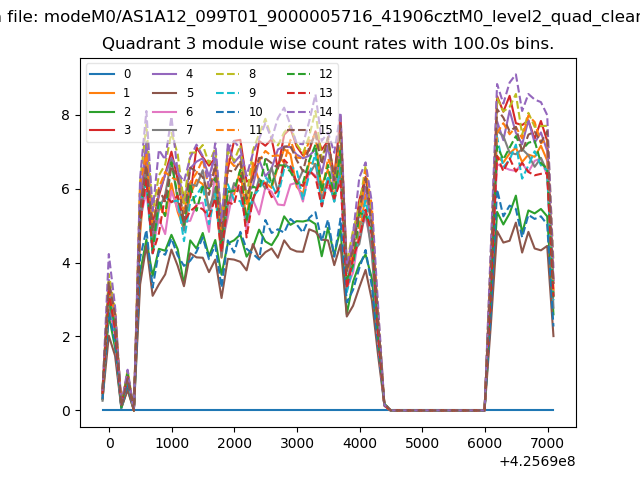 |
 |
| Parameter | Plot |
|---|---|
| CZT HV Monitor | 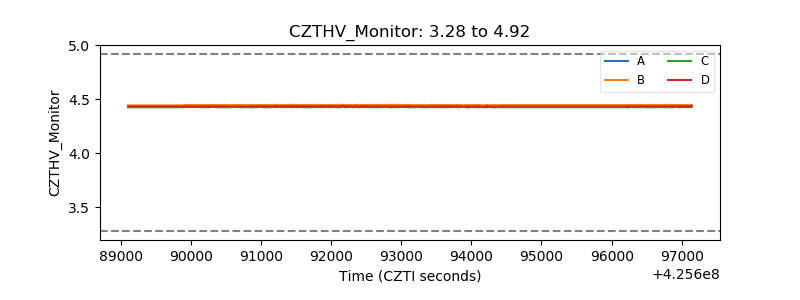 |
| D_VDD | 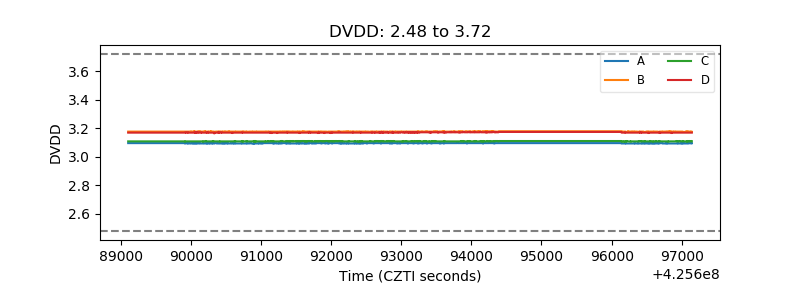 |
| Temperature 1 | 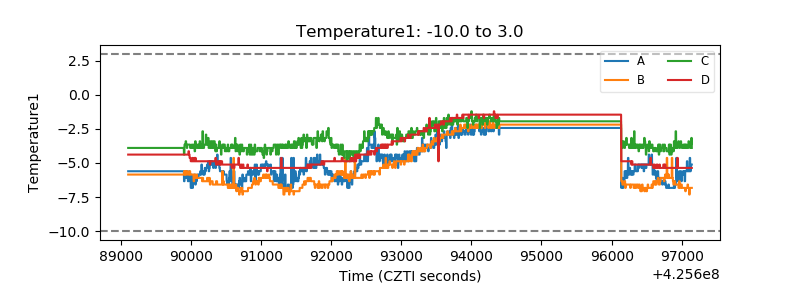 |
| Veto HV Monitor | 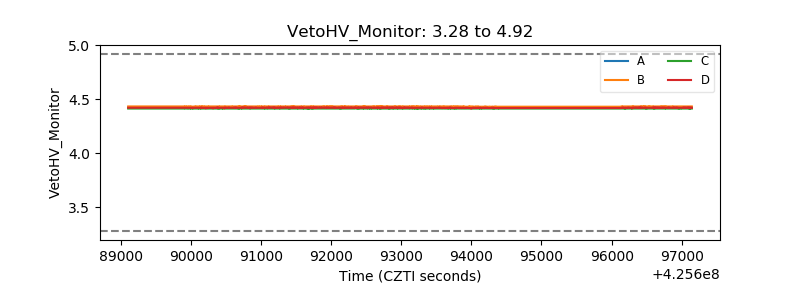 |
| Veto LLD | 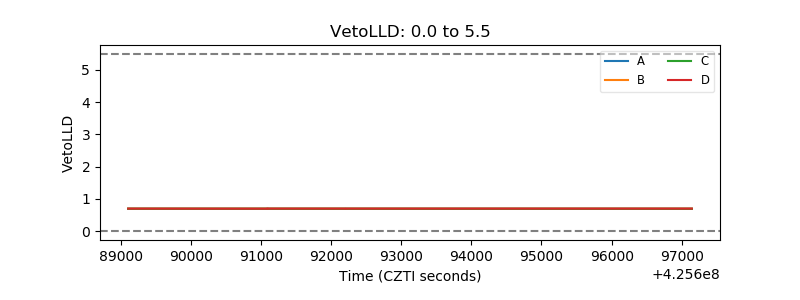 |
| Alpha Counter |  |
| _CPM_Rate |  |
| CZT Counter | 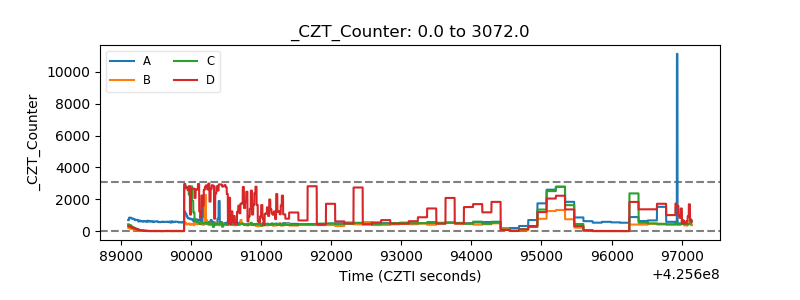 |
| +2.5 Volts monitor | 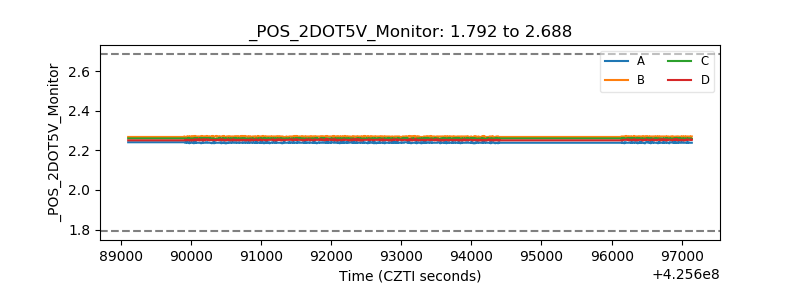 |
| +5 Volts monitor |  |
| _ROLL_ROT | 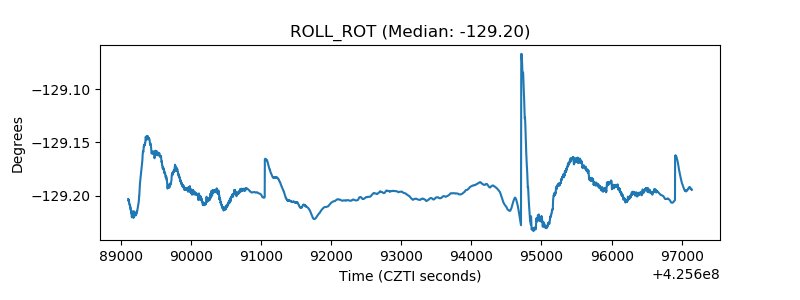 |
| _Roll_DEC | 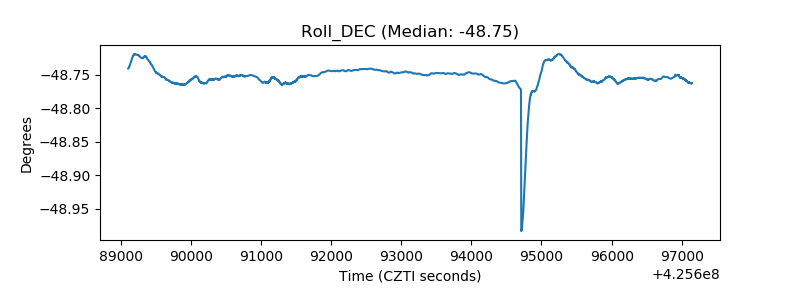 |
| _Roll_RA | 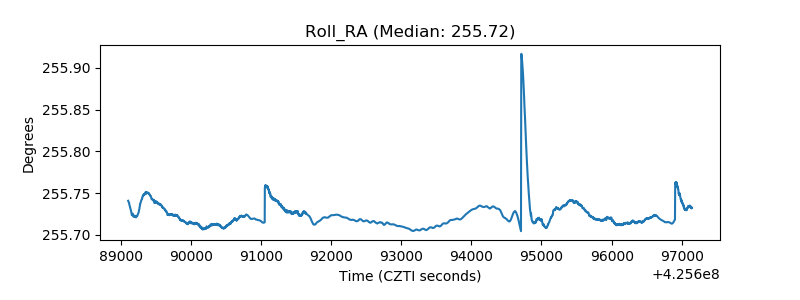 |
| Veto Counter |  |