| Param | Original file | Final file |
|---|---|---|
| Filename | modeM0/AS1A12_099T01_9000005716_41908cztM0_level2.fits | modeM0/AS1A12_099T01_9000005716_41908cztM0_level2_quad_clean.evt |
| Size (bytes) | 661,371,840 | 73,074,240 |
| Size | 630.7 MB | 69.7 MB |
| Events in quadrant A | 4,008,696 | 607,237 |
| Events in quadrant B | 2,561,050 | 655,774 |
| Events in quadrant C | 3,240,768 | 586,164 |
| Events in quadrant D | 14,272,504 | 3,753 |
| Mode M9 | |||
|---|---|---|---|
| Quadrant | BADHDUFLAG | Total packets | Discarded packets |
| A | 0 | 27 | 0 |
| B | 0 | 27 | 0 |
| C | 0 | 28 | 0 |
| D | 0 | 28 | 0 |
| Mode M0 | |||
|---|---|---|---|
| Quadrant | BADHDUFLAG | Total packets | Discarded packets |
| A | 0 | 15227 | 2 |
| B | 0 | 10911 | 3 |
| C | 0 | 12404 | 2 |
| D | 0 | 45416 | 2 |
| Mode SS | |||
|---|---|---|---|
| Quadrant | BADHDUFLAG | Total packets | Discarded packets |
| A | 0 | 106 | 0 |
| B | 0 | 106 | 0 |
| C | 0 | 106 | 0 |
| D | 0 | 106 | 0 |
| Quadrant | Total seconds | Saturated seconds | Saturation percentage |
|---|---|---|---|
| A | 5131 | 213 | 4.151238% |
| B | 5130 | 24 | 0.467836% |
| C | 5130 | 271 | 5.282651% |
| D | 5130 | 5103 | 99.473684% |
Noise dominated data is calculated using 1-second bins in cleaned event files. If a bin has >2000 counts, and if more than 50% of those come from <1% of pixels, then it is considered to be noise-dominated and hence unusable.
| Quadrant | # 1 sec bins | Bins with >0 counts | Bins with >2000 counts | High rate bins dominated by noise | Noise dominated (total time) | Noise dominated (detector-on time) | Marked lightcurve |
|---|---|---|---|---|---|---|---|
| A | 7134 | 5132 | 157 | 157 | 2.20% | 3.06% | 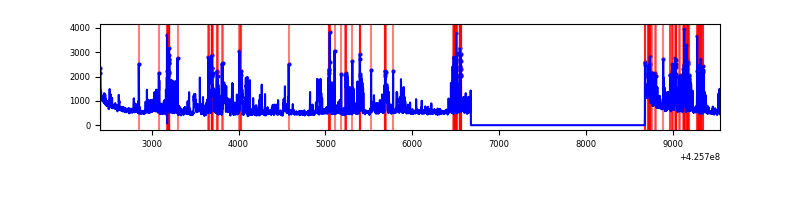 |
| B | 7133 | 5130 | 8 | 8 | 0.11% | 0.16% | 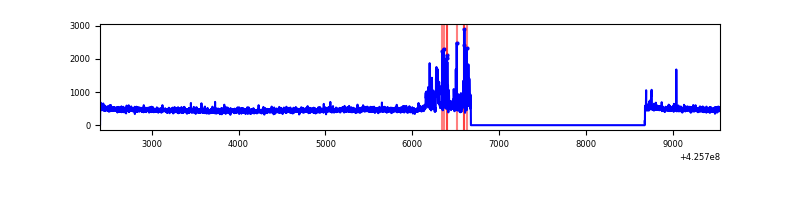 |
| C | 7133 | 5131 | 265 | 265 | 3.72% | 5.16% | 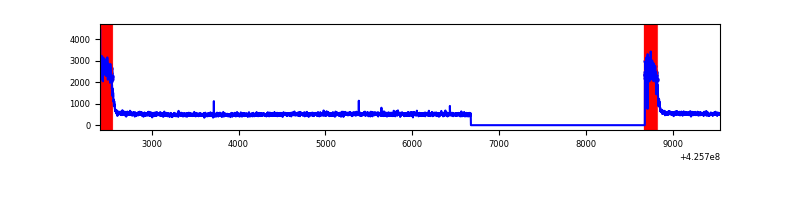 |
| D | 7133 | 5131 | 4782 | 4782 | 67.04% | 93.20% | 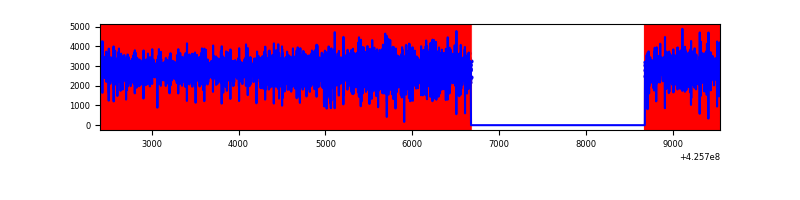 |
Top three noisy pixels from each quadrant. If the there are fewer than three noisy pixels in the level2.evt file, extra rows are filled as -1
| Pixel properties | Quadrant properties | ||||||
|---|---|---|---|---|---|---|---|
| Quadrant | DetID | PixID | Counts | Sigma | Mean | Median | Sigma |
| A | 14 | 24 | 761259 | 6393.45 | 584 | 573 | 119.0 |
| A | 10 | 83 | 510556 | 4286.33 | 584 | 573 | 119.0 |
| A | 15 | 223 | 473776 | 3977.2 | 584 | 573 | 119.0 |
| B | 5 | 255 | 197521 | 1742.4 | 595 | 581 | 113.0 |
| B | 0 | 245 | 21393 | 184.13 | 595 | 581 | 113.0 |
| B | 12 | 111 | 14309 | 121.46 | 595 | 581 | 113.0 |
| C | 0 | 10 | 787559 | 5986.59 | 571 | 575 | 131.5 |
| C | 15 | 214 | 201984 | 1532.12 | 571 | 575 | 131.5 |
| C | 0 | 15 | 24678 | 183.35 | 571 | 575 | 131.5 |
| D | 12 | 79 | 13510676 | 432945.44 | 125 | 121 | 31.2 |
| D | 13 | 249 | 147184 | 4712.63 | 125 | 121 | 31.2 |
| D | 2 | 249 | 37411 | 1194.96 | 125 | 121 | 31.2 |
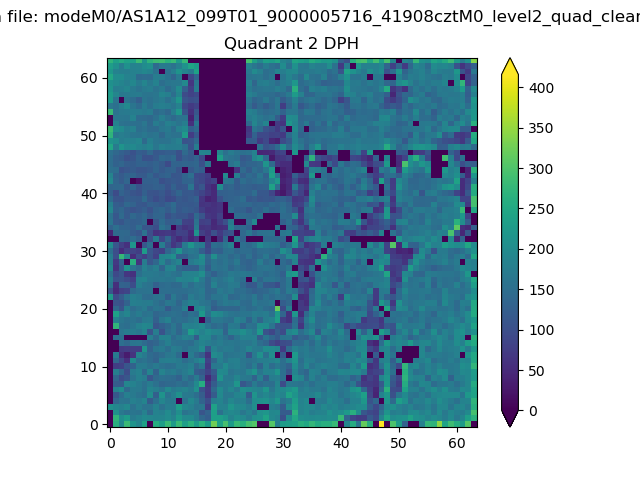
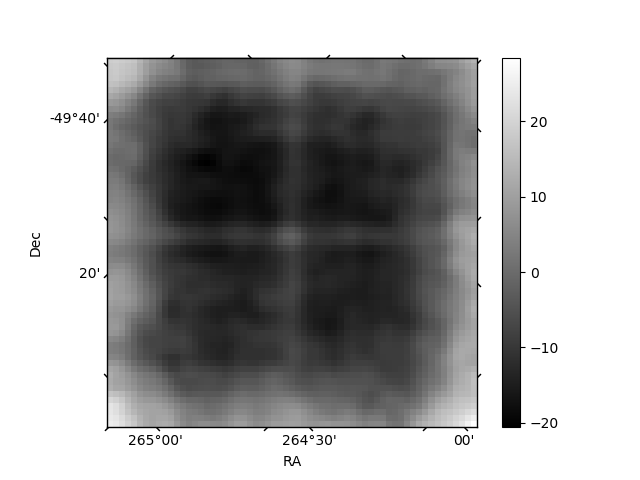
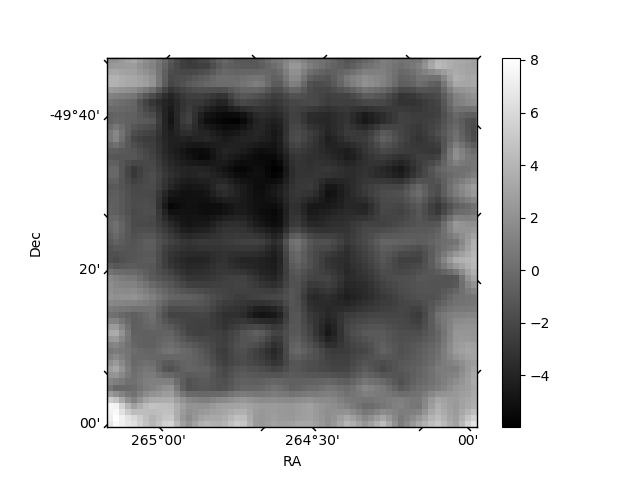
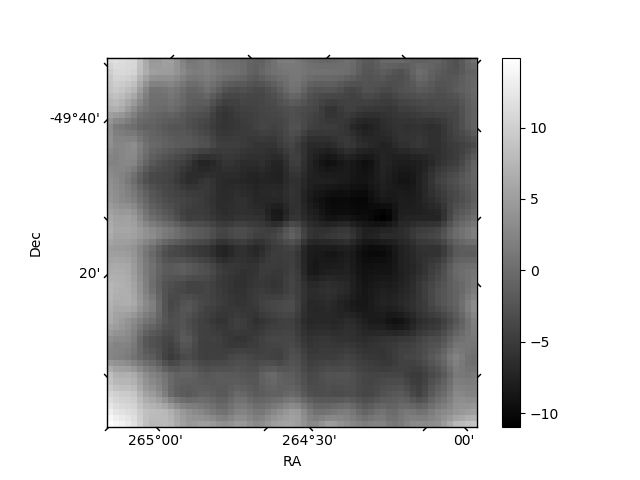
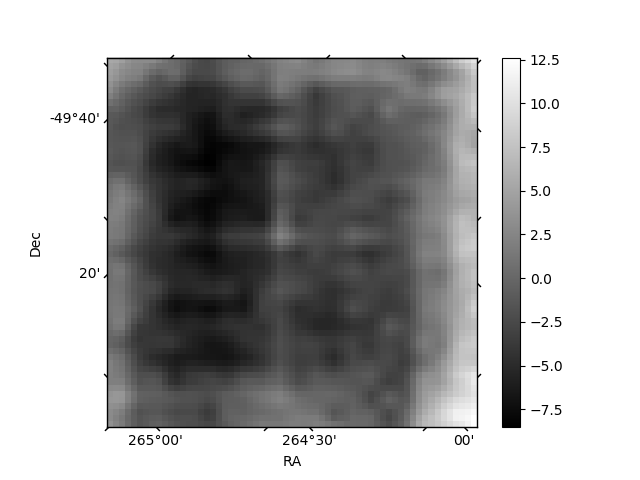
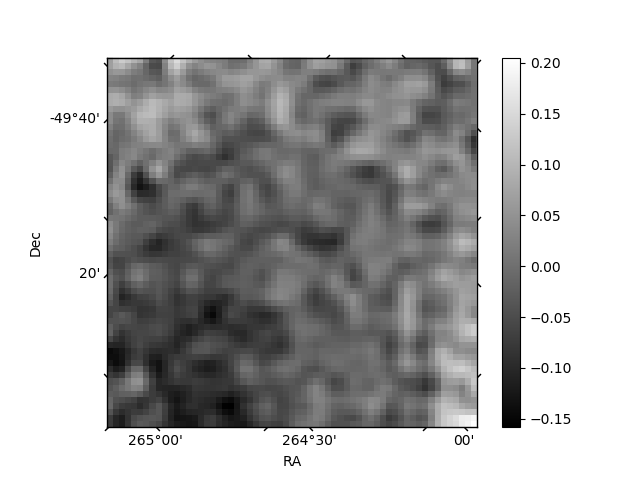
Histogram calculated using DETX and DETY for each event in the final _common_clean file
| Quadrant A | 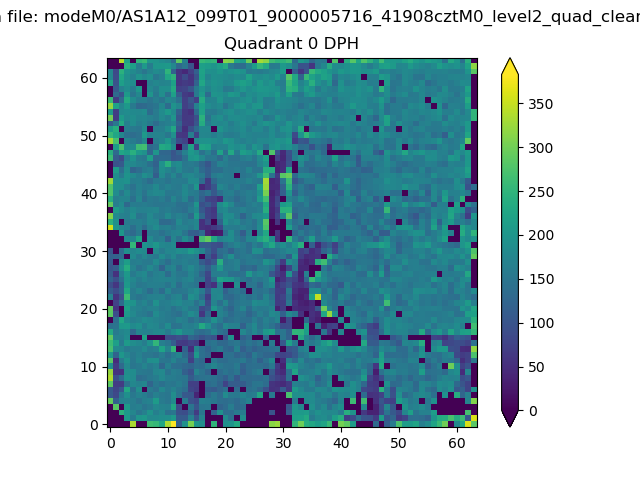 |
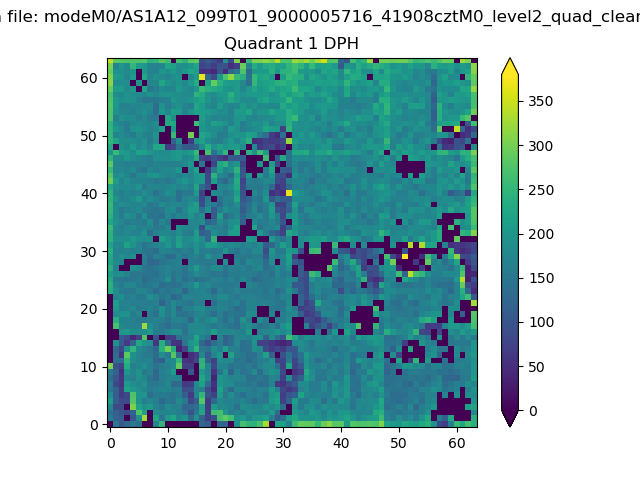 |
Quadrant B |
|---|---|---|---|
| Quadrant D | 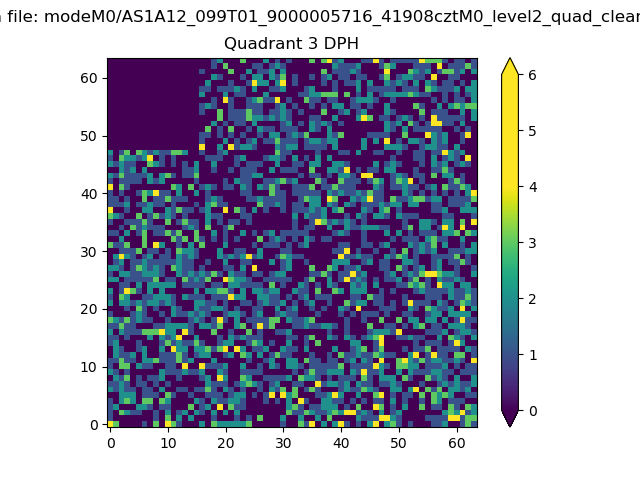 |
 |
Quadrant C |
| Plot type | Count rate plots | Images |
|---|---|---|
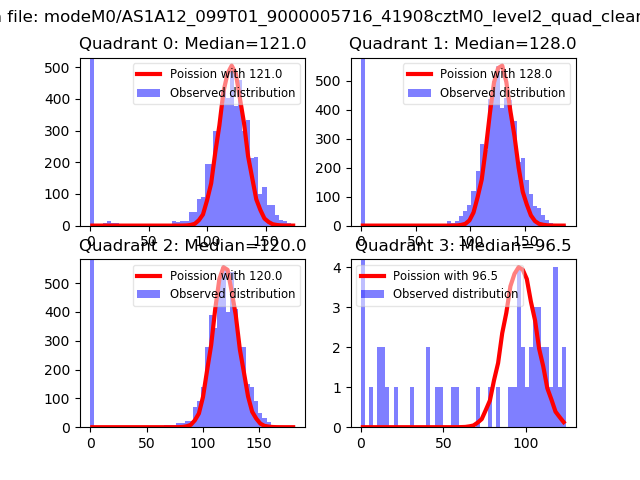
| Comparison with Poisson distribution Blue bars denote a histogram of data divided into 1 sec bins. Red curve is a Poisson curve with rate = median count rate of data. |
 |
 |
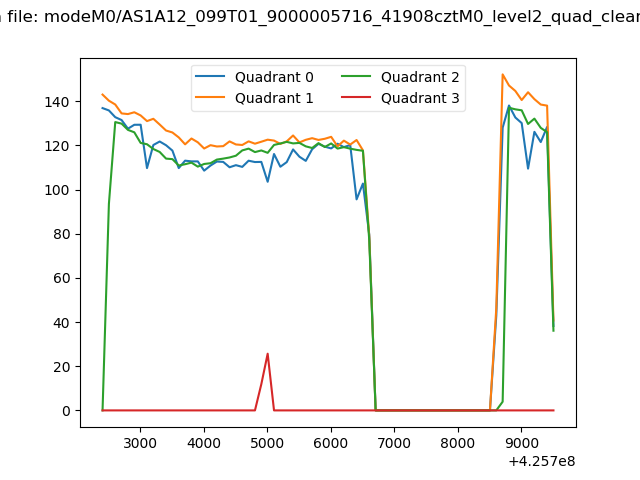
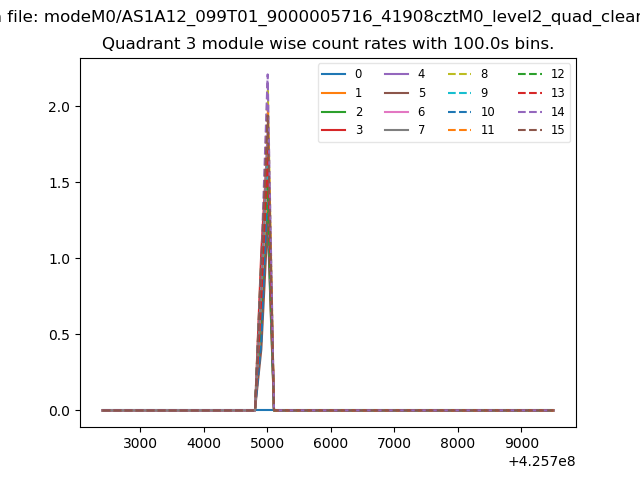
| Quadrant-wise count rates Data is divided into 100 sec bins |
 |
|
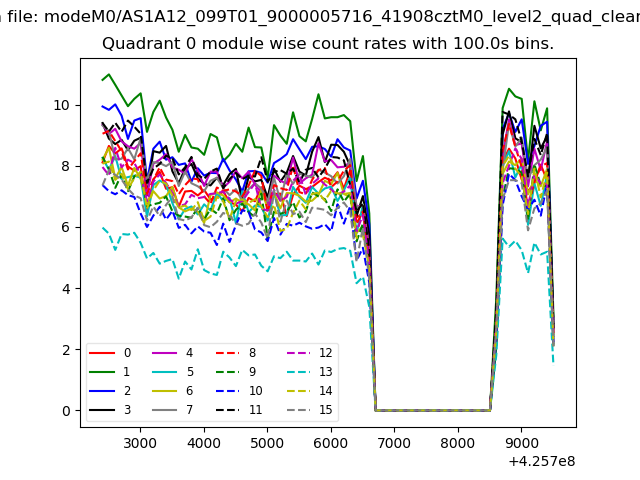
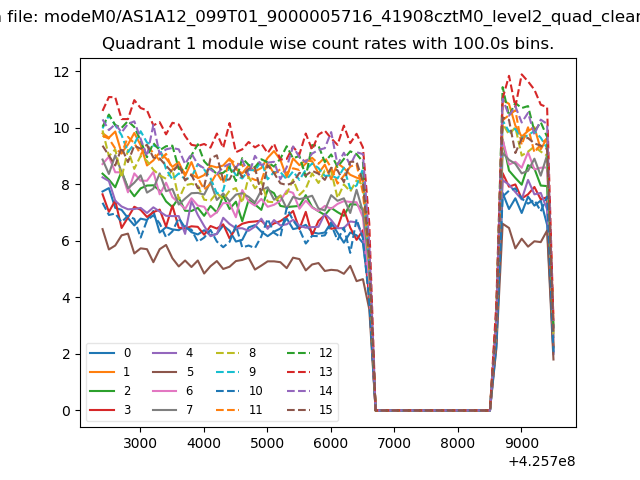
| Module-wise count rates for Quadrant A Data is divided into 100 sec bins |
 |
 |
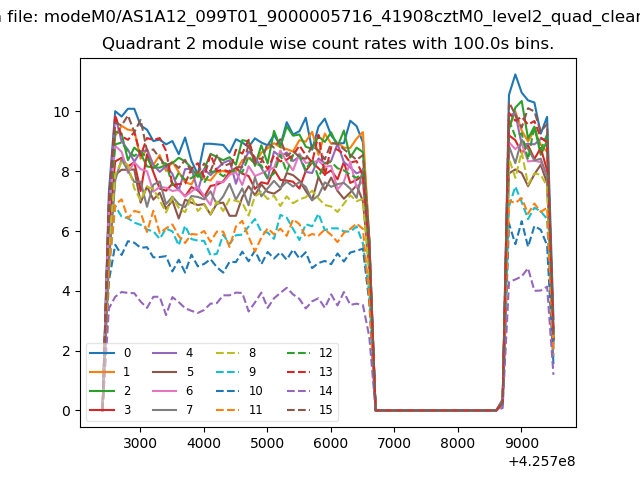
| Module-wise count rates for Quadrant B Data is divided into 100 sec bins |
 |
 |
| Module-wise count rates for Quadrant C Data is divided into 100 sec bins |
 |
 |
| Module-wise count rates for Quadrant D Data is divided into 100 sec bins |
 |
 |
| Parameter | Plot |
|---|---|
| CZT HV Monitor |  |
| D_VDD | 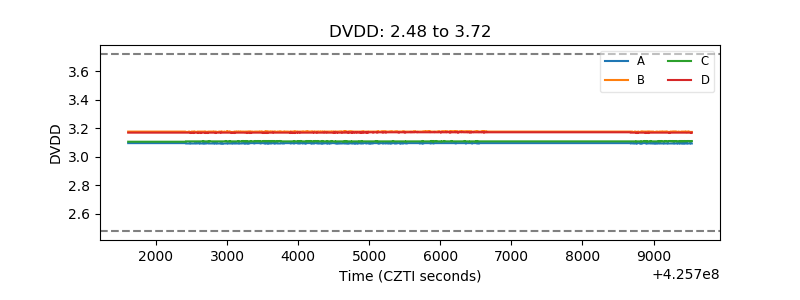 |
| Temperature 1 | 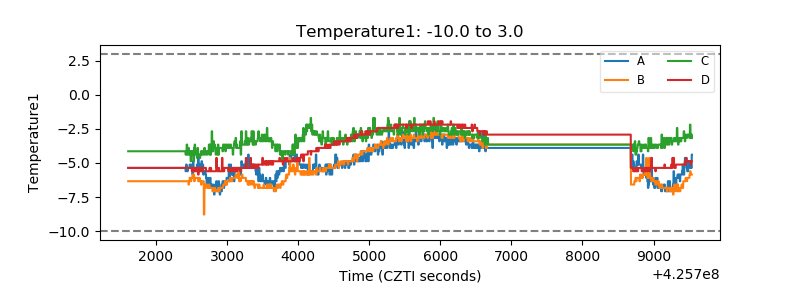 |
| Veto HV Monitor | 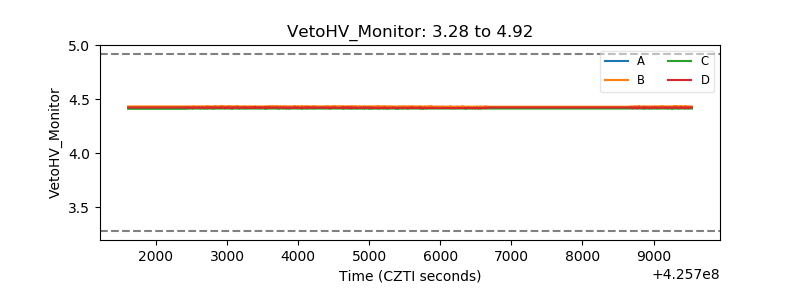 |
| Veto LLD | 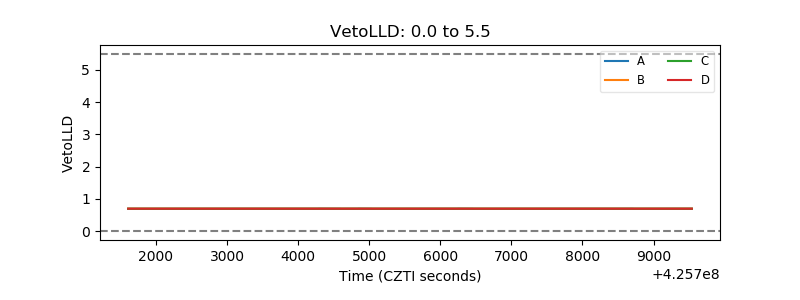 |
| Alpha Counter | 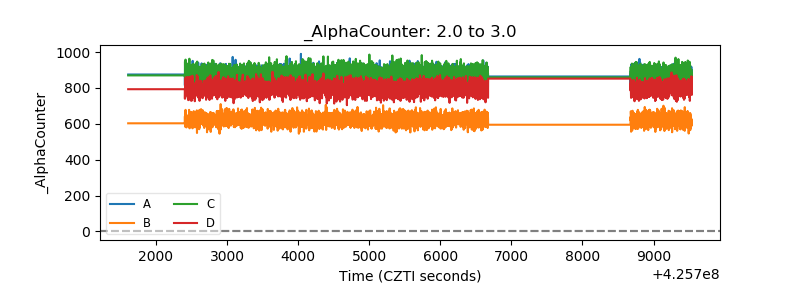 |
| _CPM_Rate | 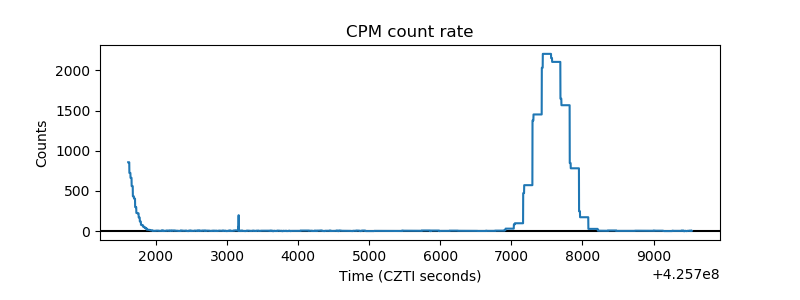 |
| CZT Counter | 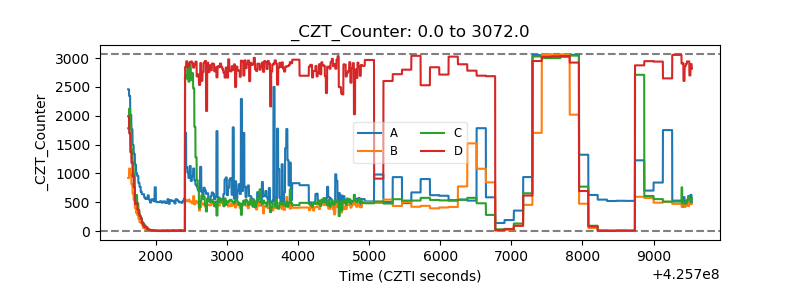 |
| +2.5 Volts monitor | 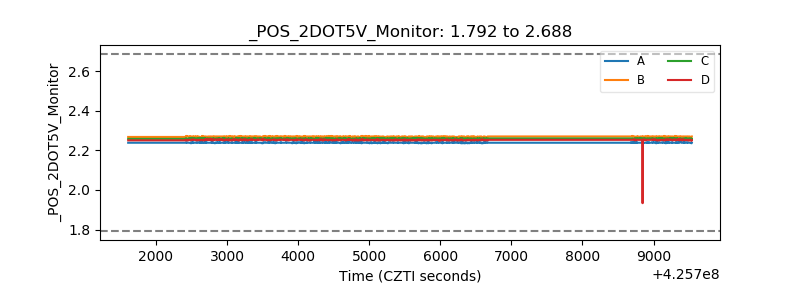 |
| +5 Volts monitor |  |
| _ROLL_ROT | 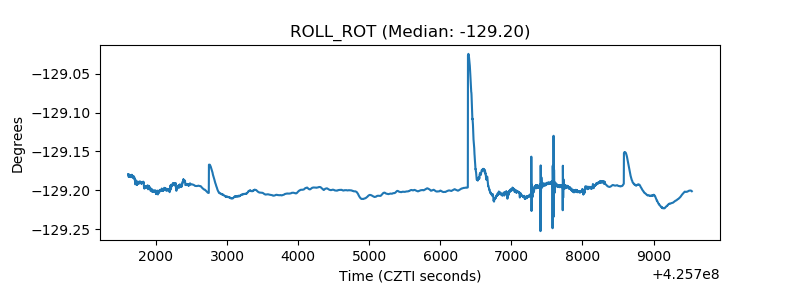 |
| _Roll_DEC | 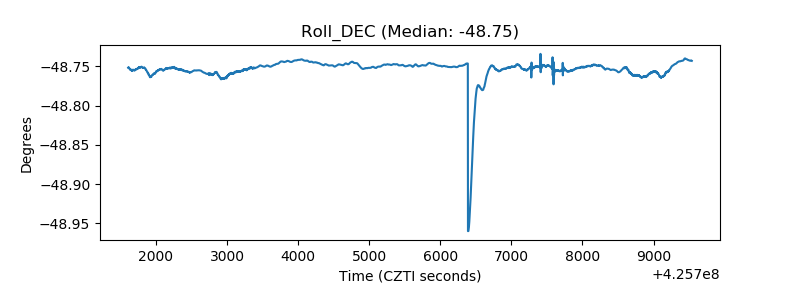 |
| _Roll_RA | 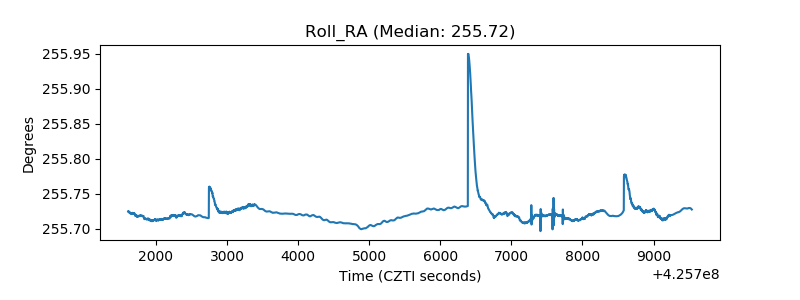 |
| Veto Counter | 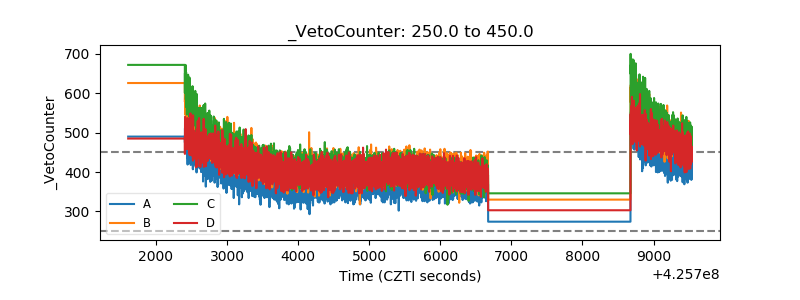 |