| Param | Original file | Final file |
|---|---|---|
| Filename | modeM0/AS1A12_099T01_9000005716_41909cztM0_level2.fits | modeM0/AS1A12_099T01_9000005716_41909cztM0_level2_quad_clean.evt |
| Size (bytes) | 629,300,160 | 71,887,680 |
| Size | 600.1 MB | 68.6 MB |
| Events in quadrant A | 3,719,204 | 597,016 |
| Events in quadrant B | 2,355,979 | 649,087 |
| Events in quadrant C | 3,172,408 | 580,377 |
| Events in quadrant D | 13,660,625 | 1,956 |
| Mode M9 | |||
|---|---|---|---|
| Quadrant | BADHDUFLAG | Total packets | Discarded packets |
| A | 0 | 23 | 0 |
| B | 0 | 23 | 0 |
| C | 0 | 24 | 0 |
| D | 0 | 24 | 0 |
| Mode M0 | |||
|---|---|---|---|
| Quadrant | BADHDUFLAG | Total packets | Discarded packets |
| A | 0 | 14073 | 2 |
| B | 0 | 10067 | 2 |
| C | 0 | 12123 | 2 |
| D | 0 | 43685 | 2 |
| Mode SS | |||
|---|---|---|---|
| Quadrant | BADHDUFLAG | Total packets | Discarded packets |
| A | 0 | 102 | 0 |
| B | 0 | 102 | 0 |
| C | 0 | 102 | 0 |
| D | 0 | 102 | 0 |
| Quadrant | Total seconds | Saturated seconds | Saturation percentage |
|---|---|---|---|
| A | 4966 | 256 | 5.155054% |
| B | 4966 | 5 | 0.100685% |
| C | 4966 | 274 | 5.517519% |
| D | 4966 | 4955 | 99.778494% |
Noise dominated data is calculated using 1-second bins in cleaned event files. If a bin has >2000 counts, and if more than 50% of those come from <1% of pixels, then it is considered to be noise-dominated and hence unusable.
| Quadrant | # 1 sec bins | Bins with >0 counts | Bins with >2000 counts | High rate bins dominated by noise | Noise dominated (total time) | Noise dominated (detector-on time) | Marked lightcurve |
|---|---|---|---|---|---|---|---|
| A | 7059 | 4967 | 183 | 183 | 2.59% | 3.68% | 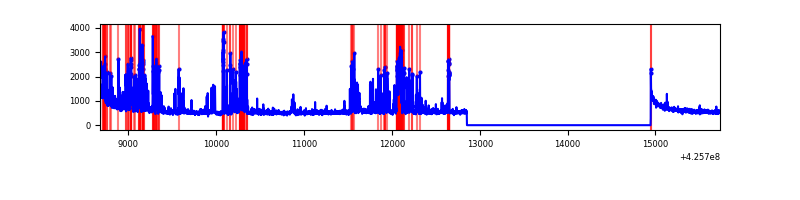 |
| B | 7059 | 4967 | 1 | 1 | 0.01% | 0.02% | 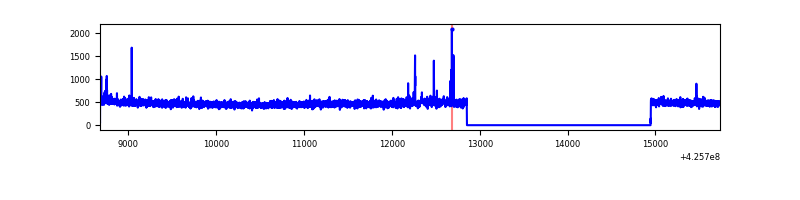 |
| C | 7059 | 4967 | 267 | 267 | 3.78% | 5.38% | 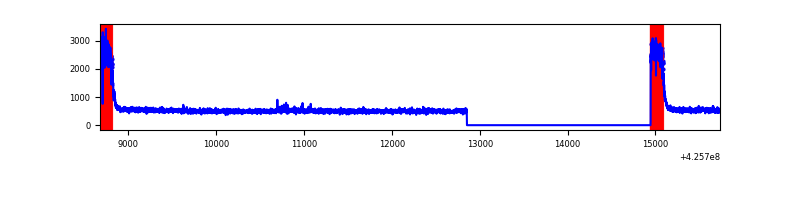 |
| D | 7059 | 4967 | 4478 | 4478 | 63.44% | 90.16% | 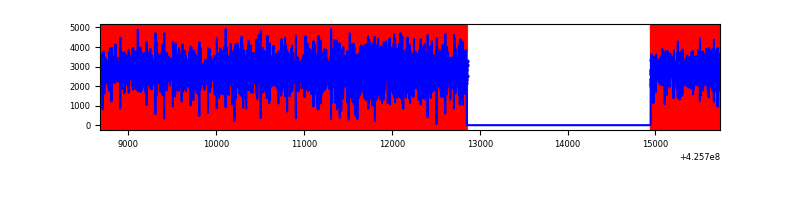 |
Top three noisy pixels from each quadrant. If the there are fewer than three noisy pixels in the level2.evt file, extra rows are filled as -1
| Pixel properties | Quadrant properties | ||||||
|---|---|---|---|---|---|---|---|
| Quadrant | DetID | PixID | Counts | Sigma | Mean | Median | Sigma |
| A | 14 | 24 | 894778 | 7645.23 | 575 | 564 | 117.0 |
| A | 10 | 83 | 495427 | 4230.91 | 575 | 564 | 117.0 |
| A | 15 | 223 | 93067 | 790.87 | 575 | 564 | 117.0 |
| B | 0 | 245 | 31846 | 279.22 | 587 | 572 | 112.0 |
| B | 12 | 111 | 13915 | 119.13 | 587 | 572 | 112.0 |
| B | 11 | 111 | 12673 | 108.04 | 587 | 572 | 112.0 |
| C | 0 | 10 | 758208 | 5855.12 | 561 | 566 | 129.4 |
| C | 15 | 214 | 193719 | 1492.7 | 561 | 566 | 129.4 |
| C | 0 | 15 | 17734 | 132.68 | 561 | 566 | 129.4 |
| D | 12 | 79 | 12839146 | 504485.71 | 98 | 94 | 25.4 |
| D | 13 | 249 | 340812 | 13387.85 | 98 | 94 | 25.4 |
| D | 2 | 249 | 71746 | 2815.43 | 98 | 94 | 25.4 |
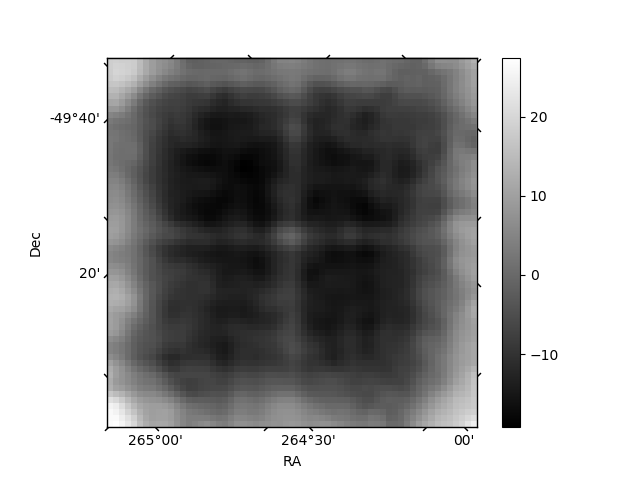
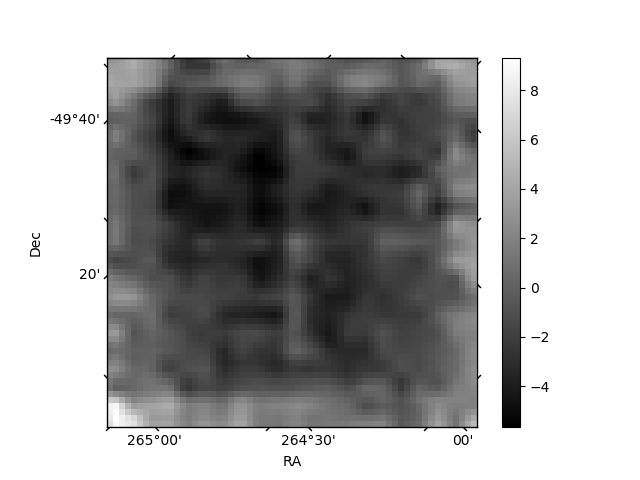
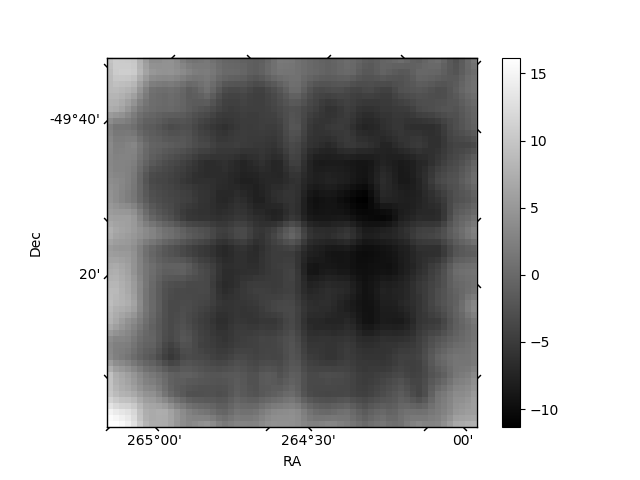
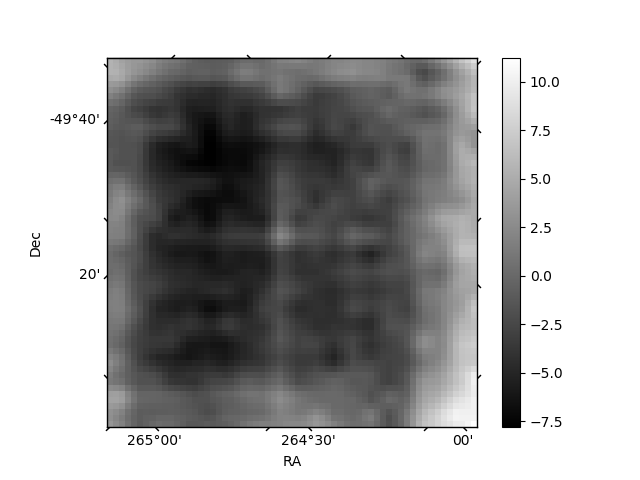
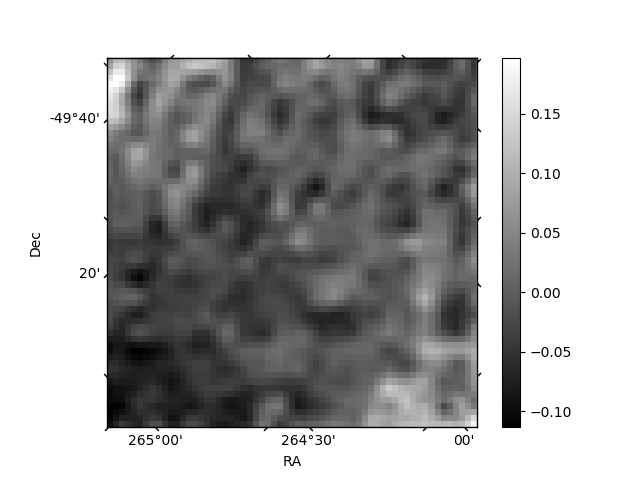
Histogram calculated using DETX and DETY for each event in the final _common_clean file
| Quadrant A | 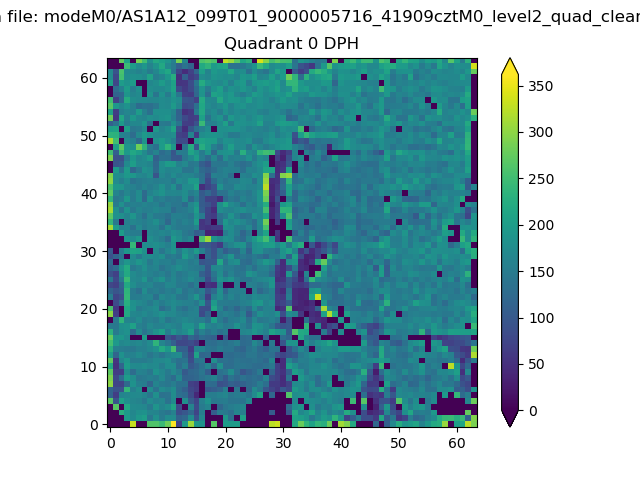 |
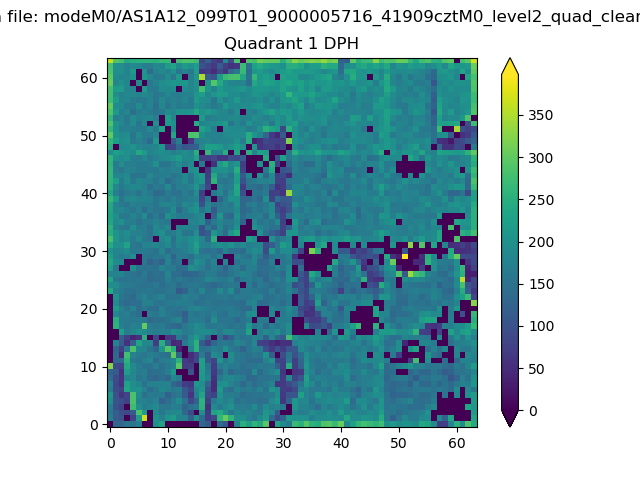 |
Quadrant B |
|---|---|---|---|
| Quadrant D | 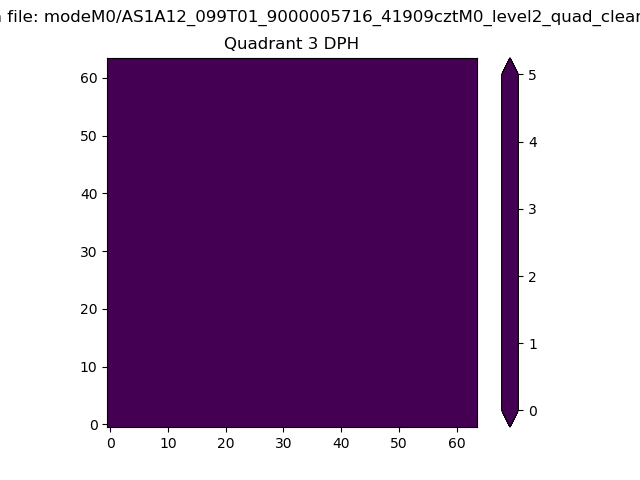 |
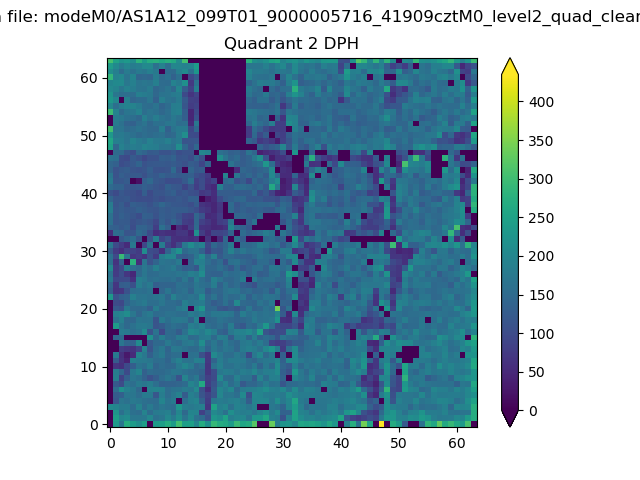 |
Quadrant C |
| Plot type | Count rate plots | Images |
|---|---|---|
| Comparison with Poisson distribution Blue bars denote a histogram of data divided into 1 sec bins. Red curve is a Poisson curve with rate = median count rate of data. |
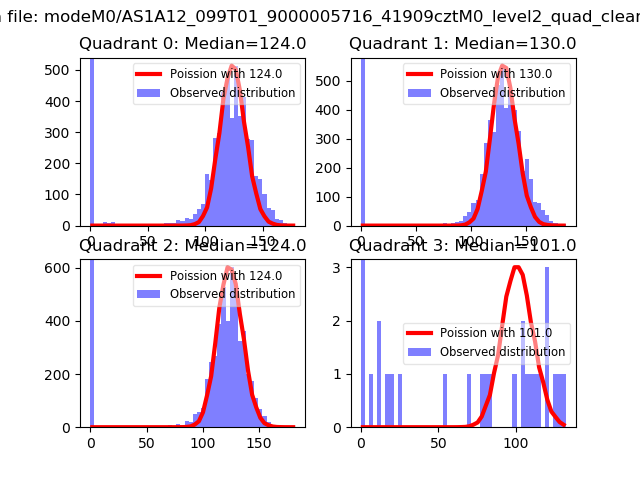 |
 |
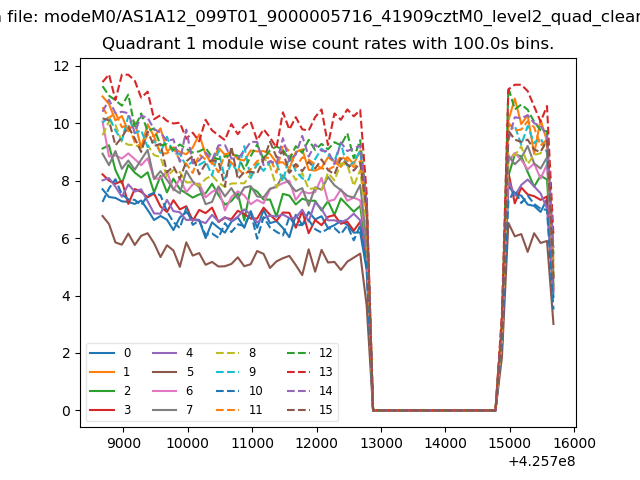
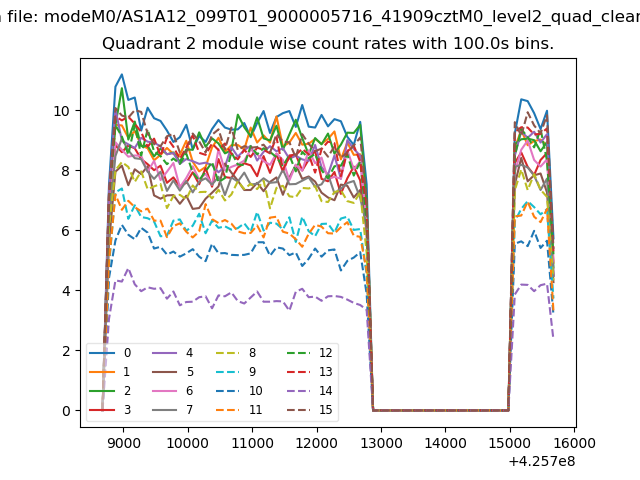
| Quadrant-wise count rates Data is divided into 100 sec bins |
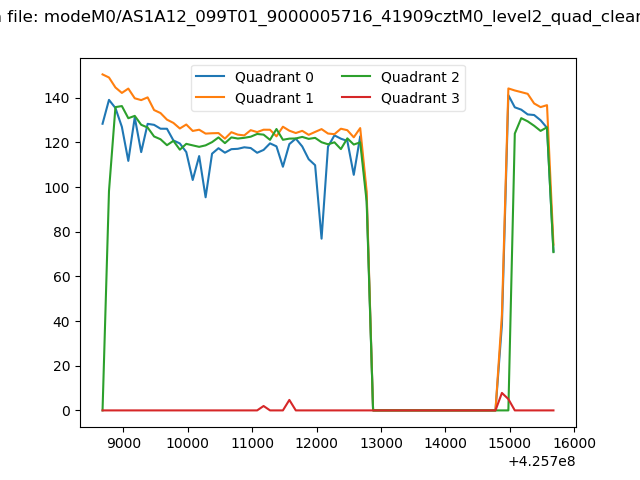 |
|
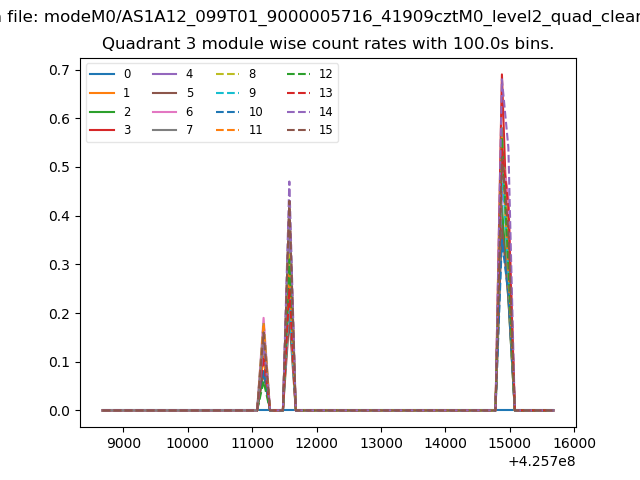
| Module-wise count rates for Quadrant A Data is divided into 100 sec bins |
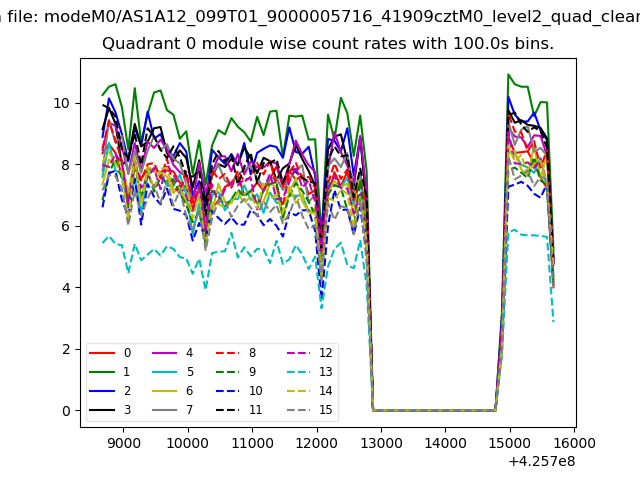 |
 |
| Module-wise count rates for Quadrant B Data is divided into 100 sec bins |
 |
 |
| Module-wise count rates for Quadrant C Data is divided into 100 sec bins |
 |
 |
| Module-wise count rates for Quadrant D Data is divided into 100 sec bins |
 |
 |
| Parameter | Plot |
|---|---|
| CZT HV Monitor | 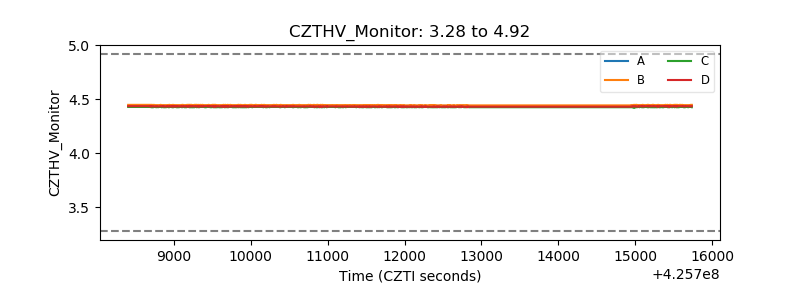 |
| D_VDD | 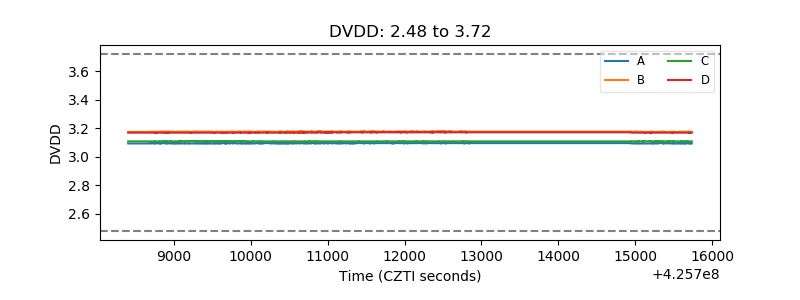 |
| Temperature 1 | 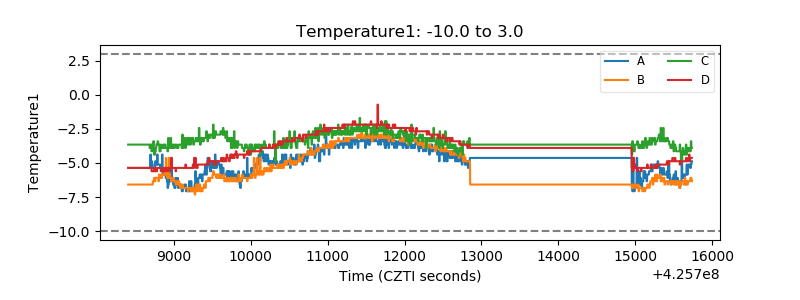 |
| Veto HV Monitor | 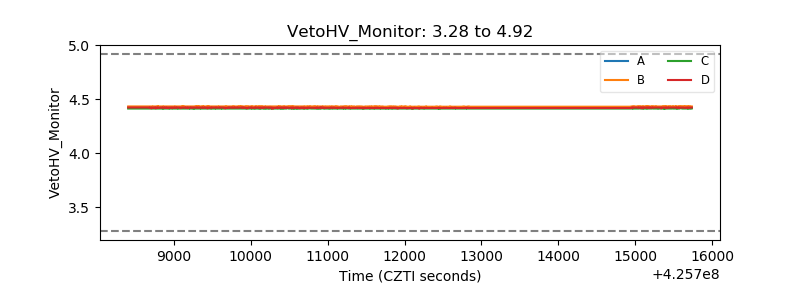 |
| Veto LLD | 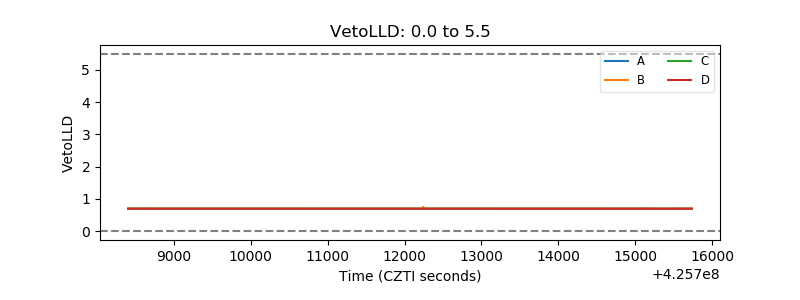 |
| Alpha Counter |  |
| _CPM_Rate |  |
| CZT Counter | 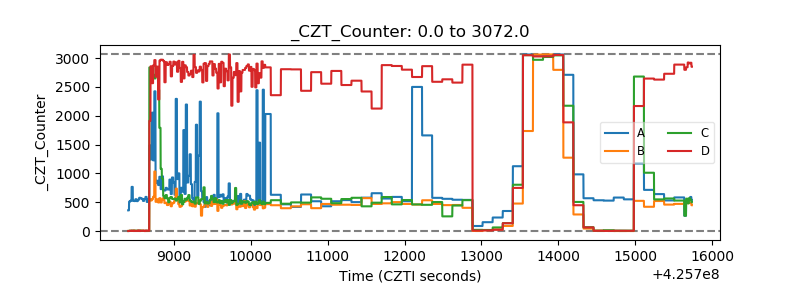 |
| +2.5 Volts monitor | 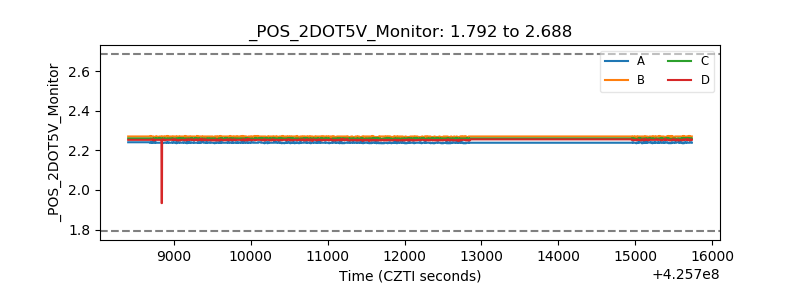 |
| +5 Volts monitor |  |
| _ROLL_ROT | 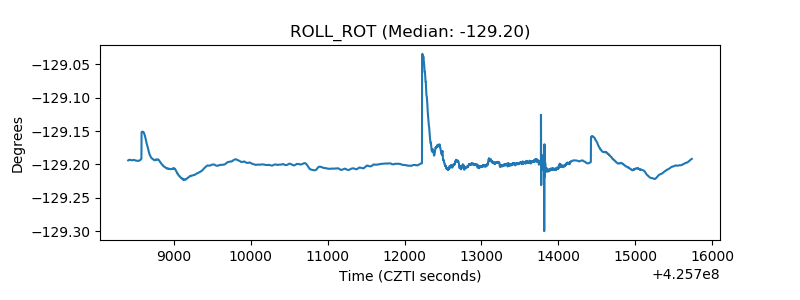 |
| _Roll_DEC | 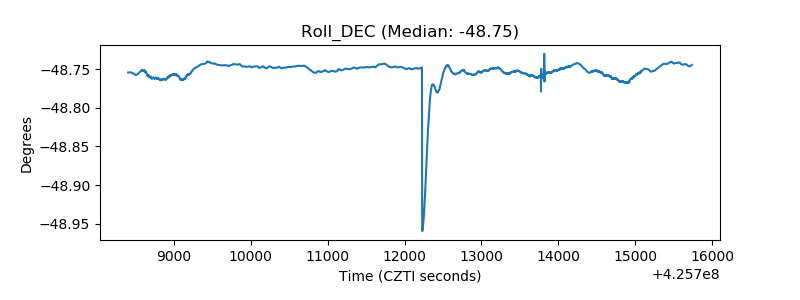 |
| _Roll_RA | 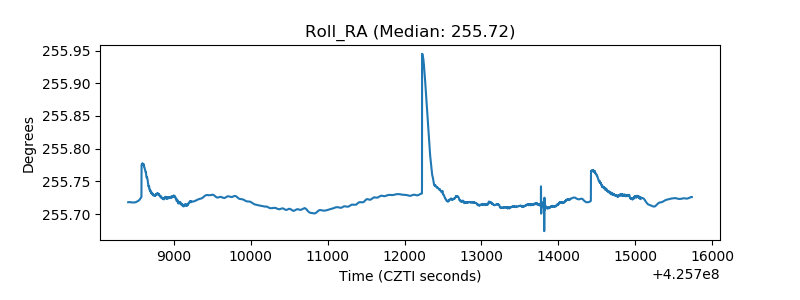 |
| Veto Counter | 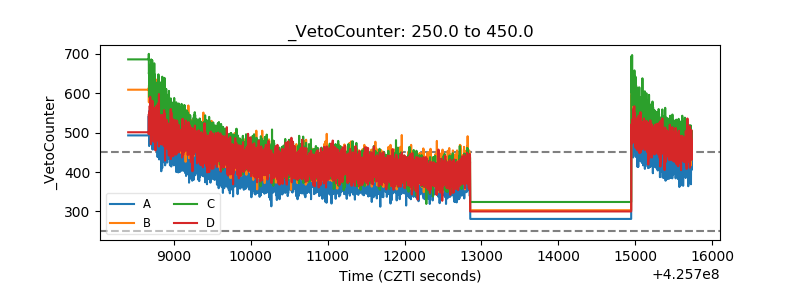 |