| Param | Original file | Final file |
|---|---|---|
| Filename | modeM0/AS1A12_099T01_9000005716_41912cztM0_level2.fits | modeM0/AS1A12_099T01_9000005716_41912cztM0_level2_quad_clean.evt |
| Size (bytes) | 655,479,360 | 68,169,600 |
| Size | 625.1 MB | 65.0 MB |
| Events in quadrant A | 3,946,862 | 554,110 |
| Events in quadrant B | 2,373,677 | 597,858 |
| Events in quadrant C | 3,147,328 | 546,712 |
| Events in quadrant D | 14,392,329 | 2,021 |
| Mode M9 | |||
|---|---|---|---|
| Quadrant | BADHDUFLAG | Total packets | Discarded packets |
| A | 0 | 30 | 0 |
| B | 0 | 30 | 0 |
| C | 0 | 31 | 0 |
| D | 0 | 31 | 0 |
| Mode M0 | |||
|---|---|---|---|
| Quadrant | BADHDUFLAG | Total packets | Discarded packets |
| A | 0 | 14953 | 2 |
| B | 0 | 10546 | 3 |
| C | 0 | 12528 | 2 |
| D | 0 | 45761 | 2 |
| Mode SS | |||
|---|---|---|---|
| Quadrant | BADHDUFLAG | Total packets | Discarded packets |
| A | 0 | 106 | 0 |
| B | 0 | 106 | 0 |
| C | 0 | 106 | 0 |
| D | 0 | 106 | 0 |
| Quadrant | Total seconds | Saturated seconds | Saturation percentage |
|---|---|---|---|
| A | 5187 | 316 | 6.092153% |
| B | 5186 | 11 | 0.212110% |
| C | 5186 | 283 | 5.457000% |
| D | 5186 | 5172 | 99.730042% |
Noise dominated data is calculated using 1-second bins in cleaned event files. If a bin has >2000 counts, and if more than 50% of those come from <1% of pixels, then it is considered to be noise-dominated and hence unusable.
| Quadrant | # 1 sec bins | Bins with >0 counts | Bins with >2000 counts | High rate bins dominated by noise | Noise dominated (total time) | Noise dominated (detector-on time) | Marked lightcurve |
|---|---|---|---|---|---|---|---|
| A | 7068 | 5188 | 244 | 244 | 3.45% | 4.70% | 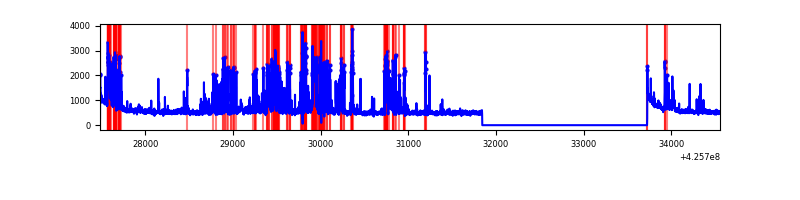 |
| B | 7067 | 5187 | 3 | 3 | 0.04% | 0.06% | 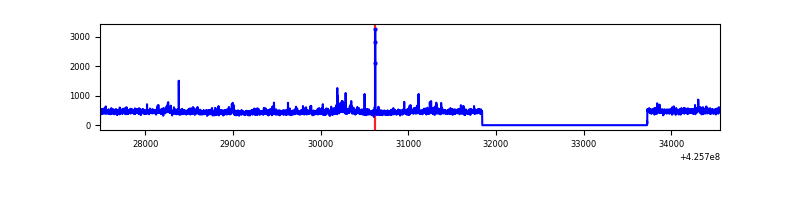 |
| C | 7067 | 5187 | 275 | 275 | 3.89% | 5.30% | 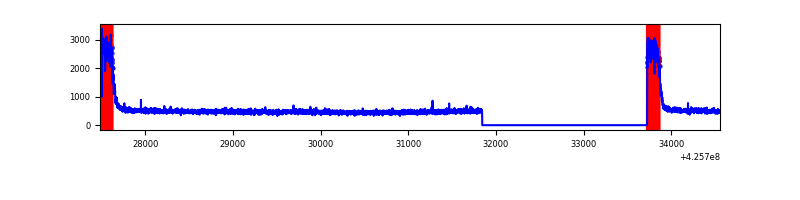 |
| D | 7067 | 5187 | 4883 | 4883 | 69.10% | 94.14% | 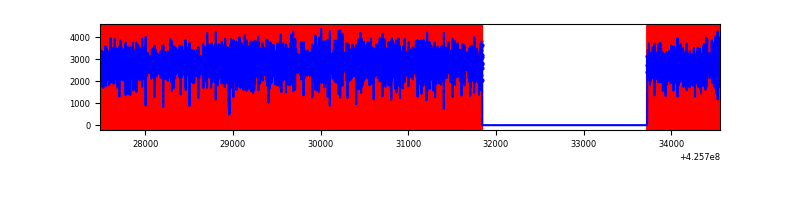 |
Top three noisy pixels from each quadrant. If the there are fewer than three noisy pixels in the level2.evt file, extra rows are filled as -1
| Pixel properties | Quadrant properties | ||||||
|---|---|---|---|---|---|---|---|
| Quadrant | DetID | PixID | Counts | Sigma | Mean | Median | Sigma |
| A | 14 | 24 | 1269086 | 11118.53 | 558 | 548 | 114.1 |
| A | 10 | 83 | 502528 | 4399.77 | 558 | 548 | 114.1 |
| A | 13 | 6 | 11170 | 93.1 | 558 | 548 | 114.1 |
| B | 0 | 190 | 48533 | 435.94 | 566 | 549 | 110.1 |
| B | 5 | 255 | 43783 | 392.78 | 566 | 549 | 110.1 |
| B | 0 | 245 | 26851 | 238.96 | 566 | 549 | 110.1 |
| C | 0 | 10 | 826898 | 6588.94 | 535 | 537 | 125.4 |
| C | 15 | 214 | 203982 | 1622.16 | 535 | 537 | 125.4 |
| C | 0 | 15 | 30798 | 241.28 | 535 | 537 | 125.4 |
| D | 12 | 79 | 13749730 | 435513.56 | 124 | 120 | 31.6 |
| D | 2 | 120 | 58828 | 1859.54 | 124 | 120 | 31.6 |
| D | 13 | 249 | 49243 | 1555.94 | 124 | 120 | 31.6 |
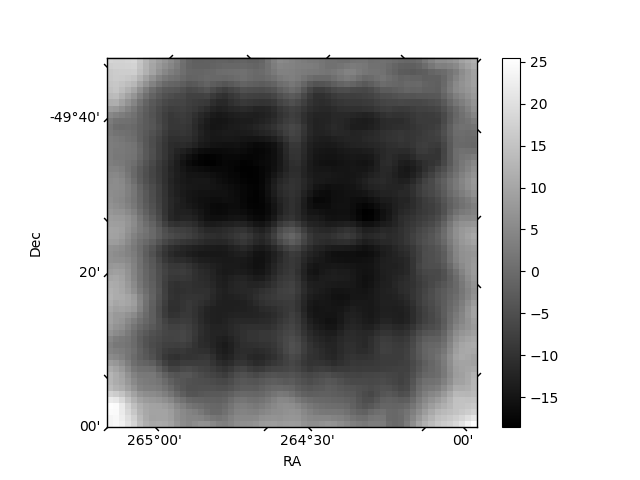
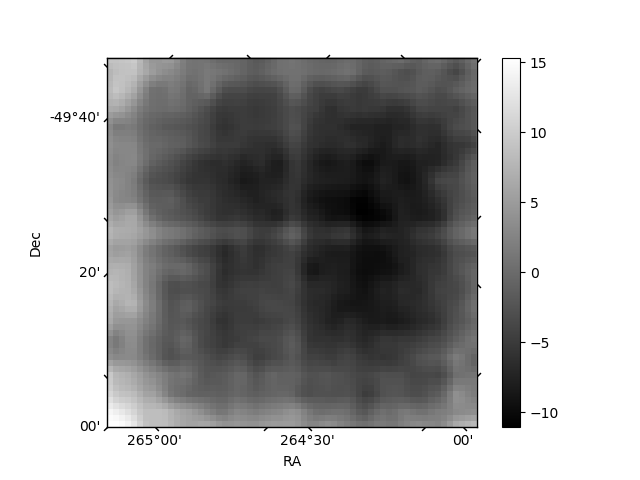
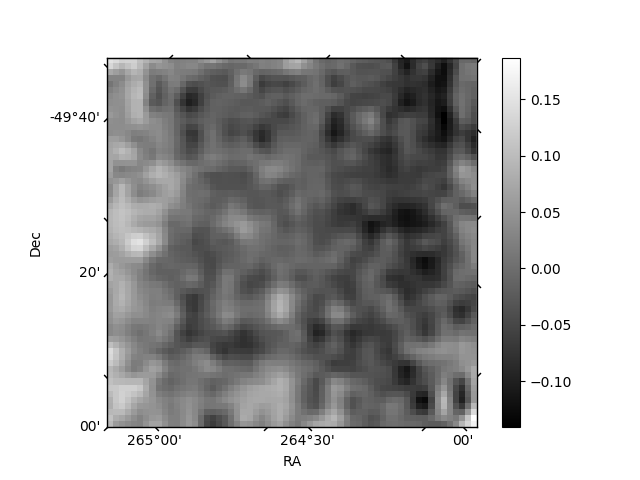
Histogram calculated using DETX and DETY for each event in the final _common_clean file
| Quadrant A | 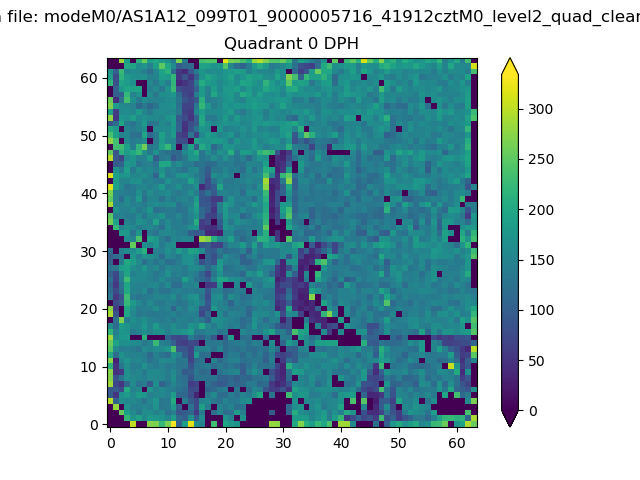 |
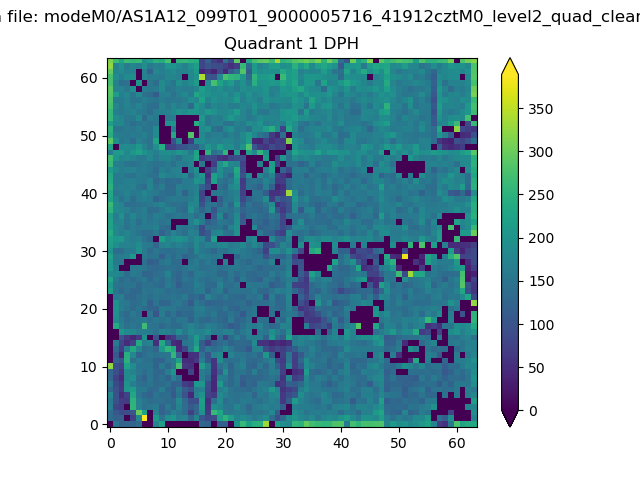 |
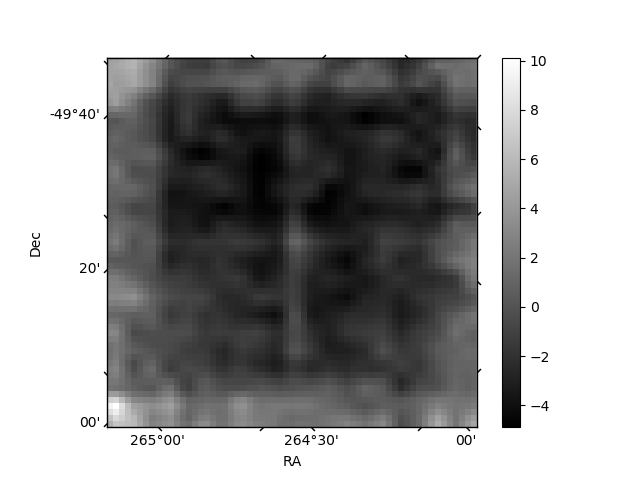
Quadrant B |
|---|---|---|---|
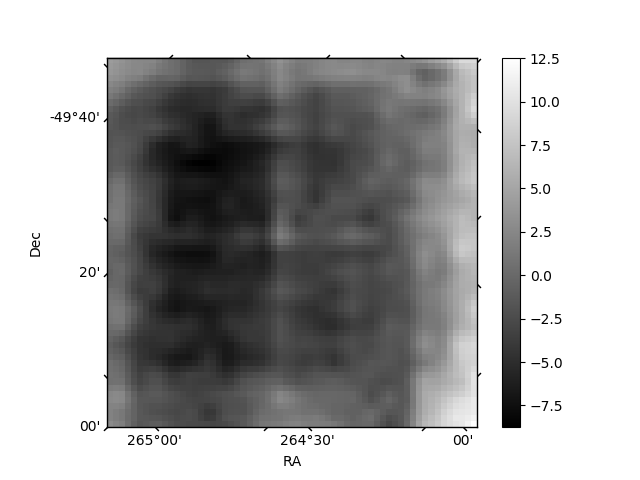
| Quadrant D | 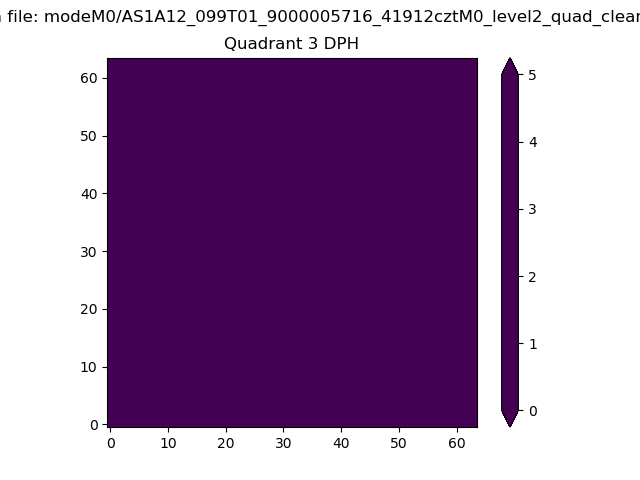 |
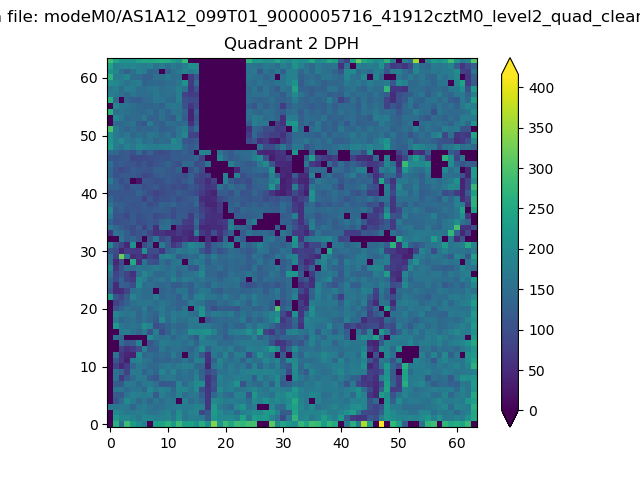 |
Quadrant C |
| Plot type | Count rate plots | Images |
|---|---|---|
| Comparison with Poisson distribution Blue bars denote a histogram of data divided into 1 sec bins. Red curve is a Poisson curve with rate = median count rate of data. |
 |
 |
| Quadrant-wise count rates Data is divided into 100 sec bins |
 |
|
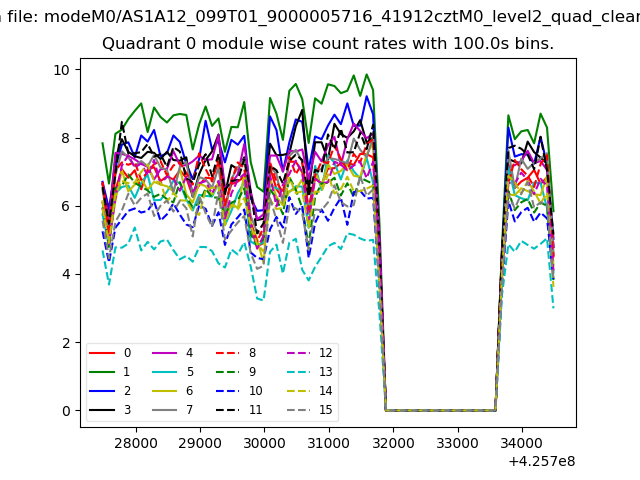
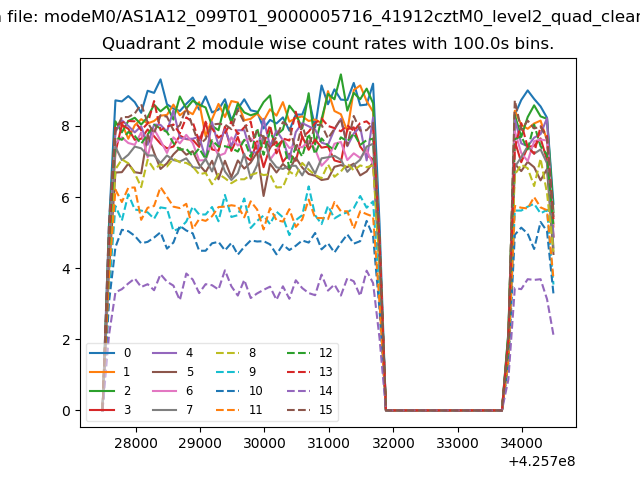
| Module-wise count rates for Quadrant A Data is divided into 100 sec bins |
 |
 |
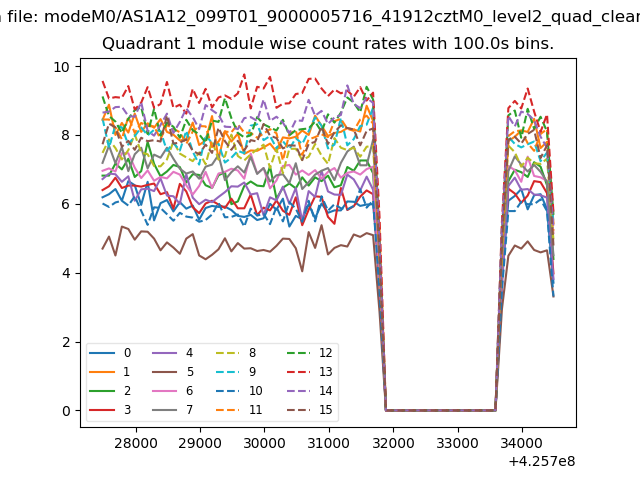
| Module-wise count rates for Quadrant B Data is divided into 100 sec bins |
 |
 |
| Module-wise count rates for Quadrant C Data is divided into 100 sec bins |
 |
 |
| Module-wise count rates for Quadrant D Data is divided into 100 sec bins |
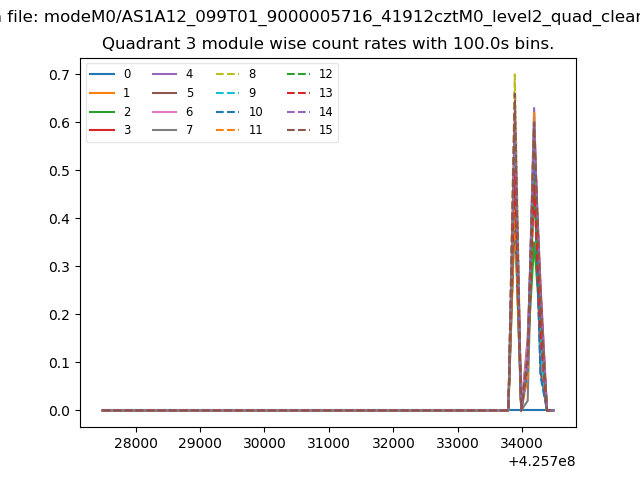 |
 |
| Parameter | Plot |
|---|---|
| CZT HV Monitor | 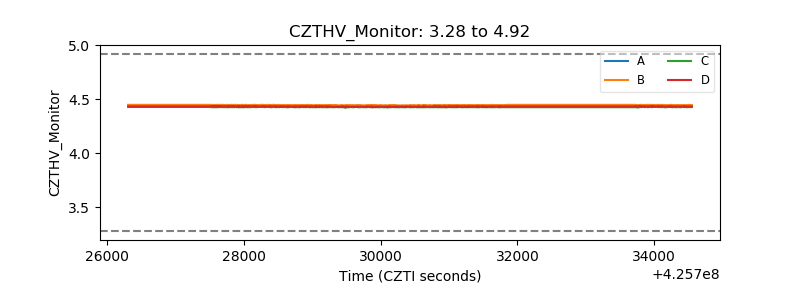 |
| D_VDD | 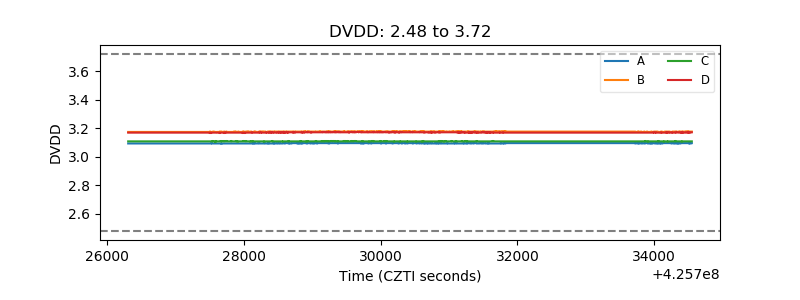 |
| Temperature 1 | 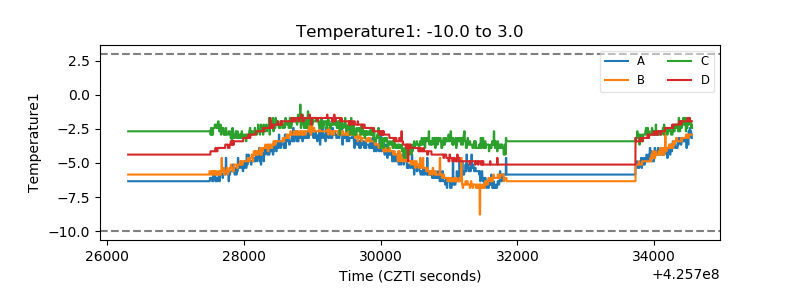 |
| Veto HV Monitor | 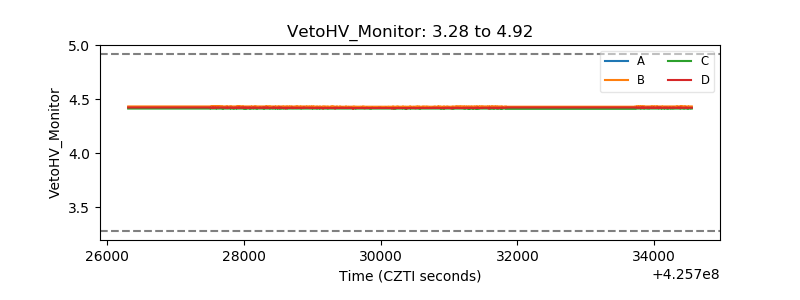 |
| Veto LLD | 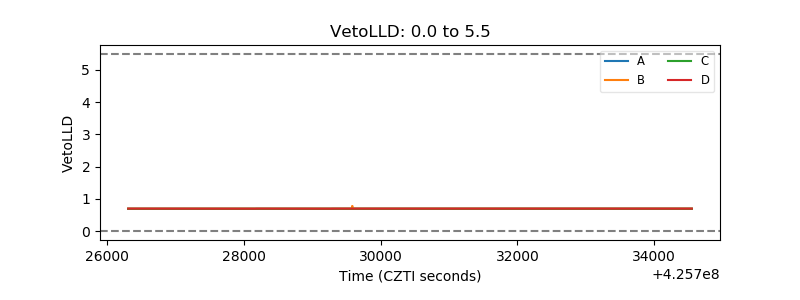 |
| Alpha Counter |  |
| _CPM_Rate |  |
| CZT Counter |  |
| +2.5 Volts monitor | 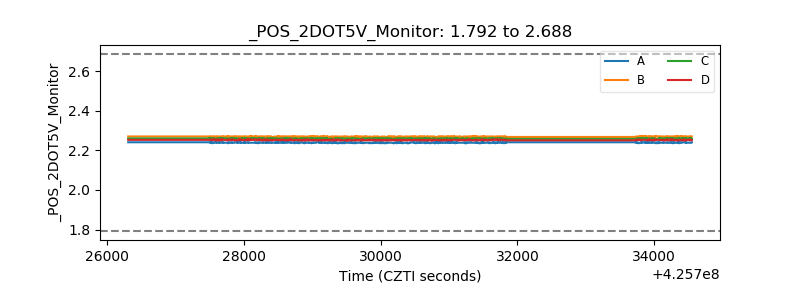 |
| +5 Volts monitor |  |
| _ROLL_ROT | 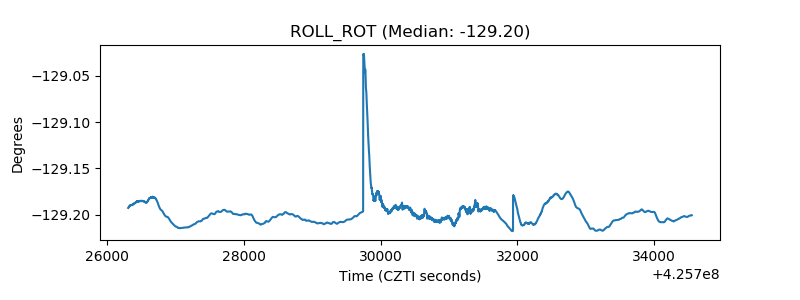 |
| _Roll_DEC | 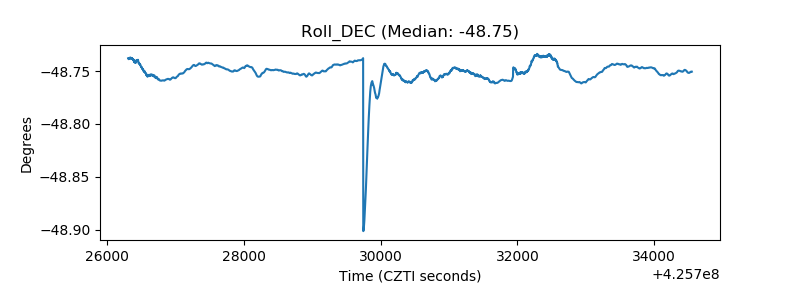 |
| _Roll_RA | 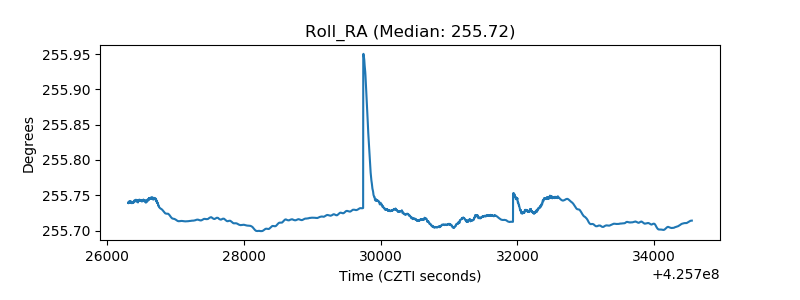 |
| Veto Counter | 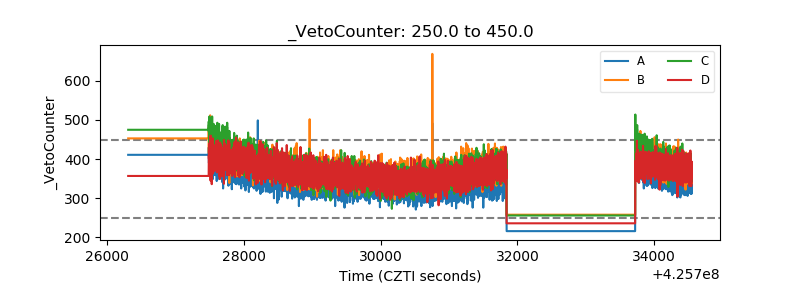 |