| Param | Original file | Final file |
|---|---|---|
| Filename | modeM0/AS1A12_099T01_9000005716_41914cztM0_level2.fits | modeM0/AS1A12_099T01_9000005716_41914cztM0_level2_quad_clean.evt |
| Size (bytes) | 207,060,480 | 23,408,640 |
| Size | 197.5 MB | 22.3 MB |
| Events in quadrant A | 1,678,366 | 160,680 |
| Events in quadrant B | 788,331 | 192,198 |
| Events in quadrant C | 1,131,052 | 174,958 |
| Events in quadrant D | 3,928,712 | 52,728 |
| Mode M9 | |||
|---|---|---|---|
| Quadrant | BADHDUFLAG | Total packets | Discarded packets |
| A | 0 | 5 | 0 |
| B | 0 | 5 | 0 |
| C | 0 | 6 | 0 |
| D | 0 | 6 | 0 |
| Mode M0 | |||
|---|---|---|---|
| Quadrant | BADHDUFLAG | Total packets | Discarded packets |
| A | 0 | 6132 | 1 |
| B | 0 | 3523 | 1 |
| C | 0 | 4476 | 1 |
| D | 0 | 12773 | 1 |
| Mode SS | |||
|---|---|---|---|
| Quadrant | BADHDUFLAG | Total packets | Discarded packets |
| A | 0 | 36 | 0 |
| B | 0 | 36 | 0 |
| C | 0 | 36 | 0 |
| D | 0 | 36 | 0 |
| Quadrant | Total seconds | Saturated seconds | Saturation percentage |
|---|---|---|---|
| A | 1747 | 275 | 15.741271% |
| B | 1747 | 2 | 0.114482% |
| C | 1747 | 130 | 7.441328% |
| D | 1747 | 1283 | 73.440183% |
Noise dominated data is calculated using 1-second bins in cleaned event files. If a bin has >2000 counts, and if more than 50% of those come from <1% of pixels, then it is considered to be noise-dominated and hence unusable.
| Quadrant | # 1 sec bins | Bins with >0 counts | Bins with >2000 counts | High rate bins dominated by noise | Noise dominated (total time) | Noise dominated (detector-on time) | Marked lightcurve |
|---|---|---|---|---|---|---|---|
| A | 1747 | 1747 | 231 | 231 | 13.22% | 13.22% | 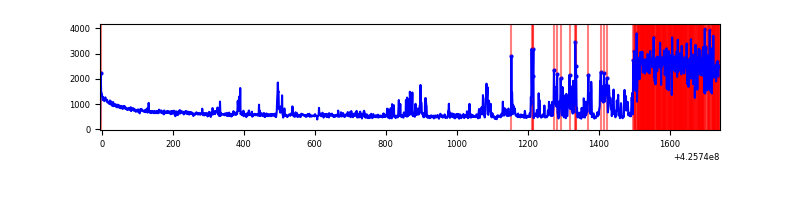 |
| B | 1747 | 1747 | 0 | 0 | 0.00% | 0.00% | 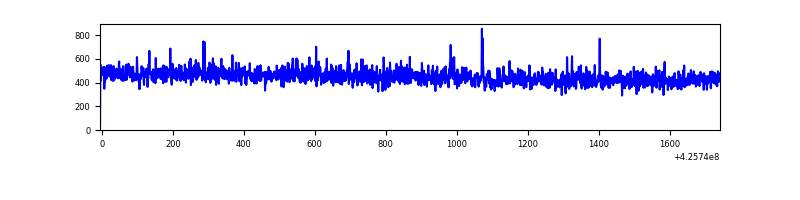 |
| C | 1747 | 1747 | 128 | 128 | 7.33% | 7.33% |  |
| D | 1747 | 1747 | 1239 | 1239 | 70.92% | 70.92% | 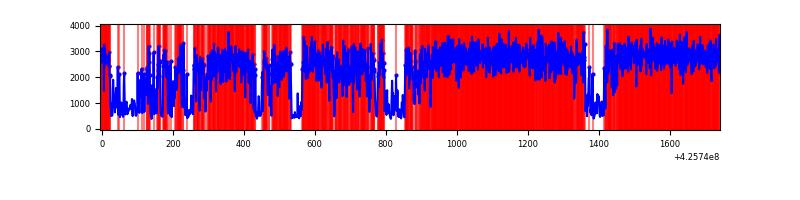 |
Top three noisy pixels from each quadrant. If the there are fewer than three noisy pixels in the level2.evt file, extra rows are filled as -1
| Pixel properties | Quadrant properties | ||||||
|---|---|---|---|---|---|---|---|
| Quadrant | DetID | PixID | Counts | Sigma | Mean | Median | Sigma |
| A | 14 | 24 | 800646 | 21995.47 | 170 | 166 | 36.4 |
| A | 10 | 83 | 200342 | 5500.41 | 170 | 166 | 36.4 |
| A | 3 | 1 | 10181 | 275.19 | 170 | 166 | 36.4 |
| B | 7 | 202 | 40031 | 1022.34 | 187 | 182 | 39.0 |
| B | 12 | 111 | 4678 | 115.35 | 187 | 182 | 39.0 |
| B | 11 | 111 | 4450 | 109.5 | 187 | 182 | 39.0 |
| C | 0 | 10 | 369706 | 8733.94 | 174 | 174 | 42.3 |
| C | 15 | 214 | 69759 | 1644.65 | 174 | 174 | 42.3 |
| C | 0 | 15 | 11378 | 264.81 | 174 | 174 | 42.3 |
| D | 12 | 79 | 3439942 | 127457.83 | 102 | 99 | 27.0 |
| D | 13 | 249 | 34042 | 1257.7 | 102 | 99 | 27.0 |
| D | 10 | 199 | 22747 | 839.19 | 102 | 99 | 27.0 |
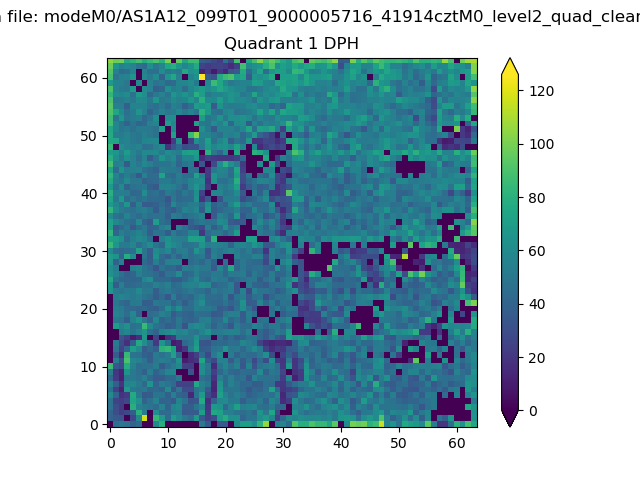
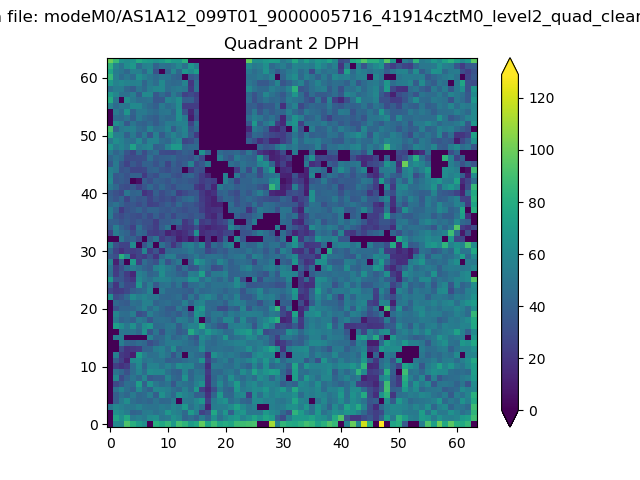
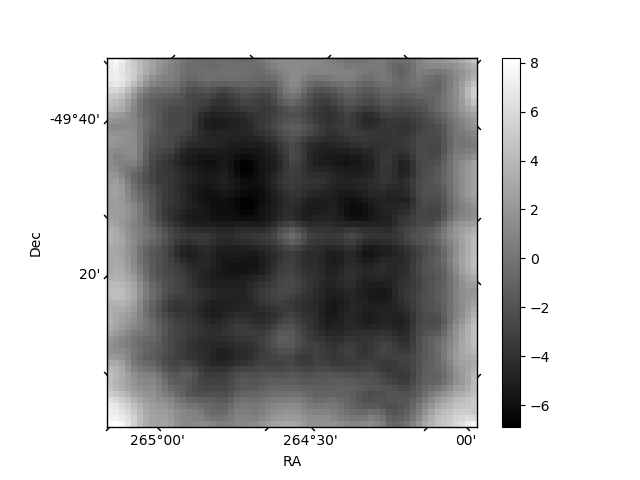
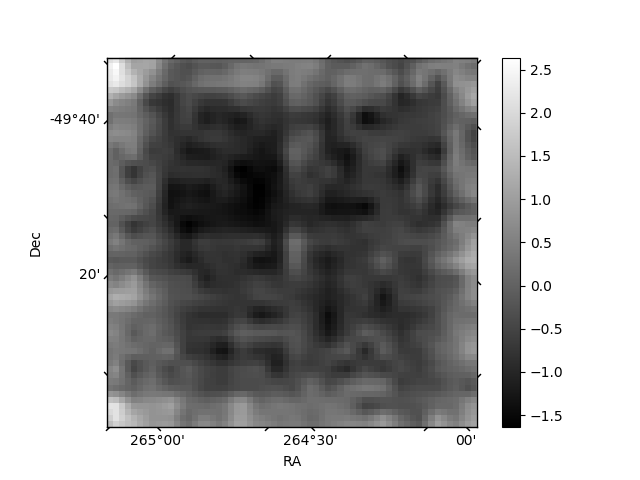
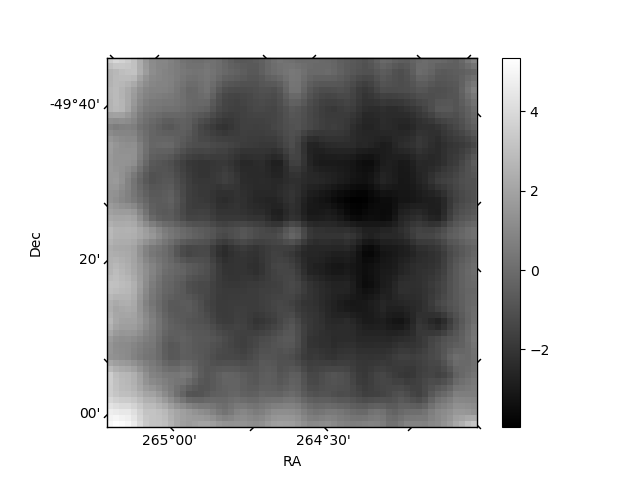
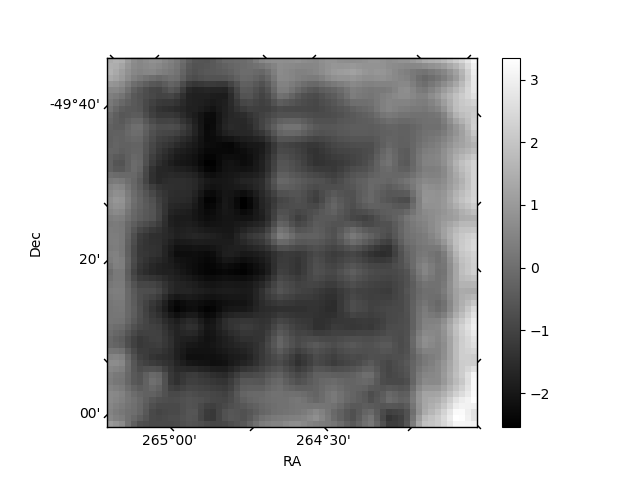
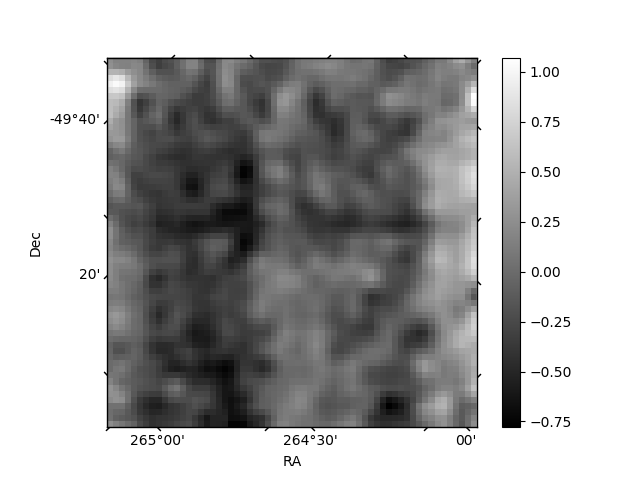
Histogram calculated using DETX and DETY for each event in the final _common_clean file
| Quadrant A | 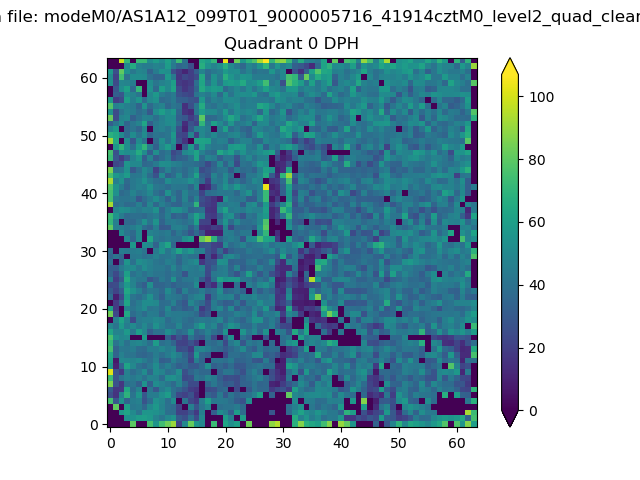 |
 |
Quadrant B |
|---|---|---|---|
| Quadrant D | 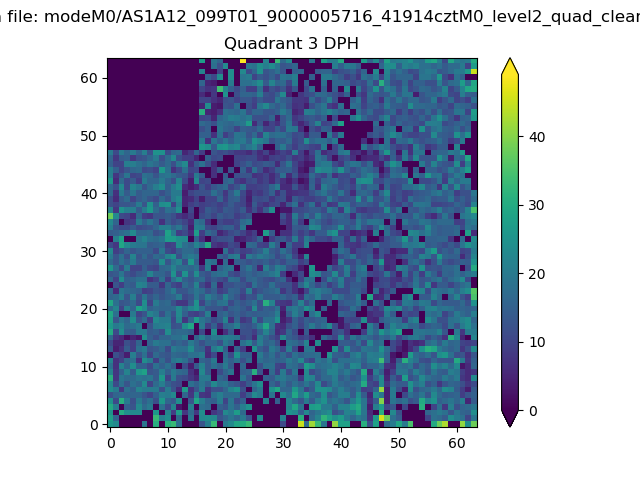 |
 |
Quadrant C |
| Plot type | Count rate plots | Images |
|---|---|---|
| Comparison with Poisson distribution Blue bars denote a histogram of data divided into 1 sec bins. Red curve is a Poisson curve with rate = median count rate of data. |
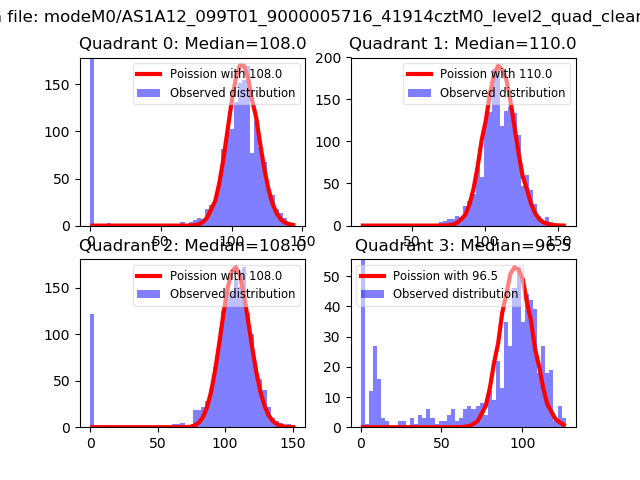 |
 |
| Quadrant-wise count rates Data is divided into 100 sec bins |
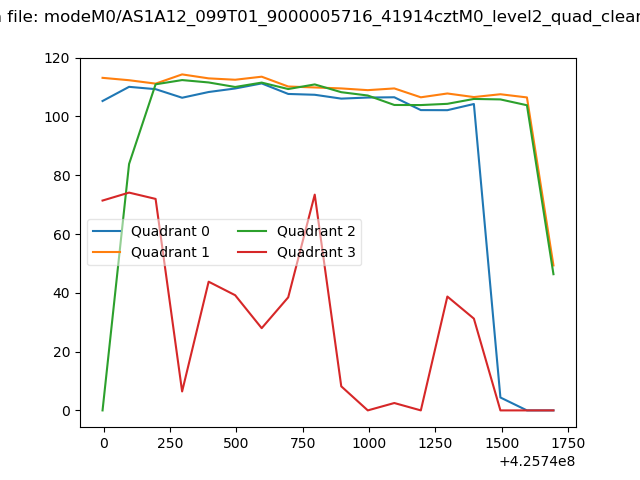 |
|
| Module-wise count rates for Quadrant A Data is divided into 100 sec bins |
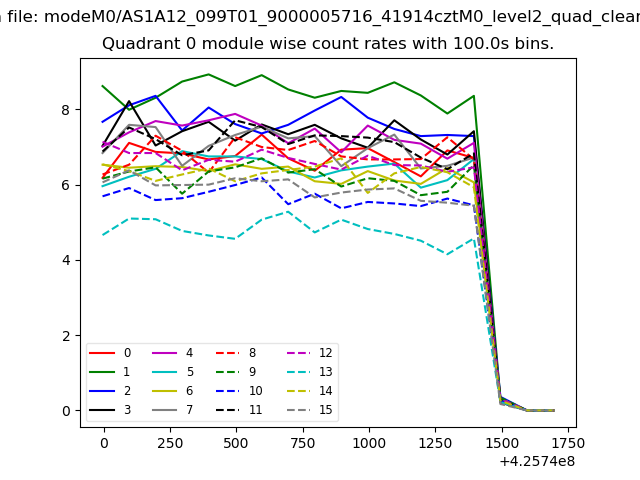 |
 |
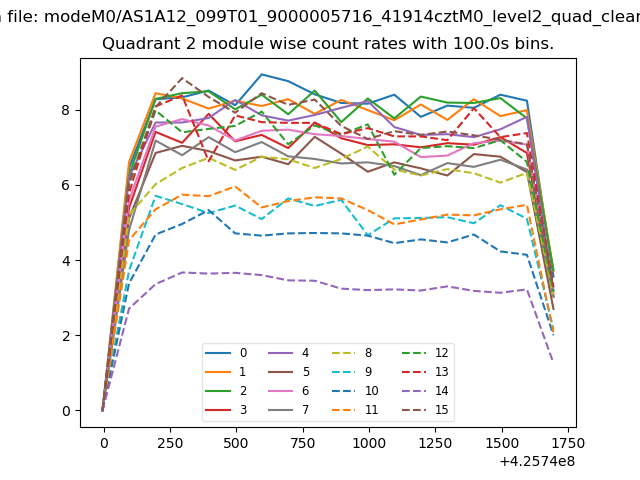
| Module-wise count rates for Quadrant B Data is divided into 100 sec bins |
 |
 |
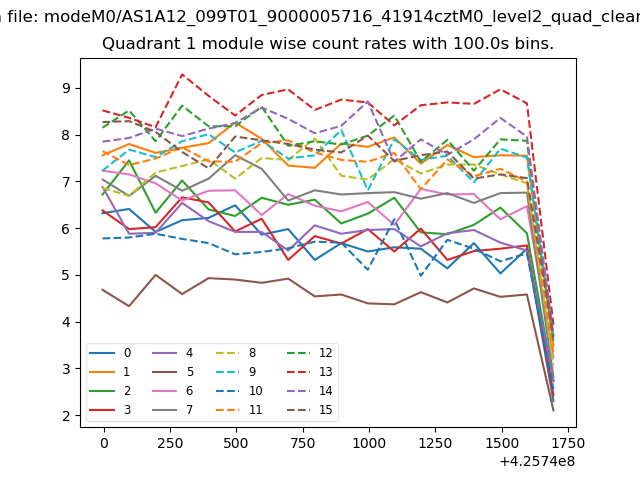
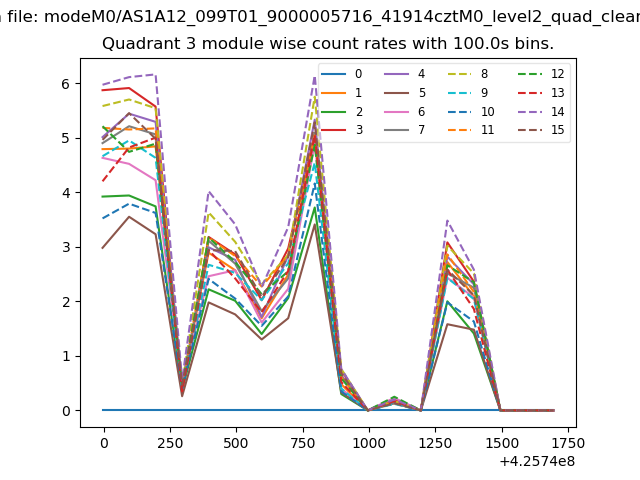
| Module-wise count rates for Quadrant C Data is divided into 100 sec bins |
 |
 |
| Module-wise count rates for Quadrant D Data is divided into 100 sec bins |
 |
 |
| Parameter | Plot |
|---|---|
| CZT HV Monitor | 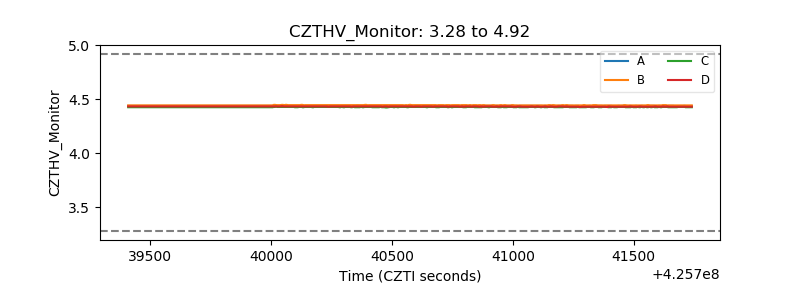 |
| D_VDD | 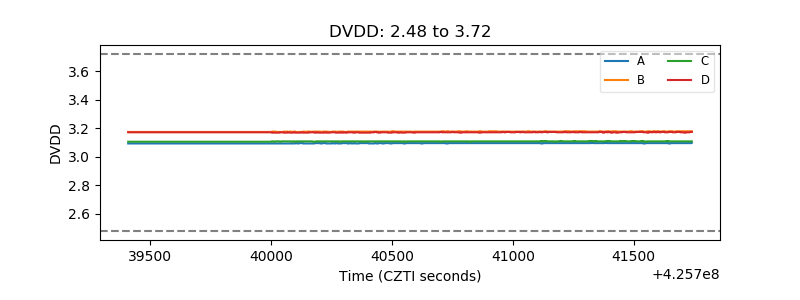 |
| Temperature 1 | 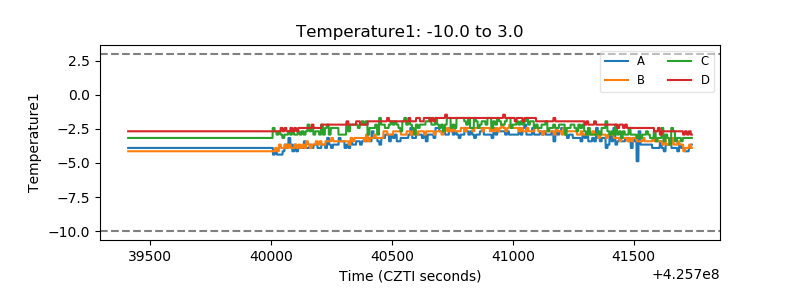 |
| Veto HV Monitor |  |
| Veto LLD |  |
| Alpha Counter |  |
| _CPM_Rate |  |
| CZT Counter | 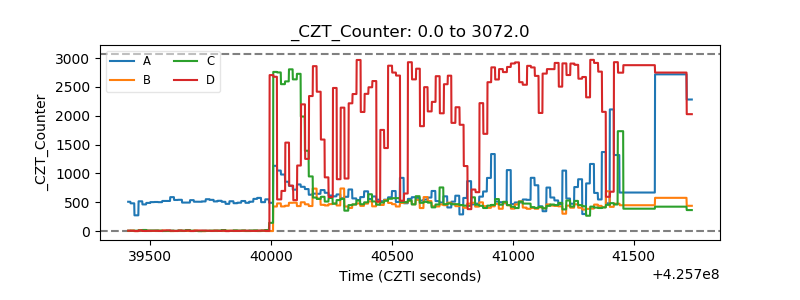 |
| +2.5 Volts monitor | 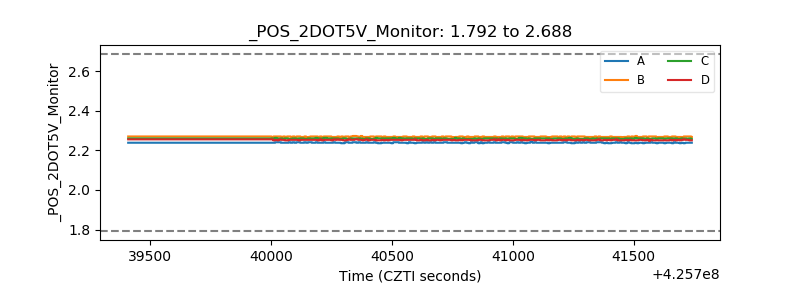 |
| +5 Volts monitor |  |
| _ROLL_ROT | 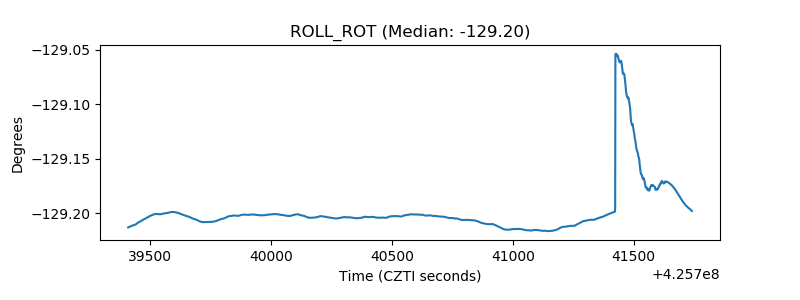 |
| _Roll_DEC | 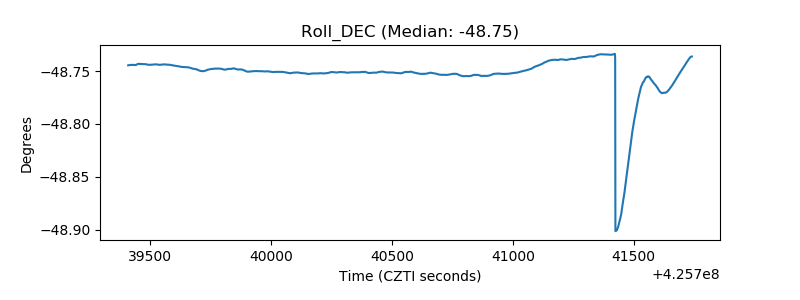 |
| _Roll_RA | 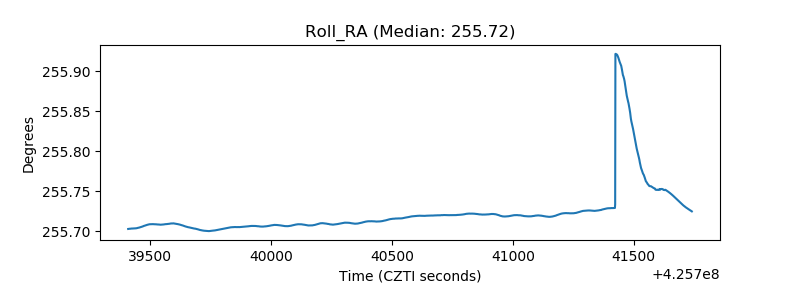 |
| Veto Counter | 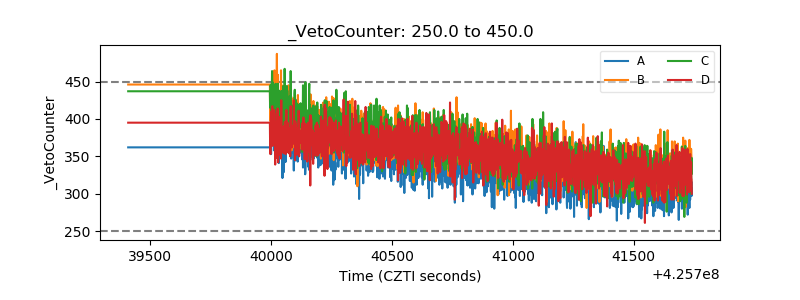 |