| Param | Original file | Final file |
|---|---|---|
| Filename | modeM0/AS1A12_099T01_9000005716_42086cztM0_level2.fits | modeM0/AS1A12_099T01_9000005716_42086cztM0_level2_quad_clean.evt |
| Size (bytes) | 42,678,720 | 12,280,320 |
| Size | 40.7 MB | 11.7 MB |
| Events in quadrant A | 490,728 | 80,832 |
| Events in quadrant B | 340,397 | 83,773 |
| Events in quadrant C | 349,629 | 78,740 |
| Events in quadrant D | 337,637 | 69,510 |
| Mode M9 | |||
|---|---|---|---|
| Quadrant | BADHDUFLAG | Total packets | Discarded packets |
| A | 0 | 16 | 0 |
| B | 0 | 14 | 0 |
| C | 0 | 15 | 0 |
| D | 0 | 13 | 0 |
| Mode M0 | |||
|---|---|---|---|
| Quadrant | BADHDUFLAG | Total packets | Discarded packets |
| A | 0 | 2584 | 644 |
| B | 0 | 2355 | 804 |
| C | 0 | 2074 | 566 |
| D | 0 | 2193 | 648 |
| Mode SS | |||
|---|---|---|---|
| Quadrant | BADHDUFLAG | Total packets | Discarded packets |
| A | 0 | 22 | 6 |
| B | 0 | 22 | 8 |
| C | 0 | 19 | 7 |
| D | 0 | 21 | 3 |
| Quadrant | Total seconds | Saturated seconds | Saturation percentage |
|---|---|---|---|
| A | 750 | 3 | 0.400000% |
| B | 749 | 2 | 0.267023% |
| C | 754 | 1 | 0.132626% |
| D | 722 | 3 | 0.415512% |
Noise dominated data is calculated using 1-second bins in cleaned event files. If a bin has >2000 counts, and if more than 50% of those come from <1% of pixels, then it is considered to be noise-dominated and hence unusable.
| Quadrant | # 1 sec bins | Bins with >0 counts | Bins with >2000 counts | High rate bins dominated by noise | Noise dominated (total time) | Noise dominated (detector-on time) | Marked lightcurve |
|---|---|---|---|---|---|---|---|
| A | 965 | 849 | 2 | 2 | 0.21% | 0.24% | 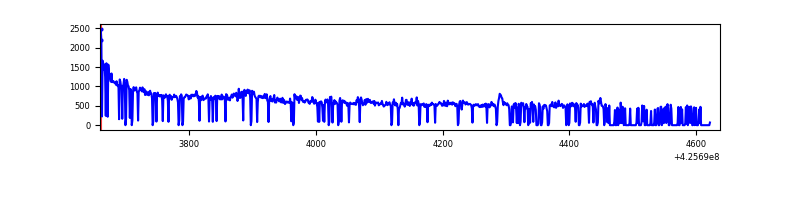 |
| B | 979 | 822 | 1 | 1 | 0.10% | 0.12% | 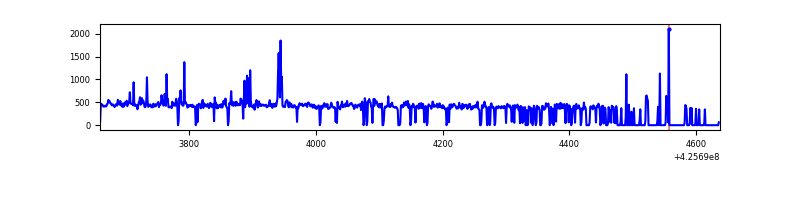 |
| C | 953 | 843 | 0 | 0 | 0.00% | 0.00% | 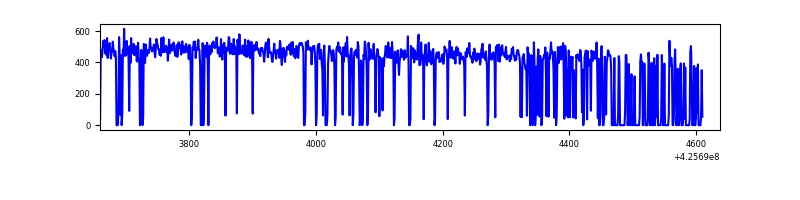 |
| D | 959 | 819 | 3 | 3 | 0.31% | 0.37% |  |
Top three noisy pixels from each quadrant. If the there are fewer than three noisy pixels in the level2.evt file, extra rows are filled as -1
| Pixel properties | Quadrant properties | ||||||
|---|---|---|---|---|---|---|---|
| Quadrant | DetID | PixID | Counts | Sigma | Mean | Median | Sigma |
| A | 10 | 83 | 135514 | 7375.86 | 79 | 78 | 18.4 |
| A | 15 | 222 | 44873 | 2439.54 | 79 | 78 | 18.4 |
| A | 13 | 6 | 2063 | 108.1 | 79 | 78 | 18.4 |
| B | 5 | 255 | 20545 | 1165.42 | 79 | 77 | 17.6 |
| B | 3 | 112 | 5759 | 323.52 | 79 | 77 | 17.6 |
| B | 12 | 111 | 1981 | 108.41 | 79 | 77 | 17.6 |
| C | 15 | 214 | 35620 | 1734.7 | 80 | 80 | 20.5 |
| C | 13 | 61 | 504 | 20.7 | 80 | 80 | 20.5 |
| C | 12 | 249 | 239 | 7.76 | 80 | 80 | 20.5 |
| D | 13 | 112 | 17043 | 835.11 | 75 | 73 | 20.3 |
| D | 5 | 223 | 12716 | 622.18 | 75 | 73 | 20.3 |
| D | 1 | 52 | 8965 | 437.58 | 75 | 73 | 20.3 |
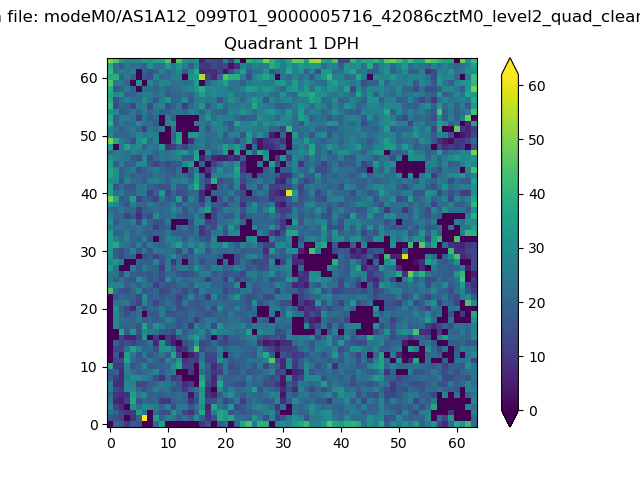
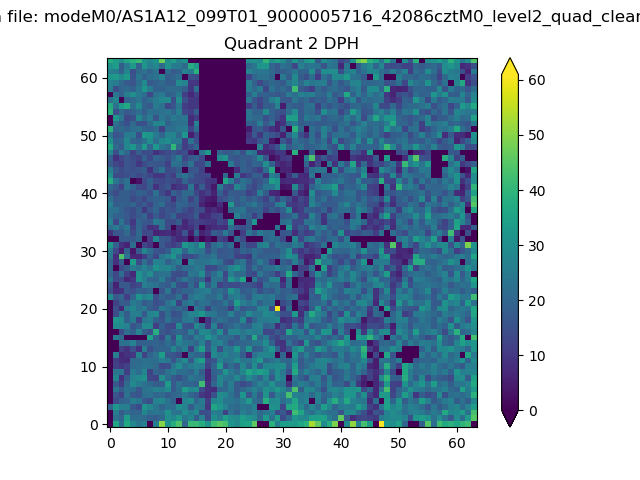
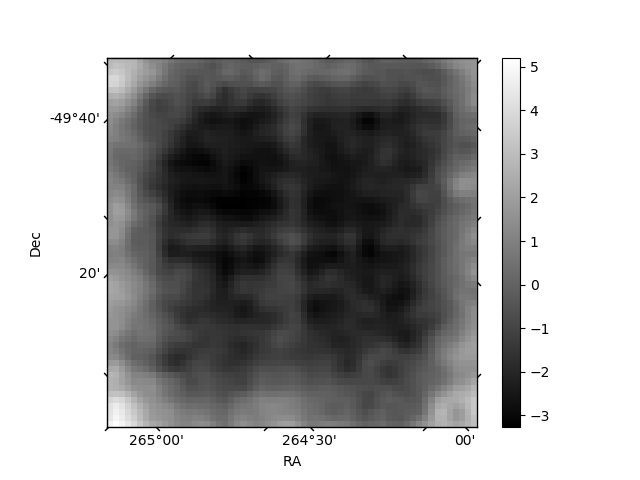
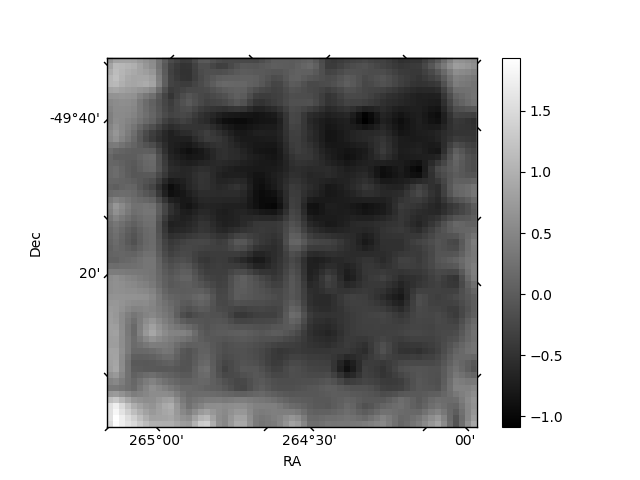
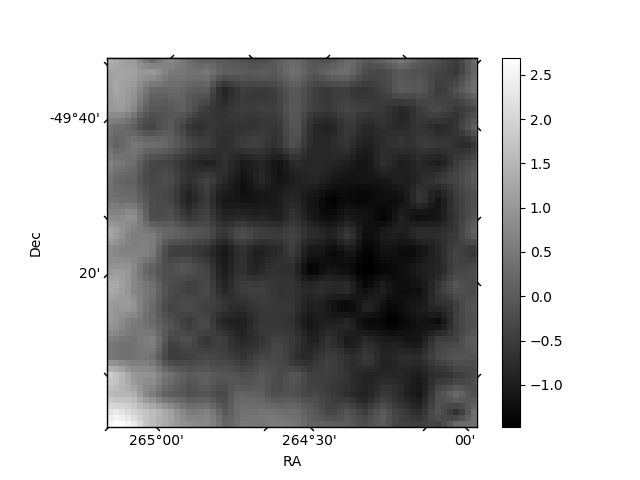
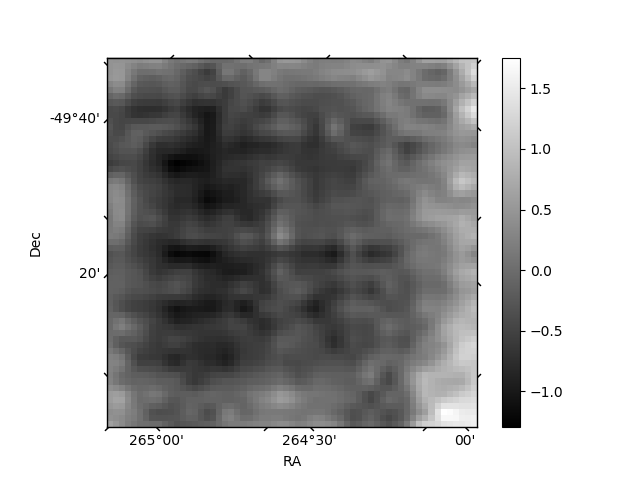
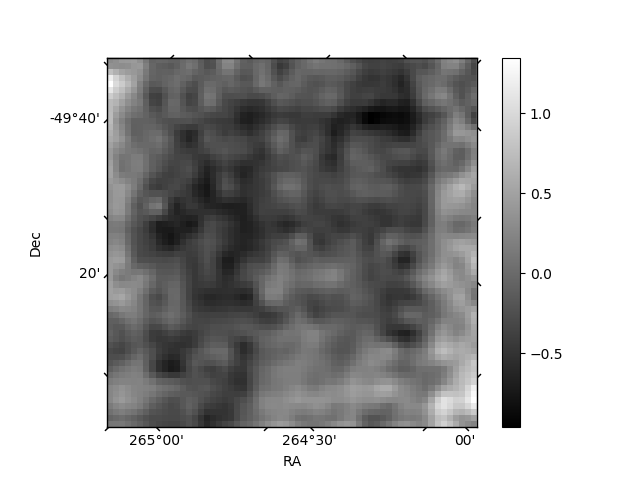
Histogram calculated using DETX and DETY for each event in the final _common_clean file
| Quadrant A | 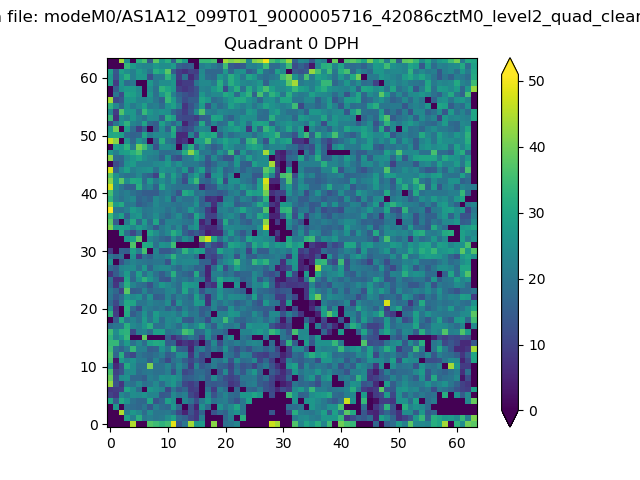 |
 |
Quadrant B |
|---|---|---|---|
| Quadrant D | 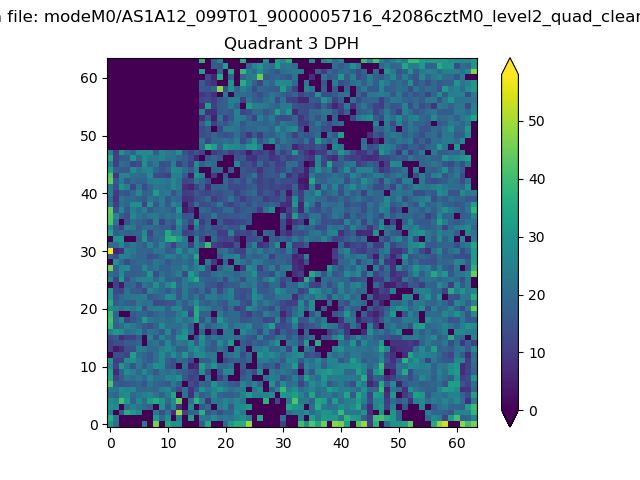 |
 |
Quadrant C |
| Plot type | Count rate plots | Images |
|---|---|---|
| Comparison with Poisson distribution Blue bars denote a histogram of data divided into 1 sec bins. Red curve is a Poisson curve with rate = median count rate of data. |
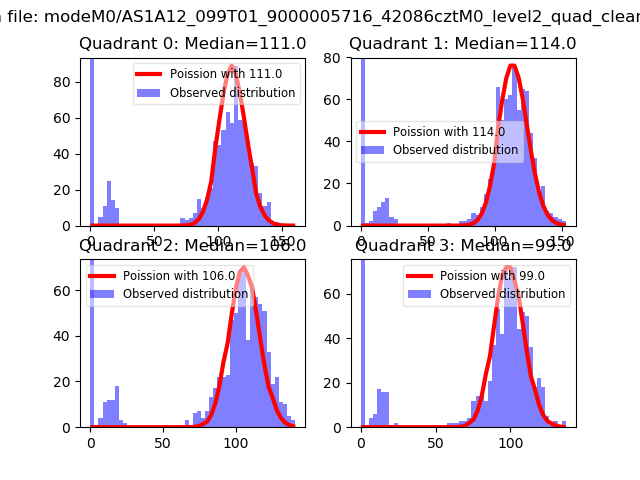 |
 |
| Quadrant-wise count rates Data is divided into 100 sec bins |
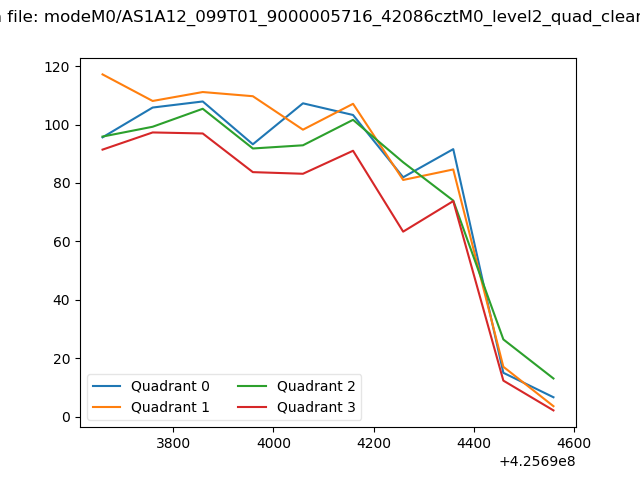 |
|
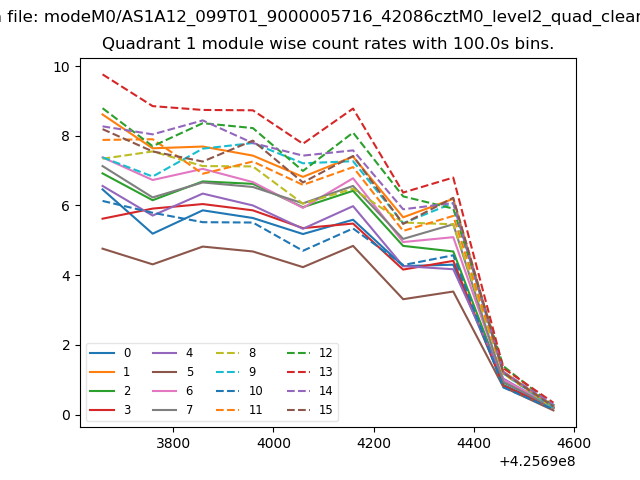
| Module-wise count rates for Quadrant A Data is divided into 100 sec bins |
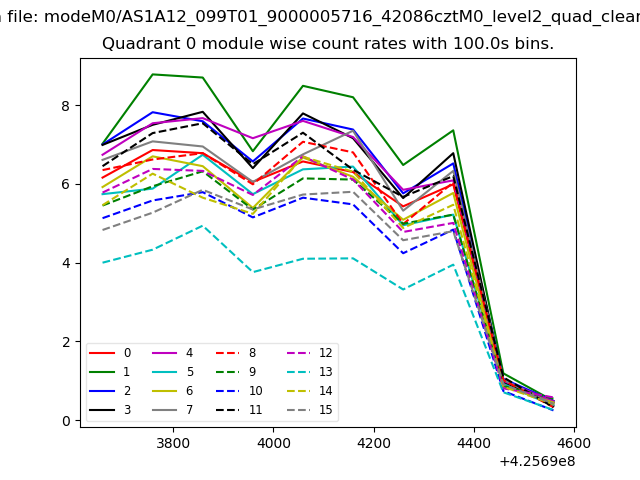 |
 |
| Module-wise count rates for Quadrant B Data is divided into 100 sec bins |
 |
 |
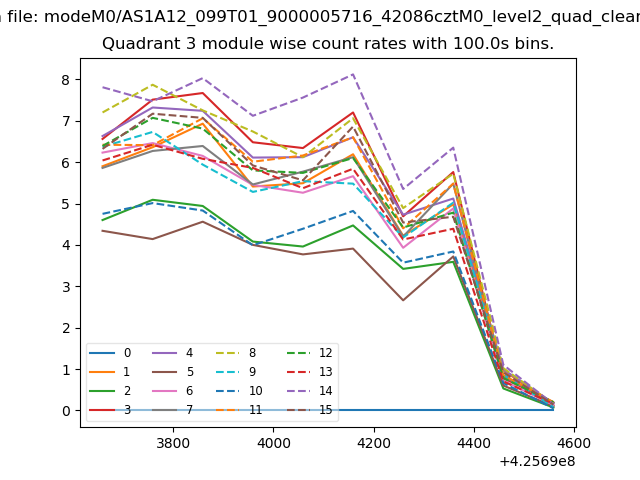
| Module-wise count rates for Quadrant C Data is divided into 100 sec bins |
 |
 |
| Module-wise count rates for Quadrant D Data is divided into 100 sec bins |
 |
 |
| Parameter | Plot |
|---|---|
| CZT HV Monitor | 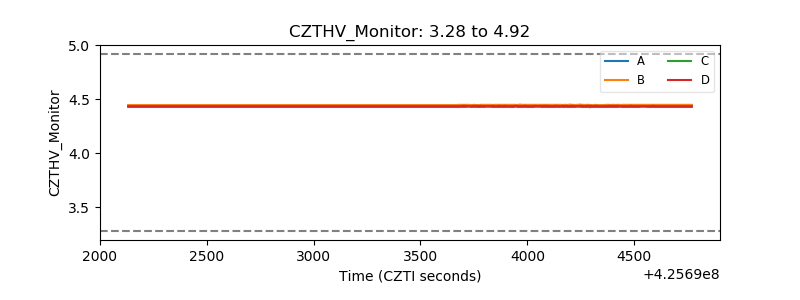 |
| D_VDD | 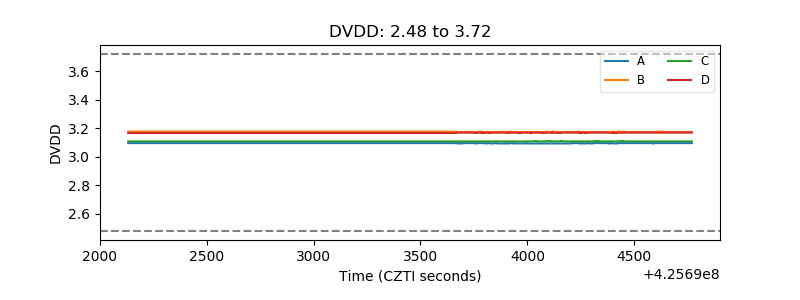 |
| Temperature 1 | 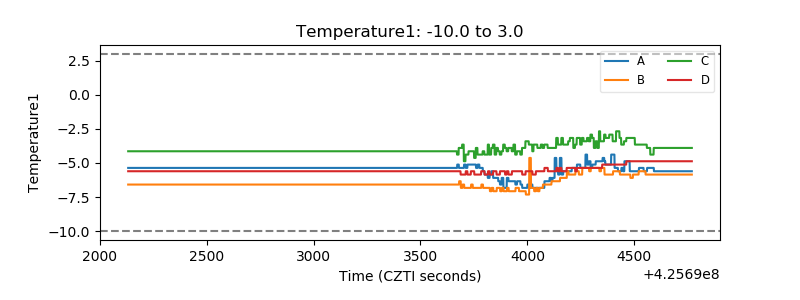 |
| Veto HV Monitor |  |
| Veto LLD | 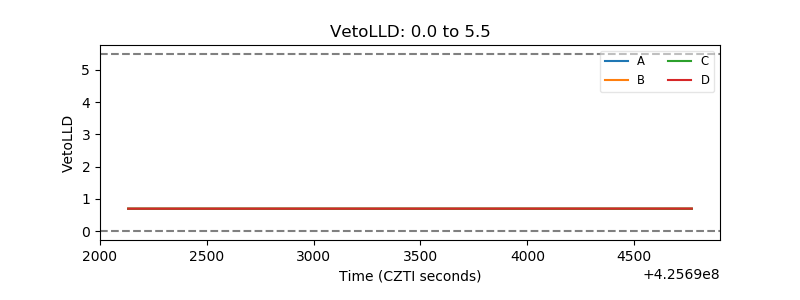 |
| Alpha Counter | 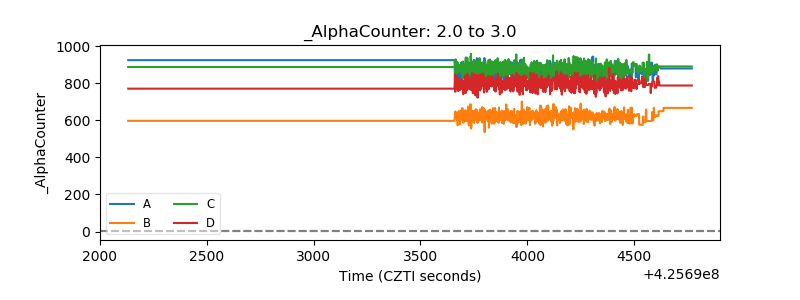 |
| _CPM_Rate |  |
| CZT Counter | 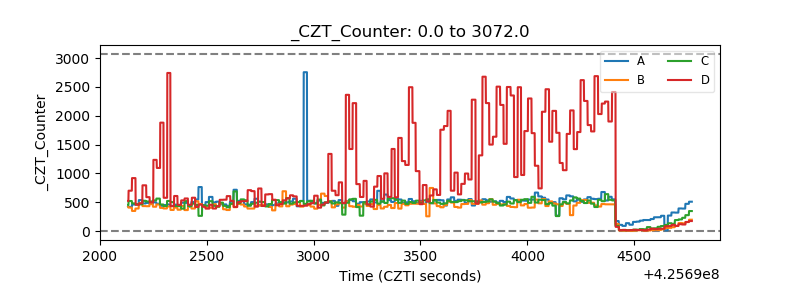 |
| +2.5 Volts monitor | 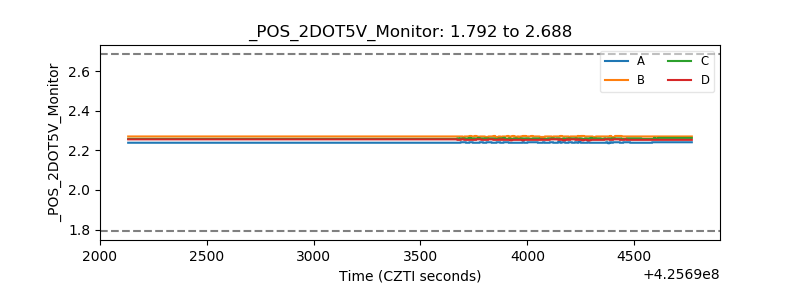 |
| +5 Volts monitor | 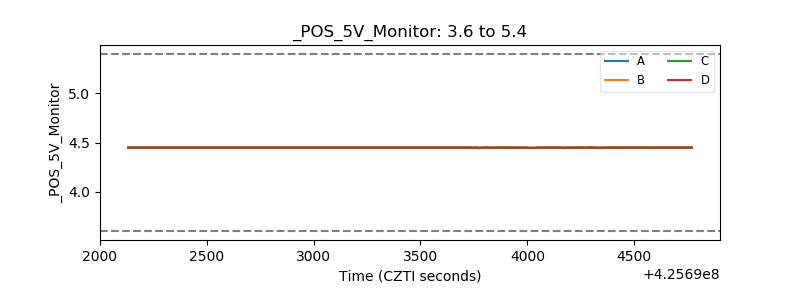 |
| _ROLL_ROT | 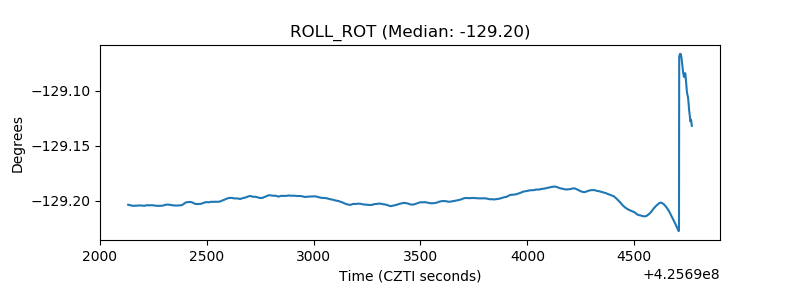 |
| _Roll_DEC | 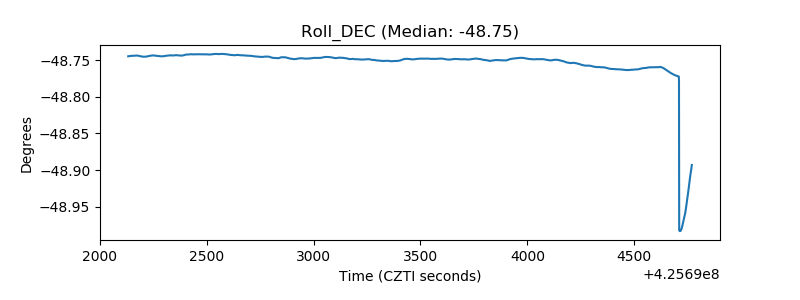 |
| _Roll_RA | 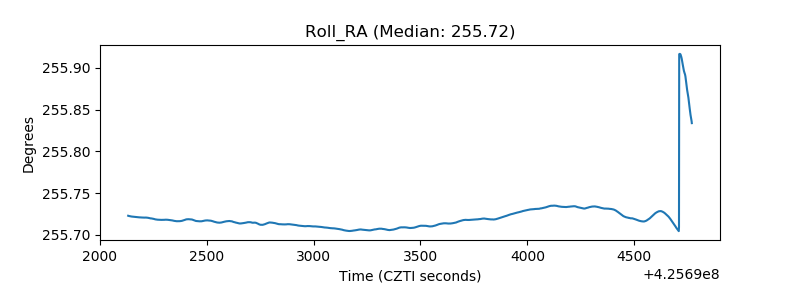 |
| Veto Counter | 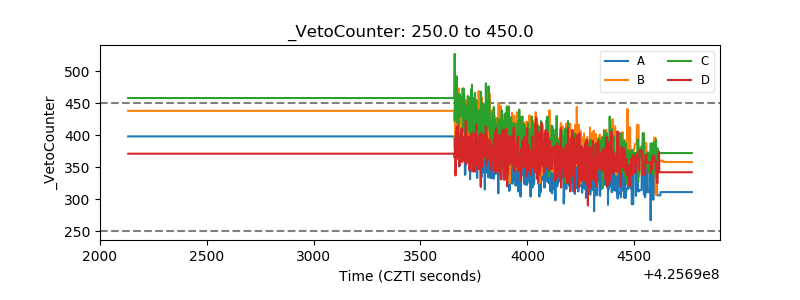 |