| Param | Original file | Final file |
|---|---|---|
| Filename | modeM0/AS1A12_101T04_9000005714_41884cztM0_level2.fits | modeM0/AS1A12_101T04_9000005714_41884cztM0_level2_quad_clean.evt |
| Size (bytes) | 157,029,120 | 28,848,960 |
| Size | 149.8 MB | 27.5 MB |
| Events in quadrant A | 1,573,334 | 188,245 |
| Events in quadrant B | 862,677 | 208,141 |
| Events in quadrant C | 1,229,269 | 178,421 |
| Events in quadrant D | 2,005,185 | 167,903 |
| Mode M9 | |||
|---|---|---|---|
| Quadrant | BADHDUFLAG | Total packets | Discarded packets |
| A | 0 | 16 | 0 |
| B | 0 | 16 | 0 |
| C | 0 | 16 | 0 |
| D | 0 | 16 | 0 |
| Mode M0 | |||
|---|---|---|---|
| Quadrant | BADHDUFLAG | Total packets | Discarded packets |
| A | 0 | 5869 | 2 |
| B | 0 | 3678 | 1 |
| C | 0 | 4700 | 1 |
| D | 0 | 7204 | 1 |
| Mode SS | |||
|---|---|---|---|
| Quadrant | BADHDUFLAG | Total packets | Discarded packets |
| A | 0 | 36 | 0 |
| B | 0 | 36 | 0 |
| C | 0 | 36 | 0 |
| D | 0 | 36 | 0 |
| Quadrant | Total seconds | Saturated seconds | Saturation percentage |
|---|---|---|---|
| A | 1799 | 183 | 10.172318% |
| B | 1799 | 6 | 0.333519% |
| C | 1799 | 137 | 7.615342% |
| D | 1799 | 180 | 10.005559% |
Noise dominated data is calculated using 1-second bins in cleaned event files. If a bin has >2000 counts, and if more than 50% of those come from <1% of pixels, then it is considered to be noise-dominated and hence unusable.
| Quadrant | # 1 sec bins | Bins with >0 counts | Bins with >2000 counts | High rate bins dominated by noise | Noise dominated (total time) | Noise dominated (detector-on time) | Marked lightcurve |
|---|---|---|---|---|---|---|---|
| A | 3350 | 1800 | 102 | 102 | 3.04% | 5.67% | 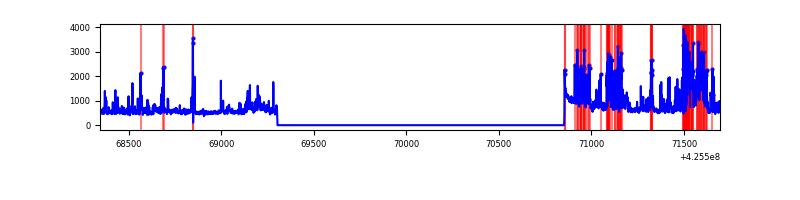 |
| B | 3350 | 1800 | 0 | 0 | 0.00% | 0.00% | 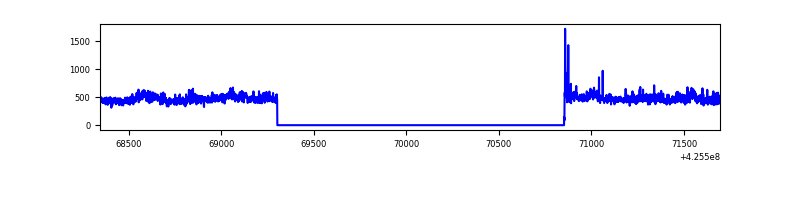 |
| C | 3350 | 1800 | 132 | 132 | 3.94% | 7.33% | 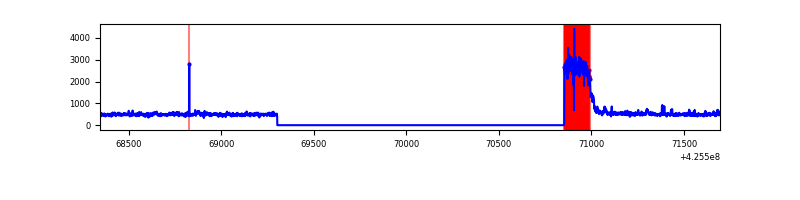 |
| D | 3350 | 1800 | 200 | 200 | 5.97% | 11.11% | 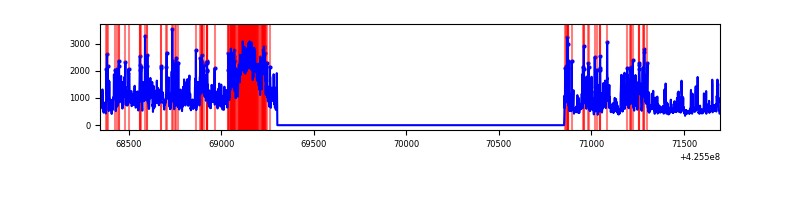 |
Top three noisy pixels from each quadrant. If the there are fewer than three noisy pixels in the level2.evt file, extra rows are filled as -1
| Pixel properties | Quadrant properties | ||||||
|---|---|---|---|---|---|---|---|
| Quadrant | DetID | PixID | Counts | Sigma | Mean | Median | Sigma |
| A | 14 | 24 | 586774 | 13660.49 | 198 | 193 | 42.9 |
| A | 10 | 83 | 203017 | 4723.43 | 198 | 193 | 42.9 |
| A | 14 | 250 | 15303 | 351.89 | 198 | 193 | 42.9 |
| B | 0 | 156 | 49152 | 1185.82 | 203 | 198 | 41.3 |
| B | 4 | 141 | 5332 | 124.36 | 203 | 198 | 41.3 |
| B | 12 | 111 | 5154 | 120.05 | 203 | 198 | 41.3 |
| C | 0 | 10 | 408985 | 8955.3 | 186 | 186 | 45.6 |
| C | 15 | 214 | 71089 | 1553.23 | 186 | 186 | 45.6 |
| C | 0 | 15 | 20752 | 450.53 | 186 | 186 | 45.6 |
| D | 12 | 79 | 793682 | 16103.78 | 192 | 187 | 49.3 |
| D | 5 | 222 | 244808 | 4964.52 | 192 | 187 | 49.3 |
| D | 12 | 6 | 116336 | 2357.21 | 192 | 187 | 49.3 |
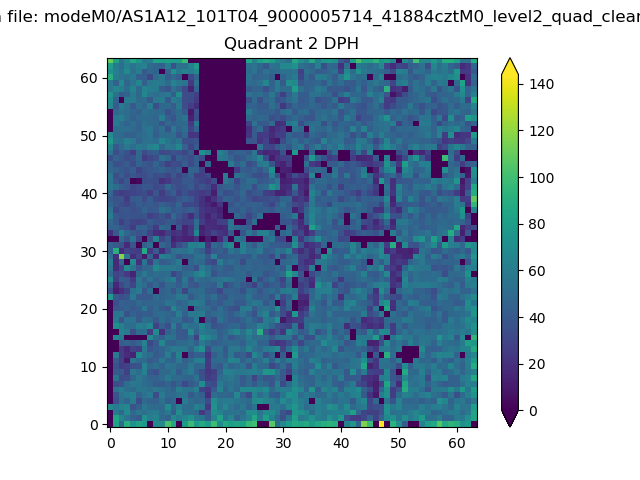
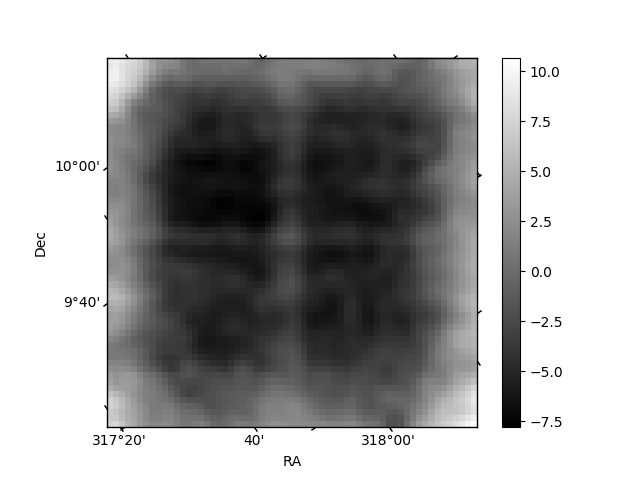
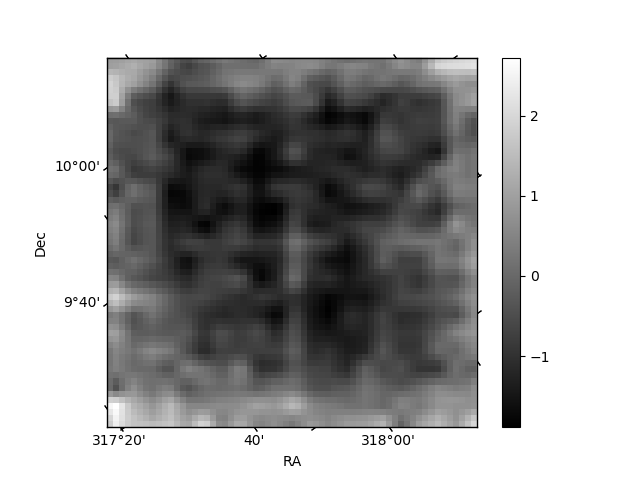
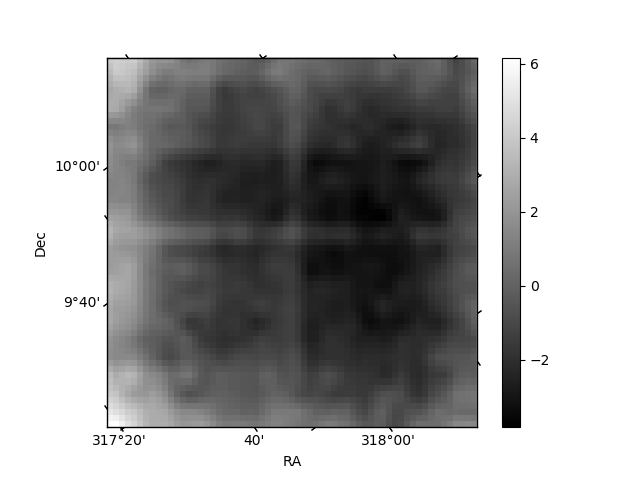
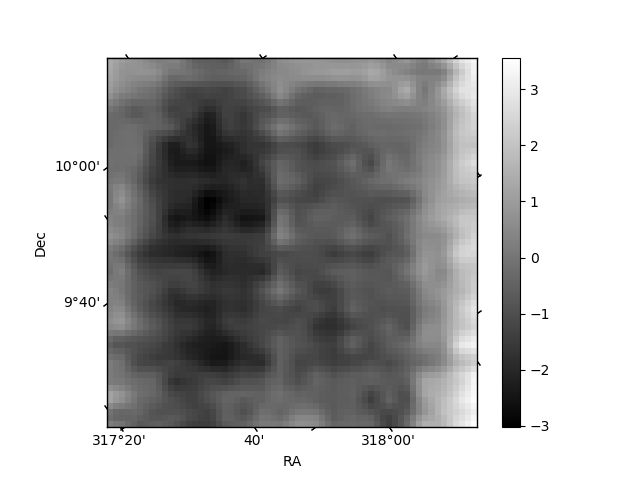
Histogram calculated using DETX and DETY for each event in the final _common_clean file
| Quadrant A | 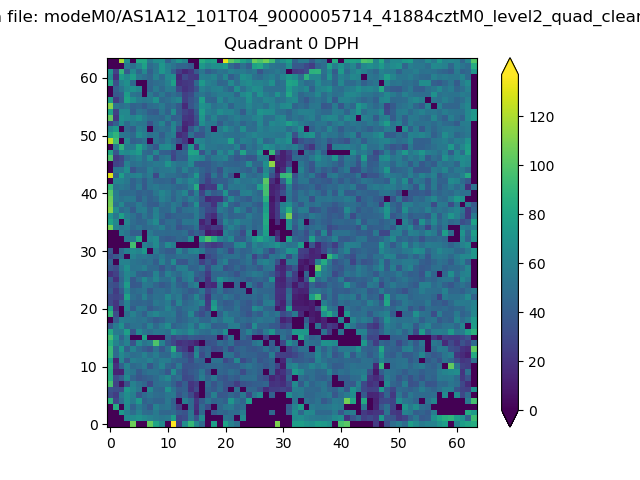 |
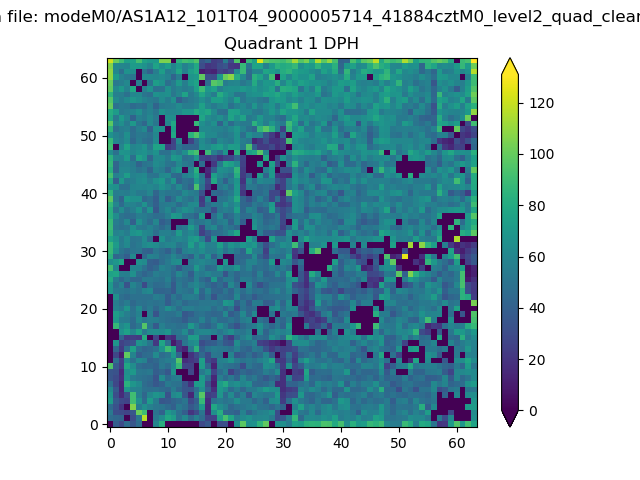 |
Quadrant B |
|---|---|---|---|
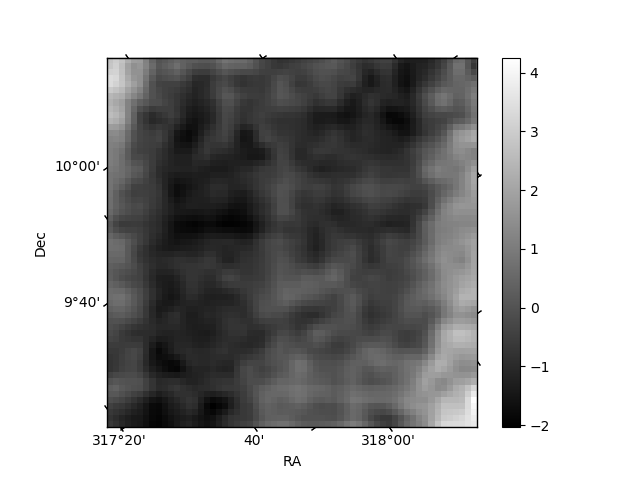
| Quadrant D | 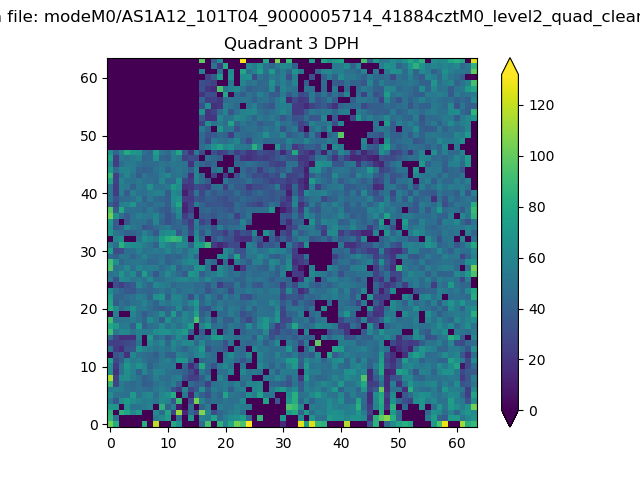 |
 |
Quadrant C |
| Plot type | Count rate plots | Images |
|---|---|---|
| Comparison with Poisson distribution Blue bars denote a histogram of data divided into 1 sec bins. Red curve is a Poisson curve with rate = median count rate of data. |
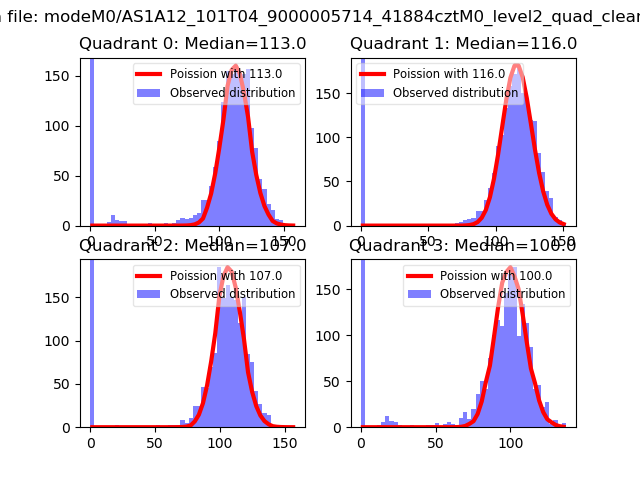 |
 |
| Quadrant-wise count rates Data is divided into 100 sec bins |
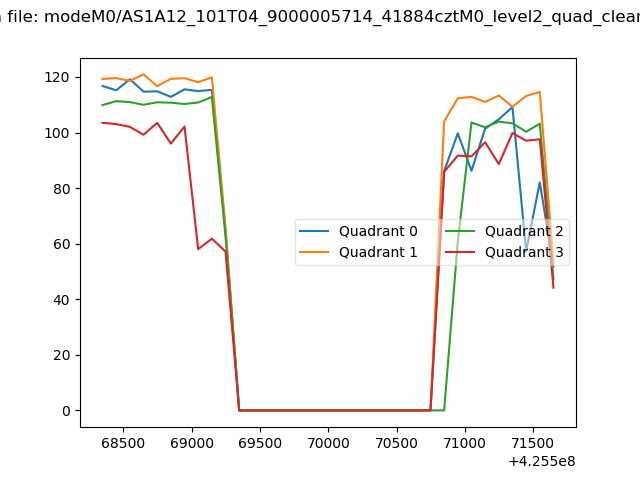 |
|
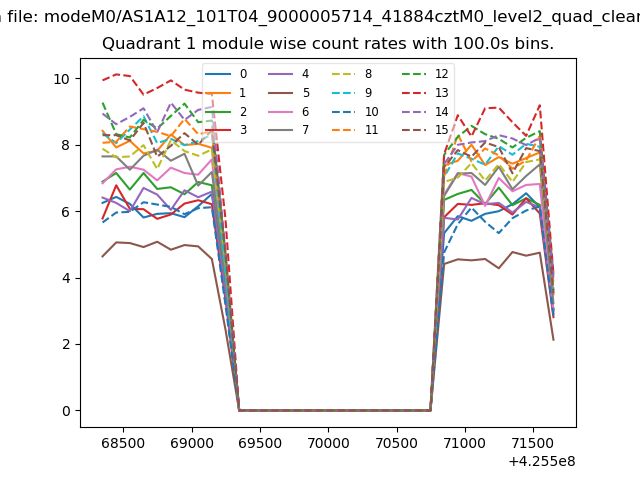
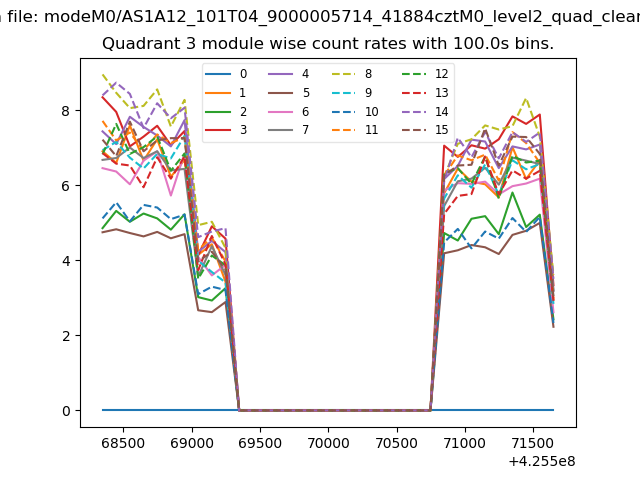
| Module-wise count rates for Quadrant A Data is divided into 100 sec bins |
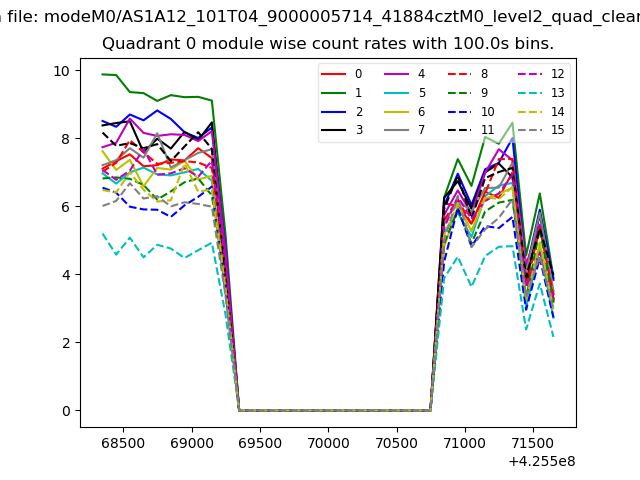 |
 |
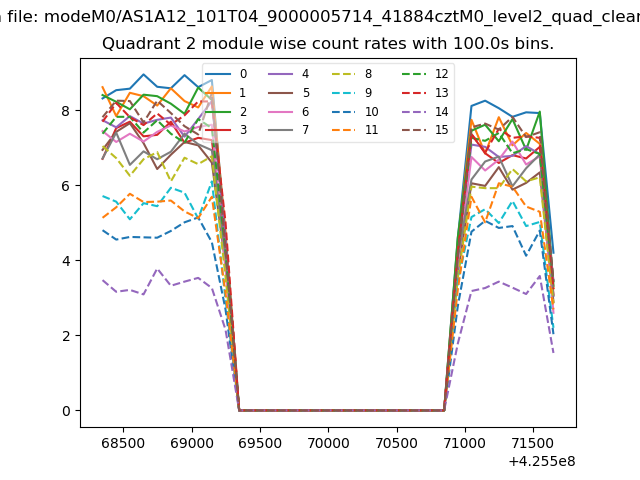
| Module-wise count rates for Quadrant B Data is divided into 100 sec bins |
 |
 |
| Module-wise count rates for Quadrant C Data is divided into 100 sec bins |
 |
 |
| Module-wise count rates for Quadrant D Data is divided into 100 sec bins |
 |
 |
| Parameter | Plot |
|---|---|
| CZT HV Monitor | 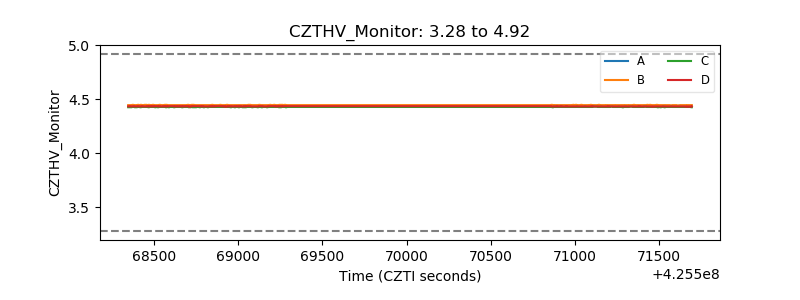 |
| D_VDD | 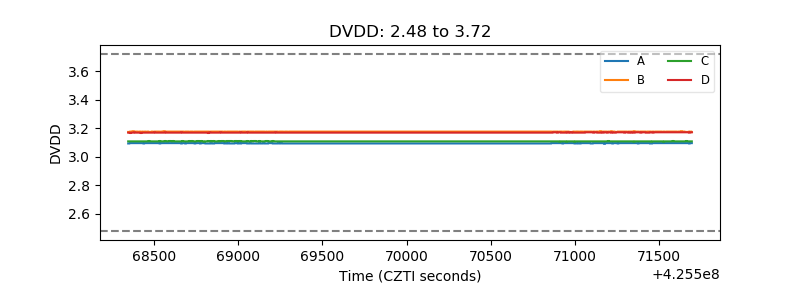 |
| Temperature 1 | 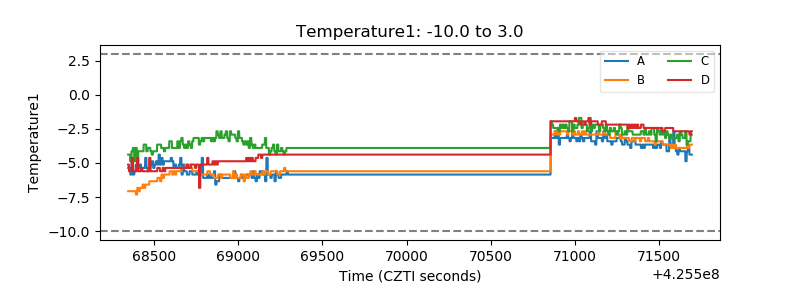 |
| Veto HV Monitor | 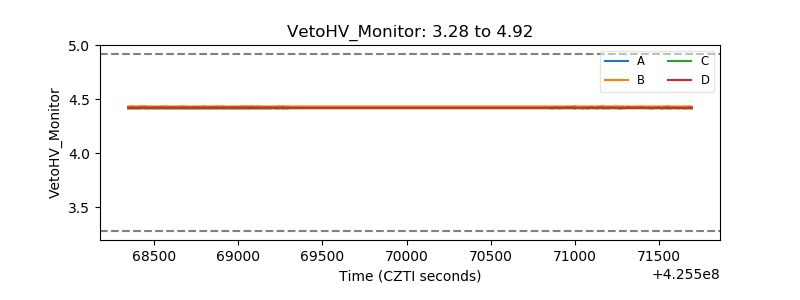 |
| Veto LLD | 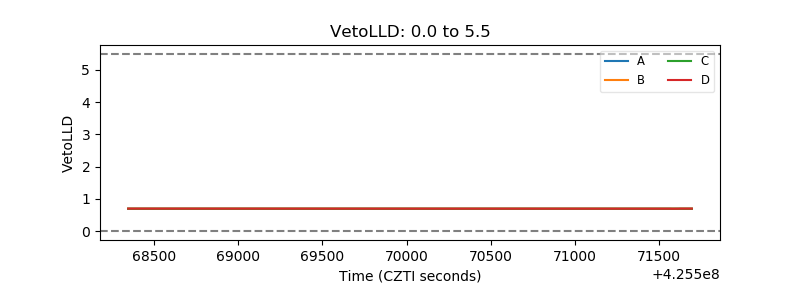 |
| Alpha Counter | 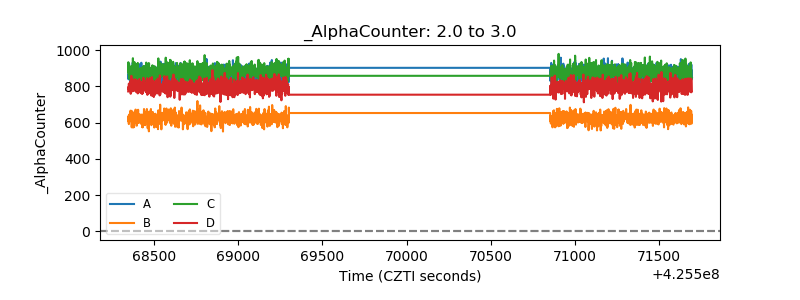 |
| _CPM_Rate | 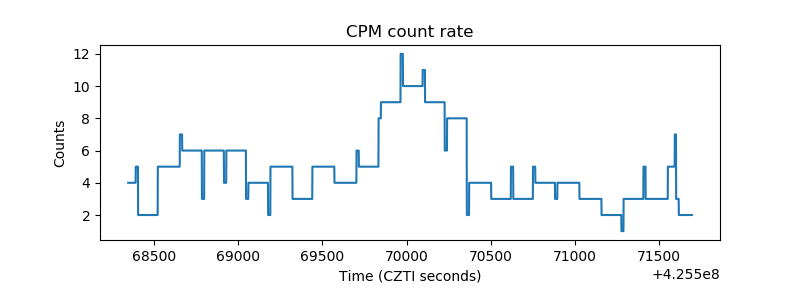 |
| CZT Counter | 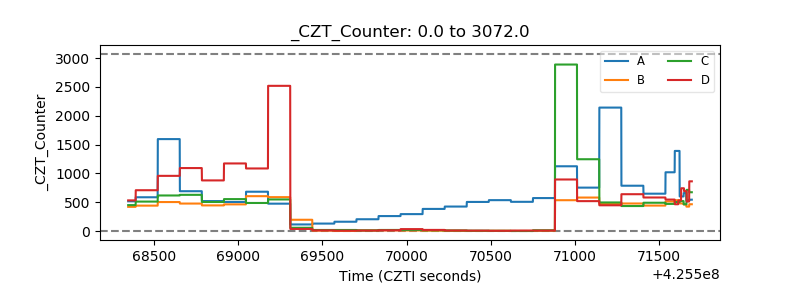 |
| +2.5 Volts monitor | 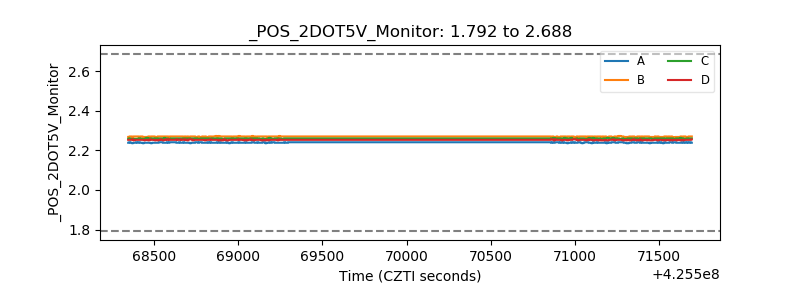 |
| +5 Volts monitor | 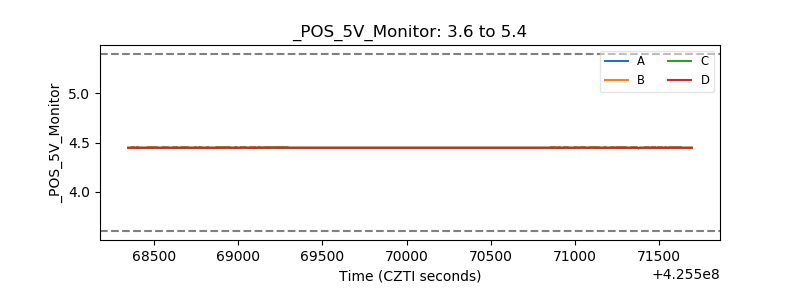 |
| _ROLL_ROT | 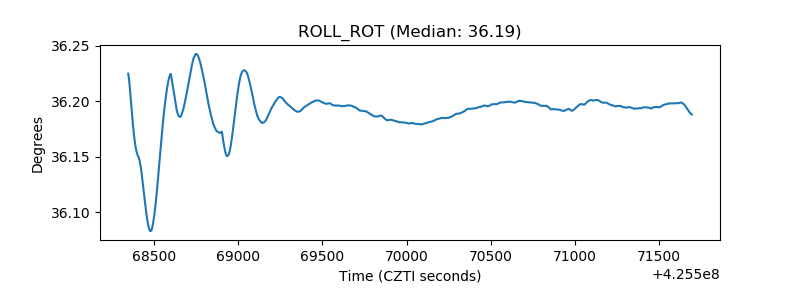 |
| _Roll_DEC | 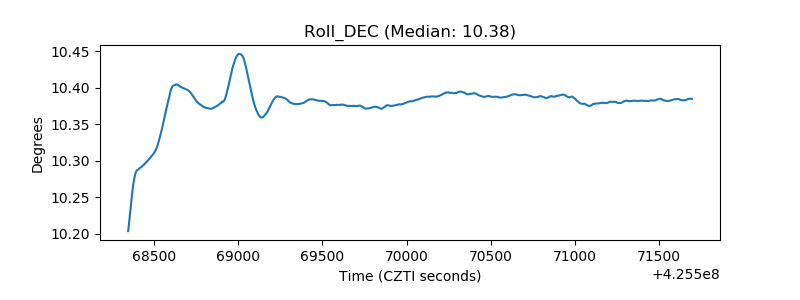 |
| _Roll_RA | 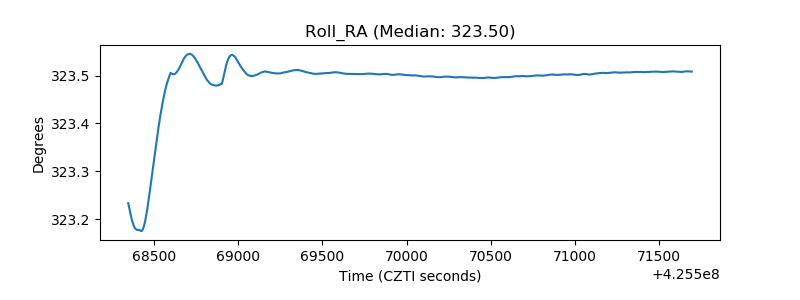 |
| Veto Counter | 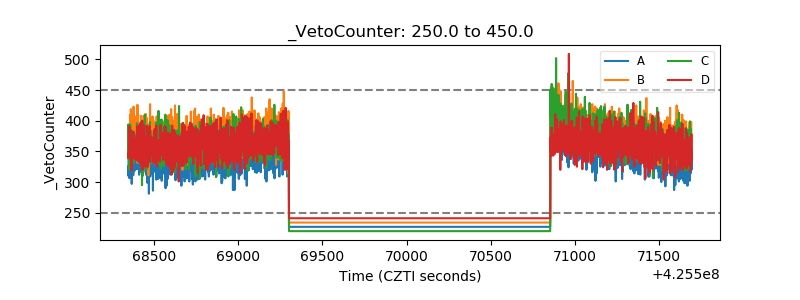 |