| Param | Original file | Final file |
|---|---|---|
| Filename | modeM0/AS1A12_101T04_9000005714_41885cztM0_level2.fits | modeM0/AS1A12_101T04_9000005714_41885cztM0_level2_quad_clean.evt |
| Size (bytes) | 420,848,640 | 93,124,800 |
| Size | 401.4 MB | 88.8 MB |
| Events in quadrant A | 3,807,710 | 632,107 |
| Events in quadrant B | 2,922,056 | 651,216 |
| Events in quadrant C | 3,571,116 | 580,952 |
| Events in quadrant D | 4,824,061 | 548,473 |
| Mode M9 | |||
|---|---|---|---|
| Quadrant | BADHDUFLAG | Total packets | Discarded packets |
| A | 0 | 30 | 0 |
| B | 0 | 30 | 0 |
| C | 0 | 30 | 0 |
| D | 0 | 30 | 0 |
| Mode M0 | |||
|---|---|---|---|
| Quadrant | BADHDUFLAG | Total packets | Discarded packets |
| A | 0 | 14979 | 2 |
| B | 0 | 12740 | 2 |
| C | 0 | 14214 | 2 |
| D | 0 | 18340 | 8 |
| Mode SS | |||
|---|---|---|---|
| Quadrant | BADHDUFLAG | Total packets | Discarded packets |
| A | 0 | 118 | 0 |
| B | 0 | 118 | 0 |
| C | 0 | 118 | 0 |
| D | 0 | 118 | 0 |
| Quadrant | Total seconds | Saturated seconds | Saturation percentage |
|---|---|---|---|
| A | 5832 | 198 | 3.395062% |
| B | 5832 | 98 | 1.680384% |
| C | 5833 | 294 | 5.040288% |
| D | 5832 | 376 | 6.447188% |
Noise dominated data is calculated using 1-second bins in cleaned event files. If a bin has >2000 counts, and if more than 50% of those come from <1% of pixels, then it is considered to be noise-dominated and hence unusable.
| Quadrant | # 1 sec bins | Bins with >0 counts | Bins with >2000 counts | High rate bins dominated by noise | Noise dominated (total time) | Noise dominated (detector-on time) | Marked lightcurve |
|---|---|---|---|---|---|---|---|
| A | 8725 | 5834 | 118 | 118 | 1.35% | 2.02% | 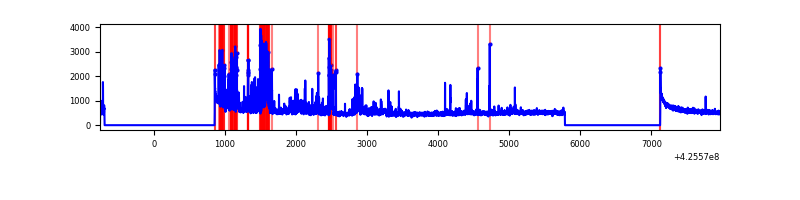 |
| B | 8725 | 5834 | 19 | 19 | 0.22% | 0.33% | 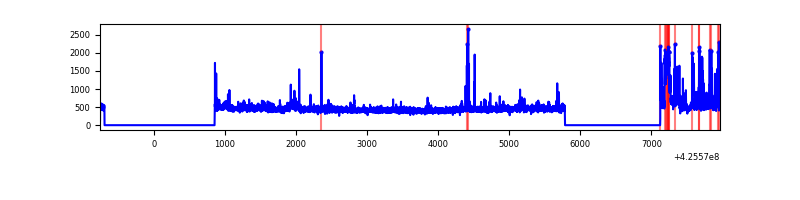 |
| C | 8726 | 5835 | 280 | 280 | 3.21% | 4.80% | 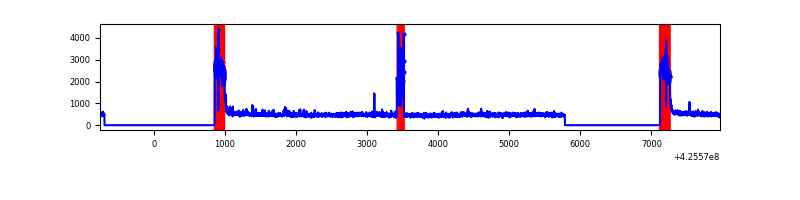 |
| D | 8725 | 5834 | 345 | 345 | 3.95% | 5.91% | 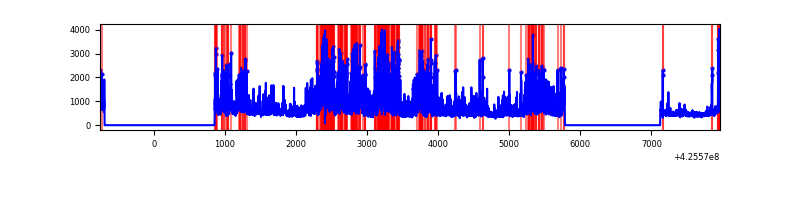 |
Top three noisy pixels from each quadrant. If the there are fewer than three noisy pixels in the level2.evt file, extra rows are filled as -1
| Pixel properties | Quadrant properties | ||||||
|---|---|---|---|---|---|---|---|
| Quadrant | DetID | PixID | Counts | Sigma | Mean | Median | Sigma |
| A | 14 | 24 | 786977 | 5983.92 | 634 | 621 | 131.4 |
| A | 10 | 83 | 550709 | 4185.99 | 634 | 621 | 131.4 |
| A | 14 | 250 | 15786 | 115.4 | 634 | 621 | 131.4 |
| B | 4 | 141 | 203961 | 1648.37 | 634 | 616 | 123.4 |
| B | 0 | 190 | 89986 | 724.46 | 634 | 616 | 123.4 |
| B | 0 | 245 | 50104 | 401.16 | 634 | 616 | 123.4 |
| C | 0 | 10 | 813920 | 5688.56 | 601 | 605 | 143.0 |
| C | 15 | 214 | 228358 | 1592.97 | 601 | 605 | 143.0 |
| C | 0 | 15 | 179664 | 1252.39 | 601 | 605 | 143.0 |
| D | 12 | 79 | 1465145 | 9741.19 | 611 | 594 | 150.3 |
| D | 5 | 222 | 361574 | 2400.99 | 611 | 594 | 150.3 |
| D | 12 | 6 | 317465 | 2107.61 | 611 | 594 | 150.3 |
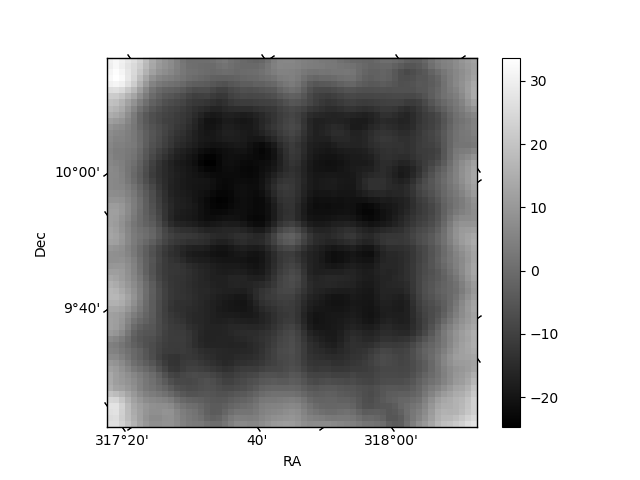
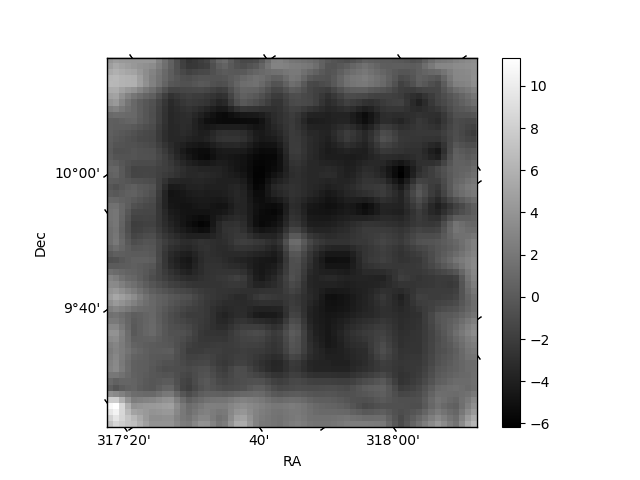
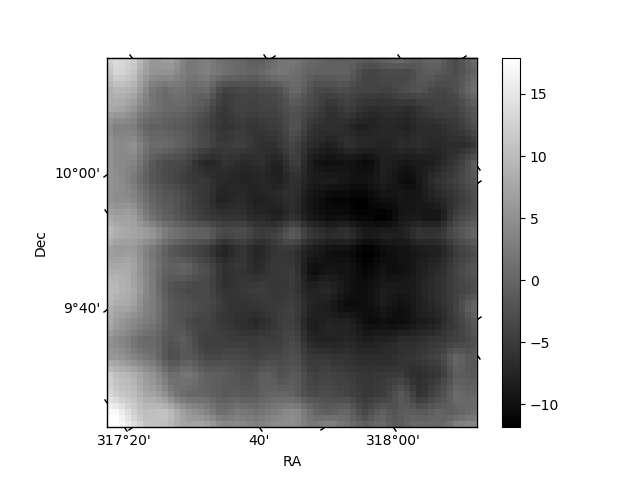
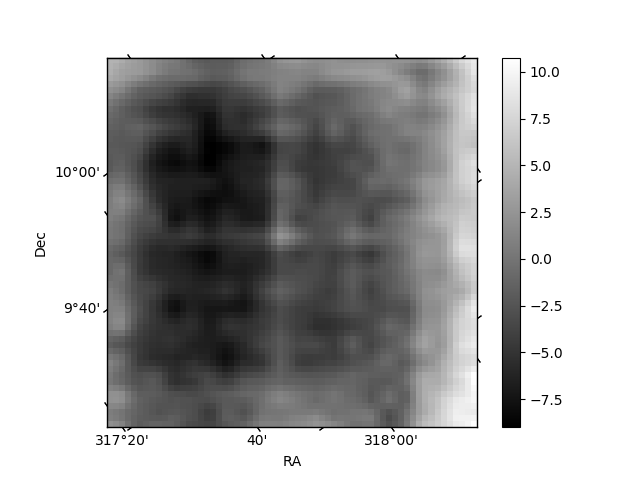
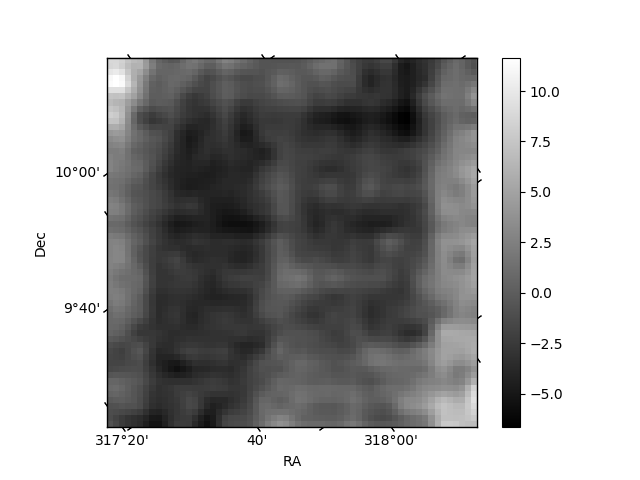
Histogram calculated using DETX and DETY for each event in the final _common_clean file
| Quadrant A | 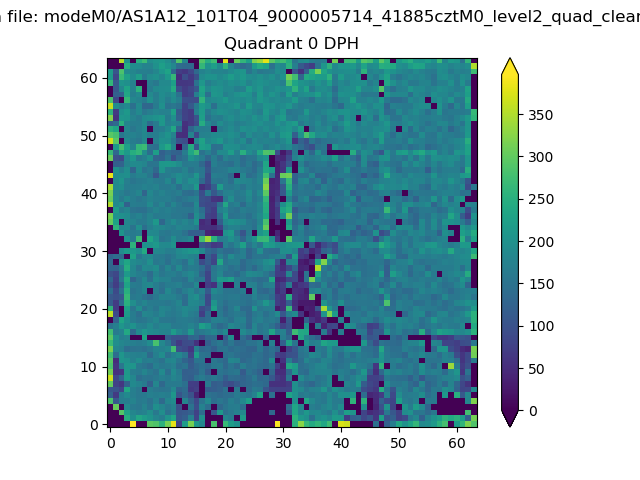 |
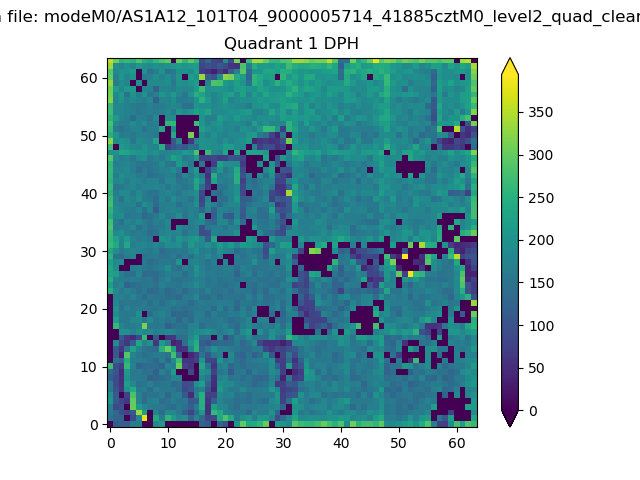 |
Quadrant B |
|---|---|---|---|
| Quadrant D | 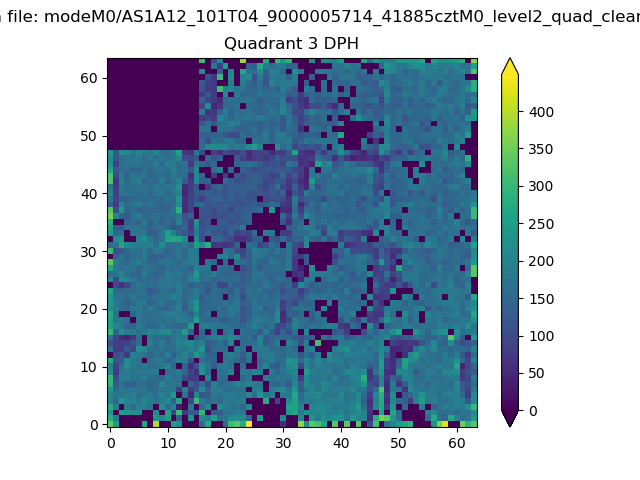 |
 |
Quadrant C |
| Plot type | Count rate plots | Images |
|---|---|---|
| Comparison with Poisson distribution Blue bars denote a histogram of data divided into 1 sec bins. Red curve is a Poisson curve with rate = median count rate of data. |
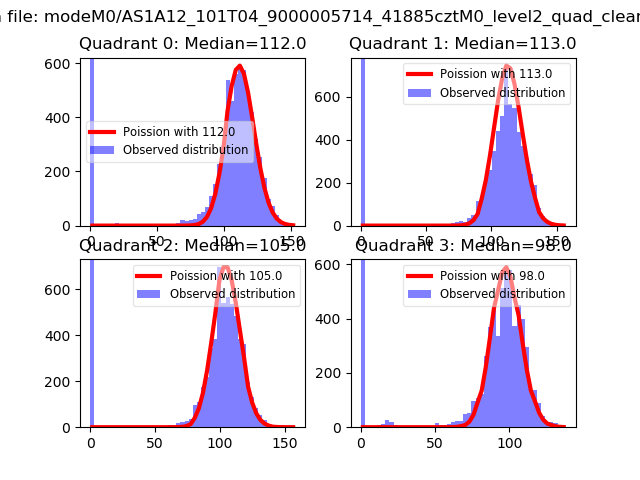 |
 |
| Quadrant-wise count rates Data is divided into 100 sec bins |
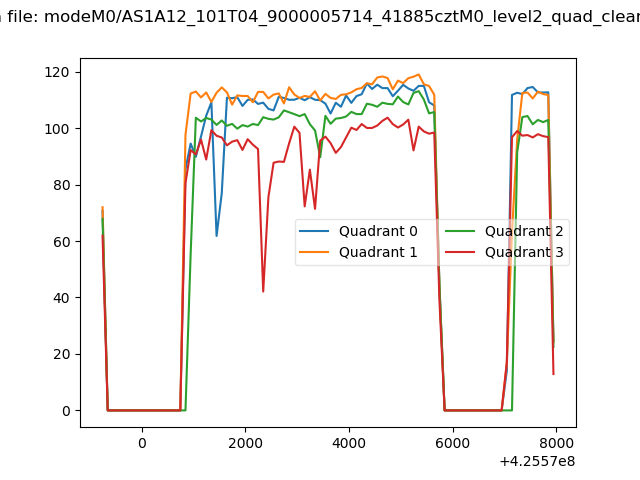 |
|
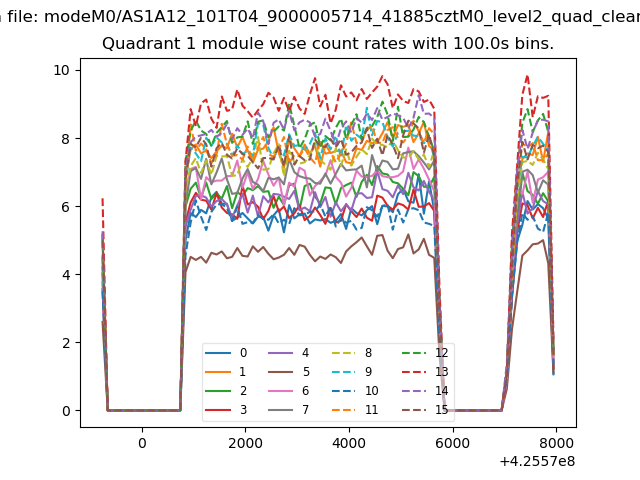
| Module-wise count rates for Quadrant A Data is divided into 100 sec bins |
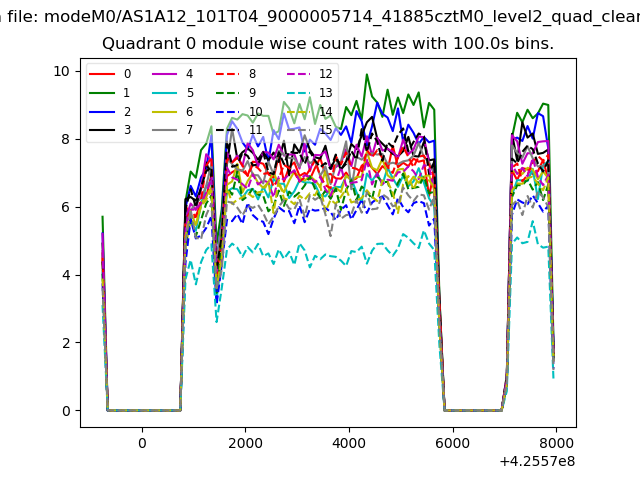 |
 |
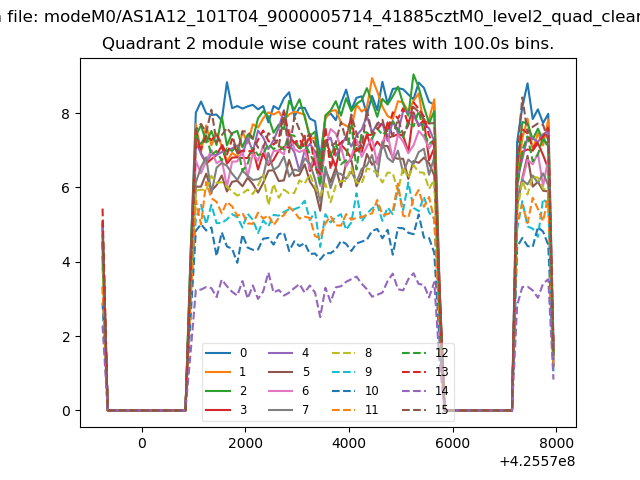
| Module-wise count rates for Quadrant B Data is divided into 100 sec bins |
 |
 |
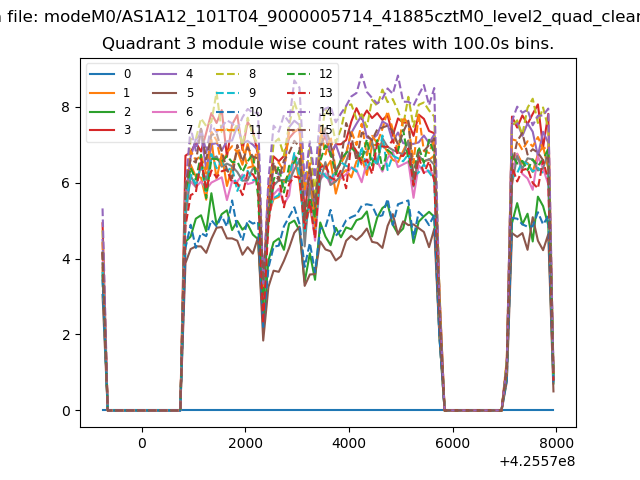
| Module-wise count rates for Quadrant C Data is divided into 100 sec bins |
 |
 |
| Module-wise count rates for Quadrant D Data is divided into 100 sec bins |
 |
 |
| Parameter | Plot |
|---|---|
| CZT HV Monitor | 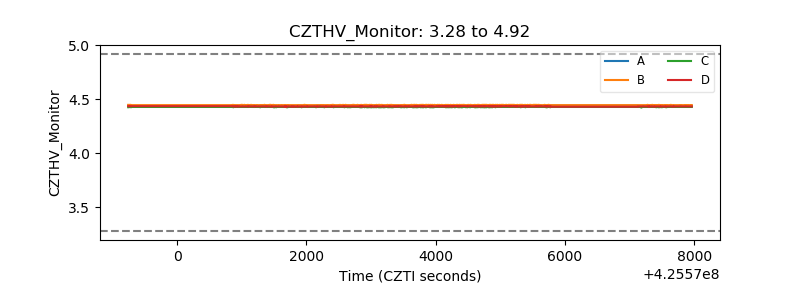 |
| D_VDD | 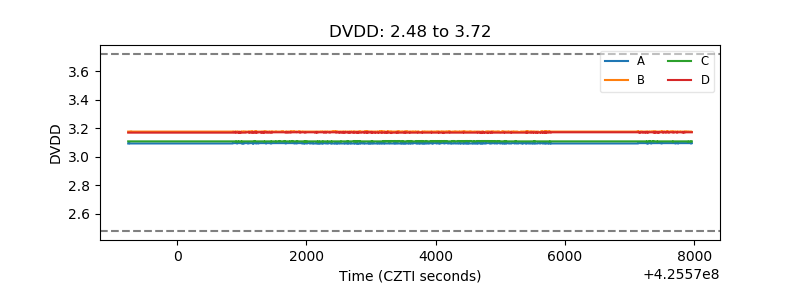 |
| Temperature 1 | 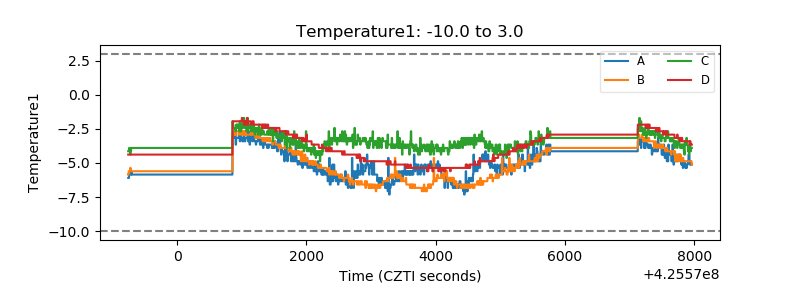 |
| Veto HV Monitor | 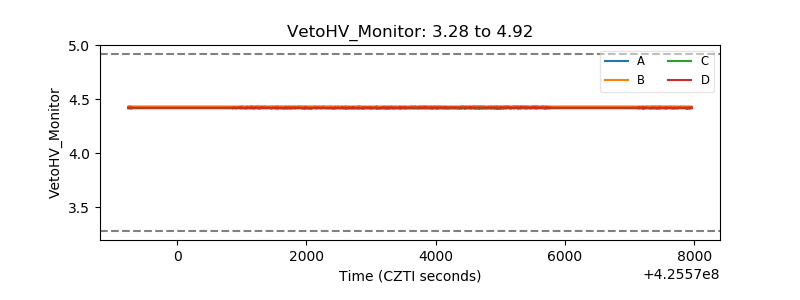 |
| Veto LLD | 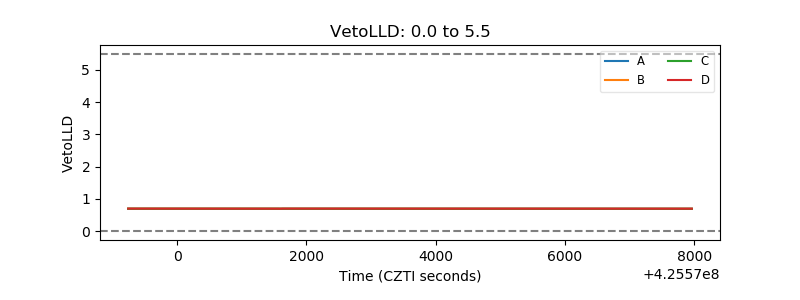 |
| Alpha Counter | 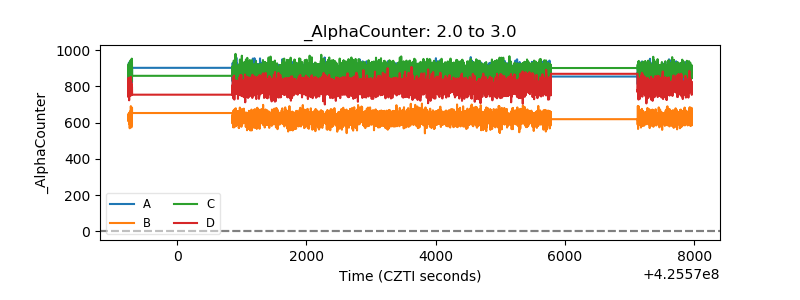 |
| _CPM_Rate | 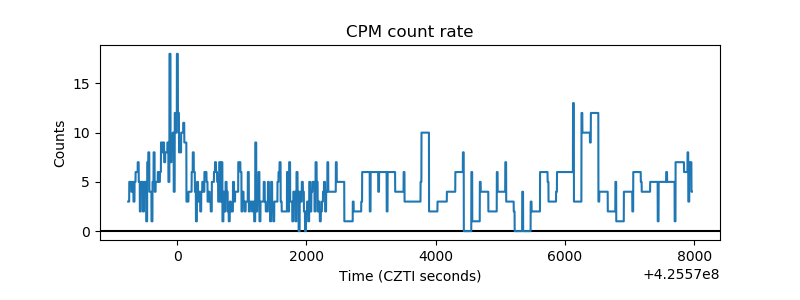 |
| CZT Counter | 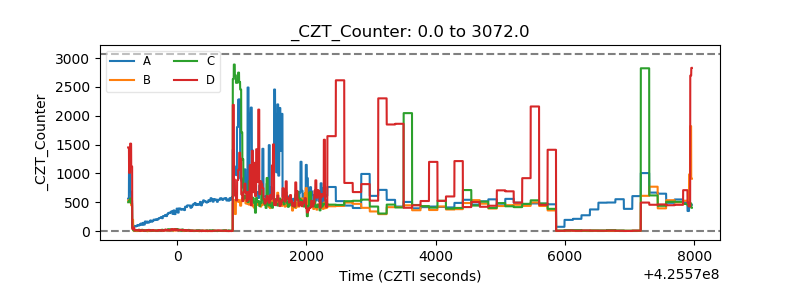 |
| +2.5 Volts monitor | 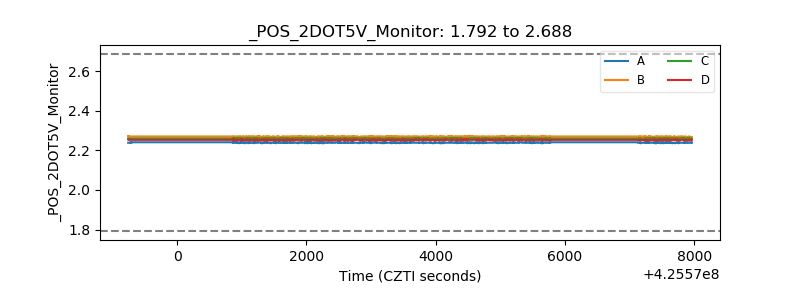 |
| +5 Volts monitor |  |
| _ROLL_ROT | 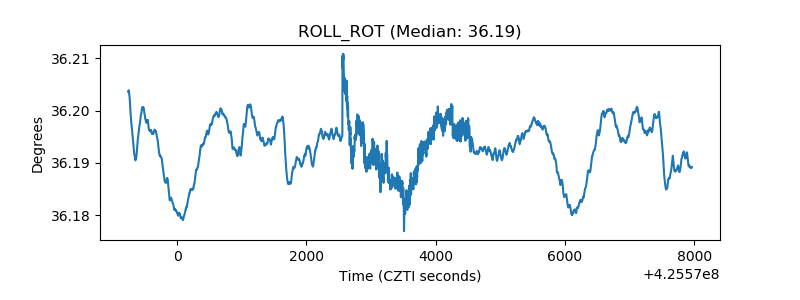 |
| _Roll_DEC | 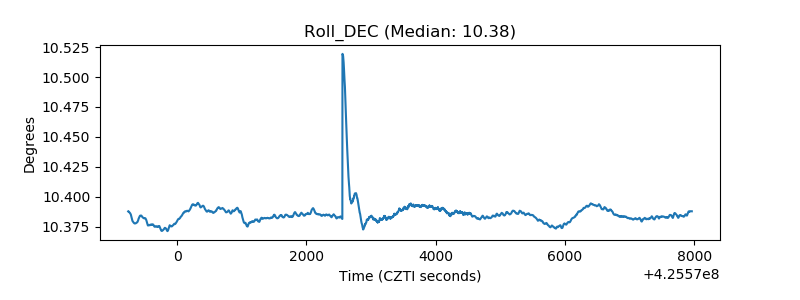 |
| _Roll_RA | 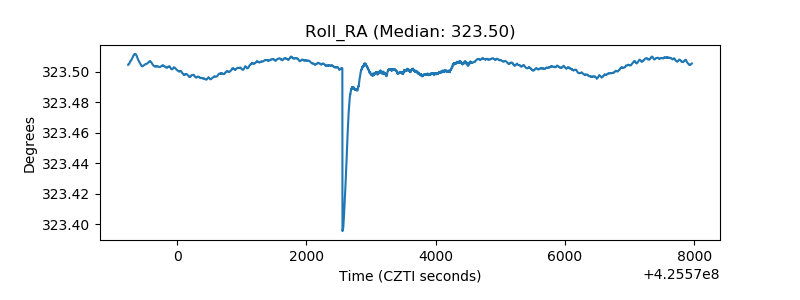 |
| Veto Counter | 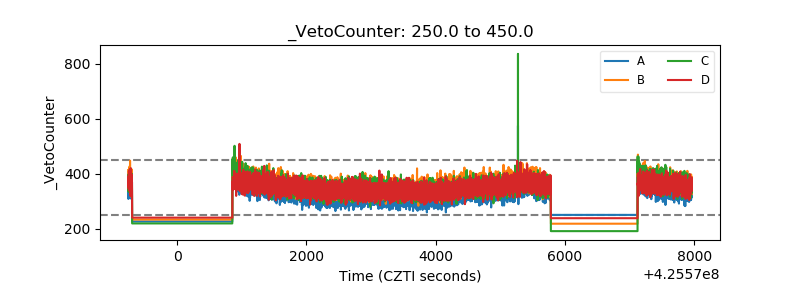 |