| Param | Original file | Final file |
|---|---|---|
| Filename | modeM0/AS1A12_101T04_9000005714_41886cztM0_level2.fits | modeM0/AS1A12_101T04_9000005714_41886cztM0_level2_quad_clean.evt |
| Size (bytes) | 493,159,680 | 96,448,320 |
| Size | 470.3 MB | 92.0 MB |
| Events in quadrant A | 3,420,131 | 683,092 |
| Events in quadrant B | 3,150,423 | 689,724 |
| Events in quadrant C | 3,521,588 | 626,178 |
| Events in quadrant D | 7,677,082 | 485,021 |
| Mode M9 | |||
|---|---|---|---|
| Quadrant | BADHDUFLAG | Total packets | Discarded packets |
| A | 0 | 27 | 0 |
| B | 0 | 27 | 0 |
| C | 0 | 27 | 0 |
| D | 0 | 27 | 0 |
| Mode M0 | |||
|---|---|---|---|
| Quadrant | BADHDUFLAG | Total packets | Discarded packets |
| A | 0 | 13983 | 3 |
| B | 0 | 13703 | 2 |
| C | 0 | 14428 | 2 |
| D | 0 | 27105 | 2 |
| Mode SS | |||
|---|---|---|---|
| Quadrant | BADHDUFLAG | Total packets | Discarded packets |
| A | 0 | 128 | 0 |
| B | 0 | 128 | 0 |
| C | 0 | 128 | 0 |
| D | 0 | 128 | 0 |
| Quadrant | Total seconds | Saturated seconds | Saturation percentage |
|---|---|---|---|
| A | 6254 | 48 | 0.767509% |
| B | 6254 | 103 | 1.646946% |
| C | 6254 | 249 | 3.981452% |
| D | 6254 | 1474 | 23.568916% |
Noise dominated data is calculated using 1-second bins in cleaned event files. If a bin has >2000 counts, and if more than 50% of those come from <1% of pixels, then it is considered to be noise-dominated and hence unusable.
| Quadrant | # 1 sec bins | Bins with >0 counts | Bins with >2000 counts | High rate bins dominated by noise | Noise dominated (total time) | Noise dominated (detector-on time) | Marked lightcurve |
|---|---|---|---|---|---|---|---|
| A | 8909 | 6256 | 25 | 25 | 0.28% | 0.40% | 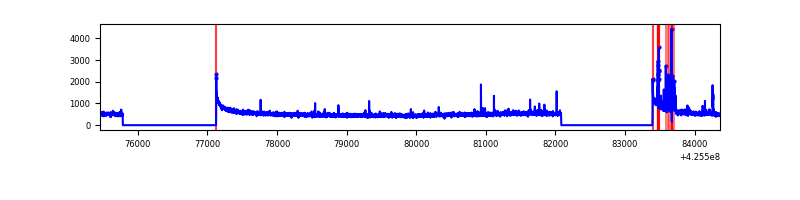 |
| B | 8909 | 6256 | 16 | 16 | 0.18% | 0.26% | 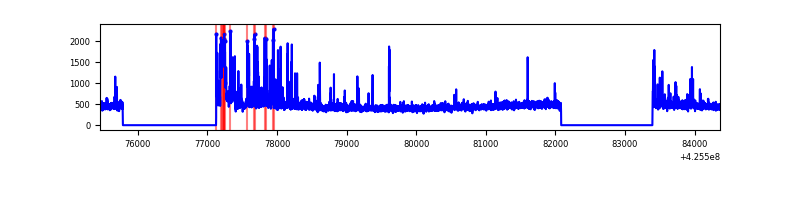 |
| C | 8909 | 6256 | 238 | 238 | 2.67% | 3.80% | 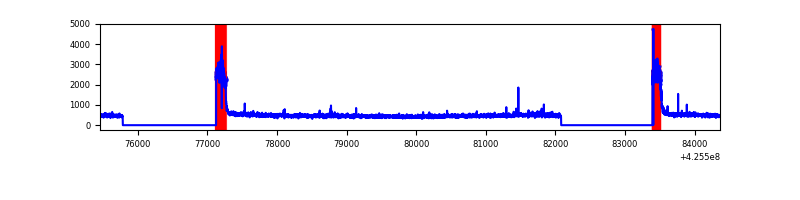 |
| D | 8909 | 6256 | 1351 | 1351 | 15.16% | 21.60% | 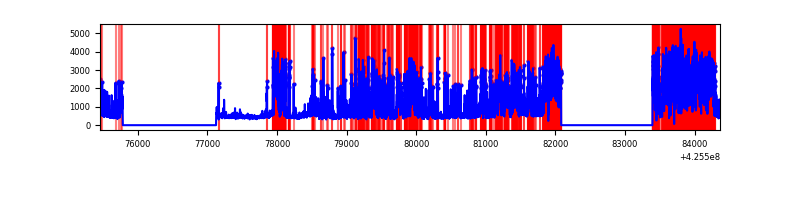 |
Top three noisy pixels from each quadrant. If the there are fewer than three noisy pixels in the level2.evt file, extra rows are filled as -1
| Pixel properties | Quadrant properties | ||||||
|---|---|---|---|---|---|---|---|
| Quadrant | DetID | PixID | Counts | Sigma | Mean | Median | Sigma |
| A | 10 | 83 | 584337 | 4098.6 | 688 | 675 | 142.4 |
| A | 14 | 24 | 158398 | 1107.57 | 688 | 675 | 142.4 |
| A | 2 | 79 | 14804 | 99.22 | 688 | 675 | 142.4 |
| B | 4 | 141 | 206423 | 1549.46 | 679 | 661 | 132.8 |
| B | 0 | 190 | 177589 | 1332.33 | 679 | 661 | 132.8 |
| B | 0 | 245 | 66909 | 498.87 | 679 | 661 | 132.8 |
| C | 0 | 10 | 717053 | 4677.94 | 647 | 650 | 153.1 |
| C | 15 | 214 | 245001 | 1595.55 | 647 | 650 | 153.1 |
| C | 14 | 254 | 17878 | 112.49 | 647 | 650 | 153.1 |
| D | 12 | 79 | 4342606 | 29440.81 | 592 | 576 | 147.5 |
| D | 13 | 249 | 421802 | 2856.09 | 592 | 576 | 147.5 |
| D | 12 | 6 | 387325 | 2622.32 | 592 | 576 | 147.5 |
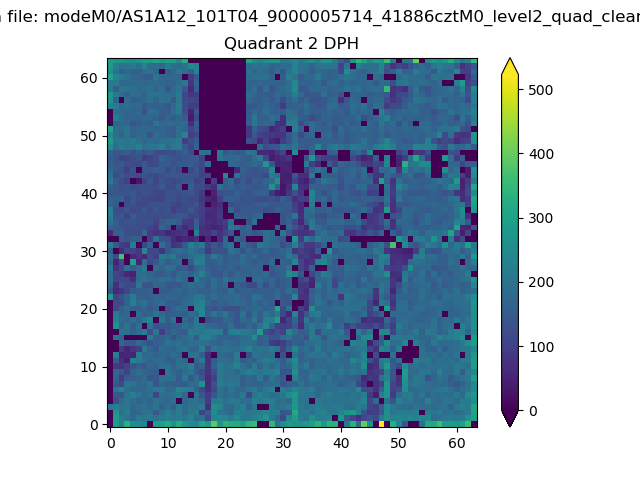
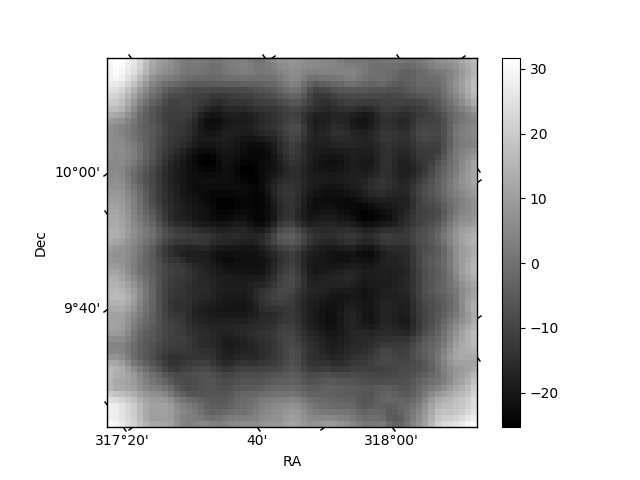
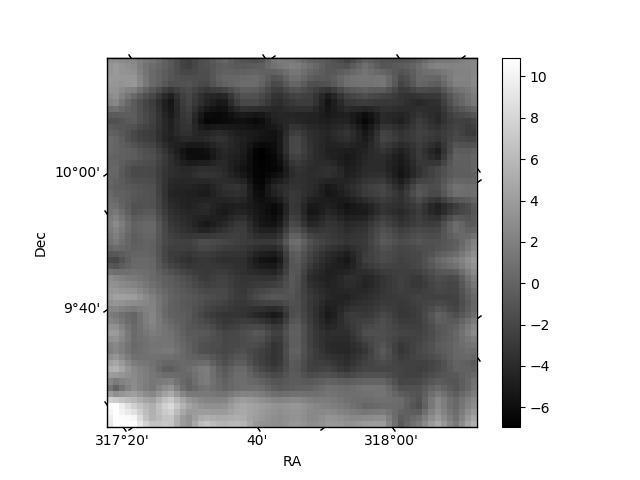
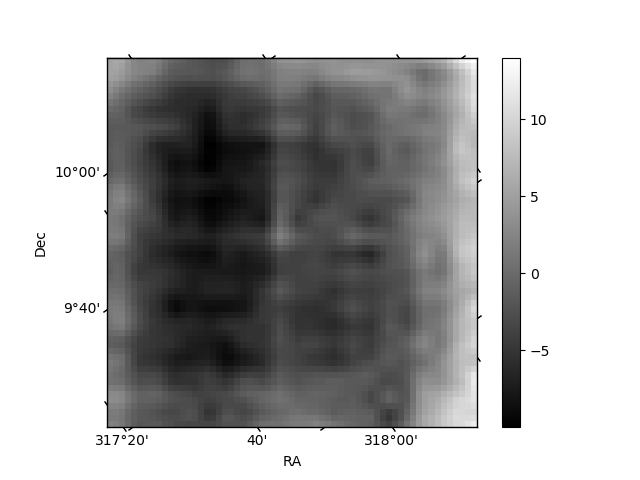
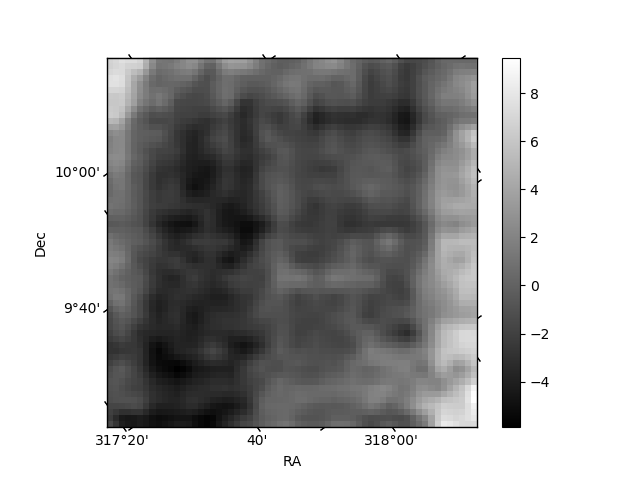
Histogram calculated using DETX and DETY for each event in the final _common_clean file
| Quadrant A | 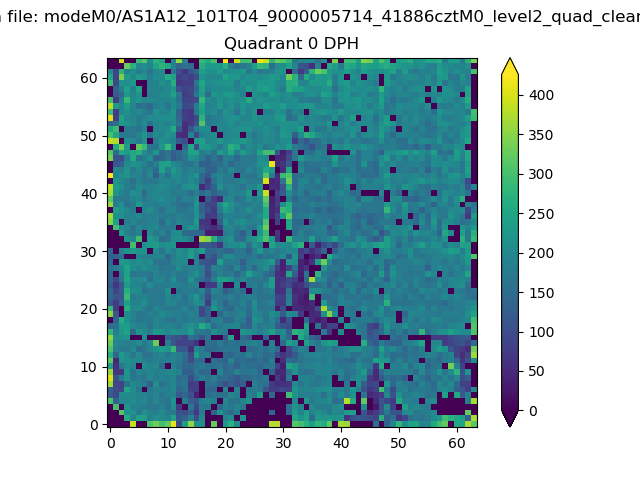 |
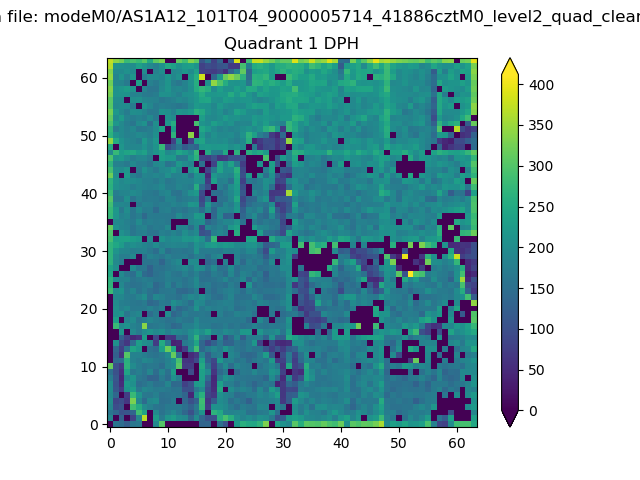 |
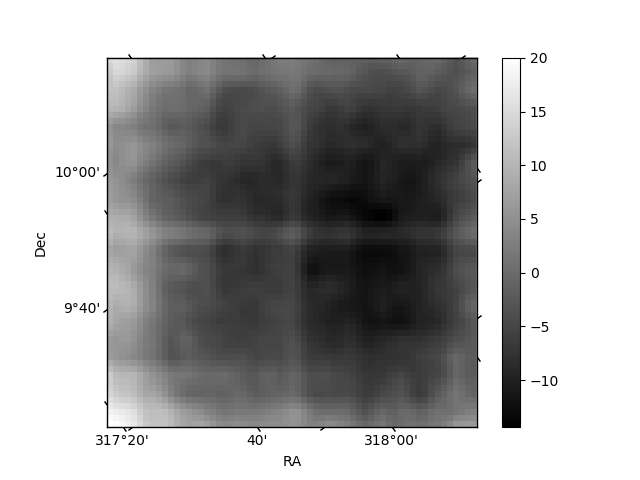
Quadrant B |
|---|---|---|---|
| Quadrant D | 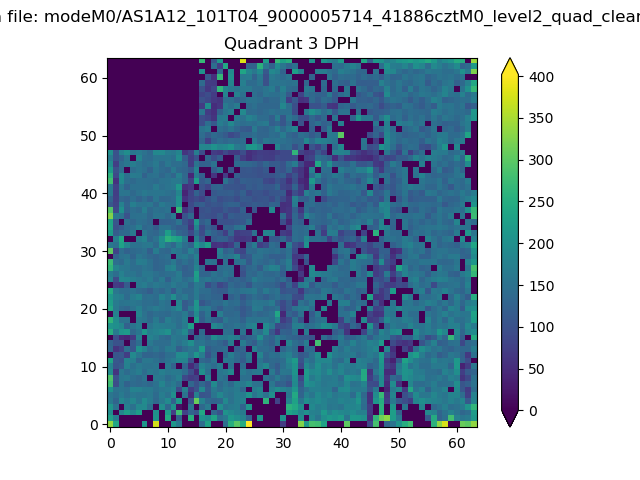 |
 |
Quadrant C |
| Plot type | Count rate plots | Images |
|---|---|---|
| Comparison with Poisson distribution Blue bars denote a histogram of data divided into 1 sec bins. Red curve is a Poisson curve with rate = median count rate of data. |
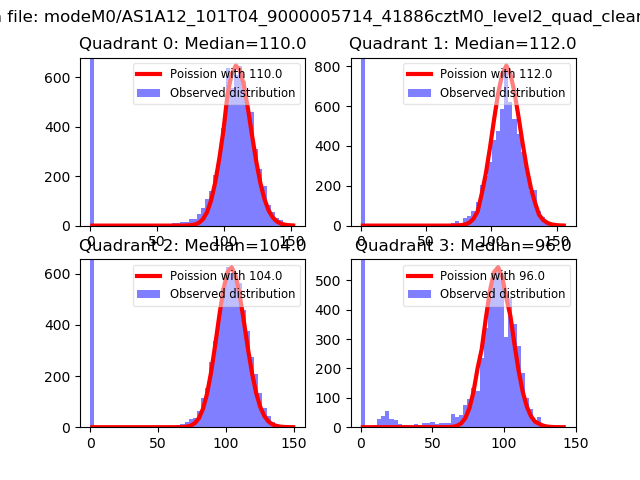 |
 |
| Quadrant-wise count rates Data is divided into 100 sec bins |
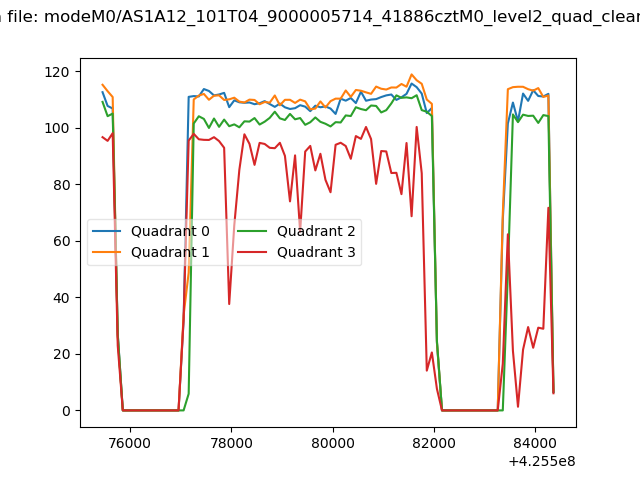 |
|
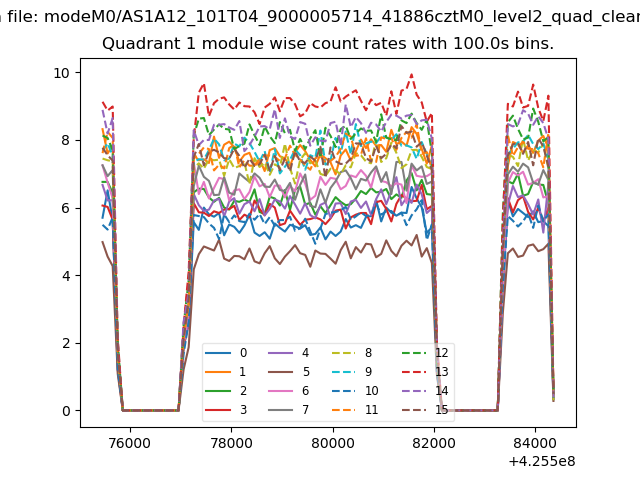
| Module-wise count rates for Quadrant A Data is divided into 100 sec bins |
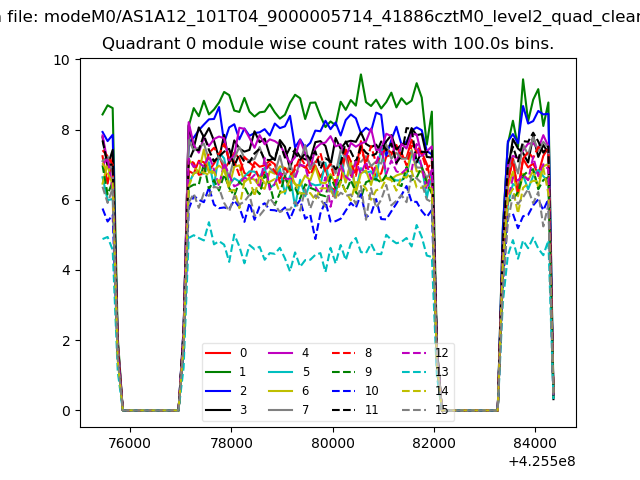 |
 |
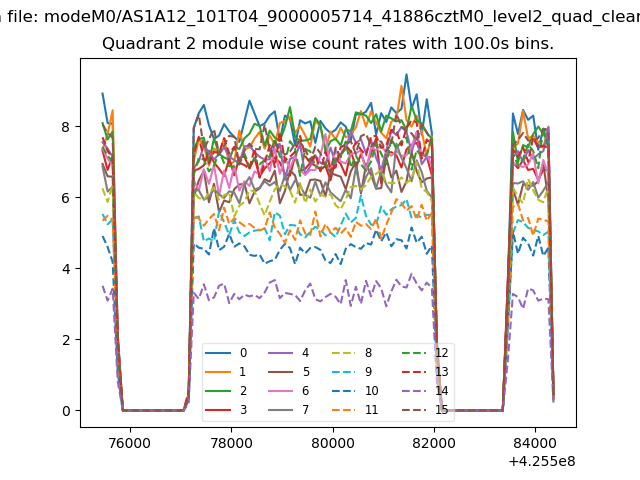
| Module-wise count rates for Quadrant B Data is divided into 100 sec bins |
 |
 |
| Module-wise count rates for Quadrant C Data is divided into 100 sec bins |
 |
 |
| Module-wise count rates for Quadrant D Data is divided into 100 sec bins |
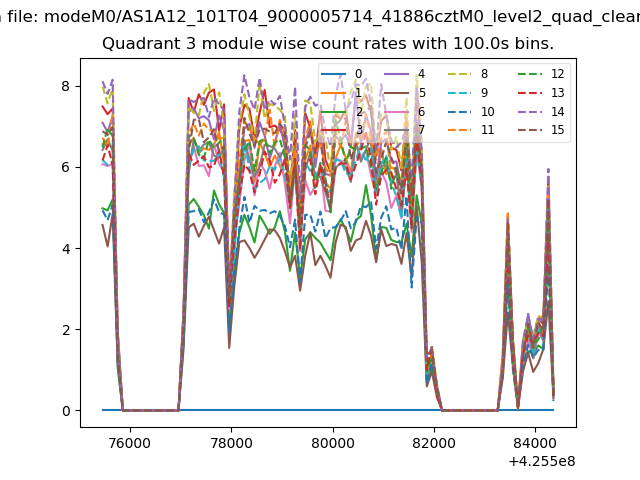 |
 |
| Parameter | Plot |
|---|---|
| CZT HV Monitor | 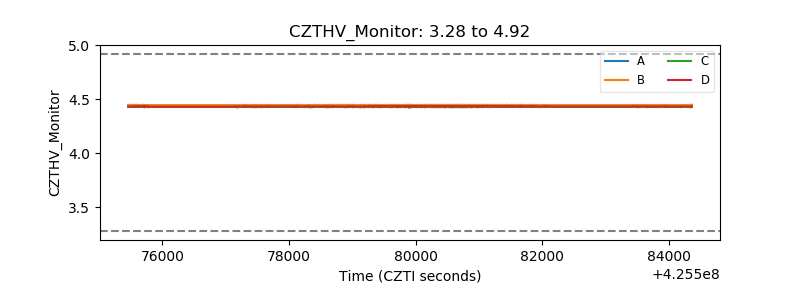 |
| D_VDD | 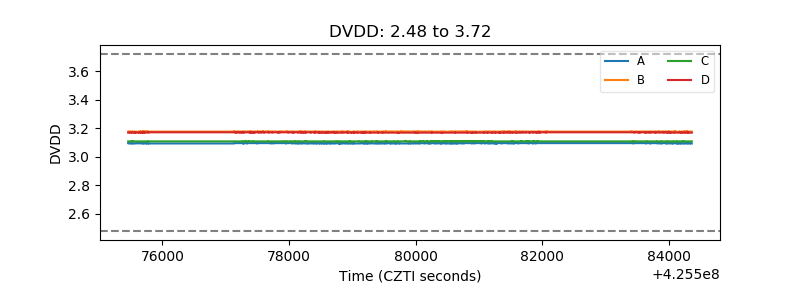 |
| Temperature 1 | 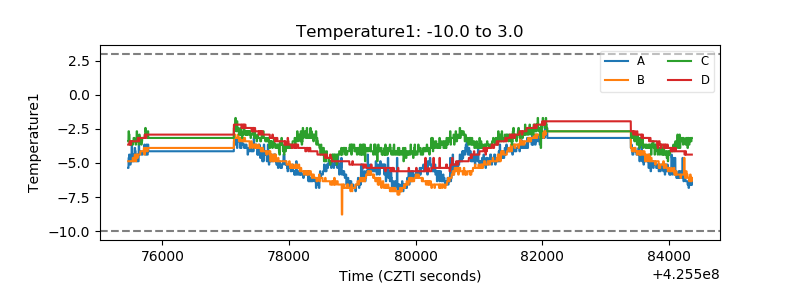 |
| Veto HV Monitor | 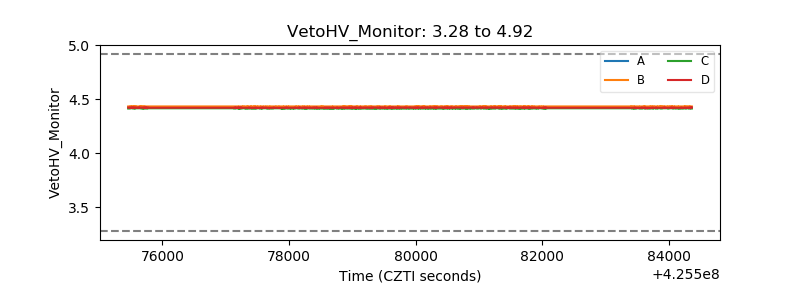 |
| Veto LLD | 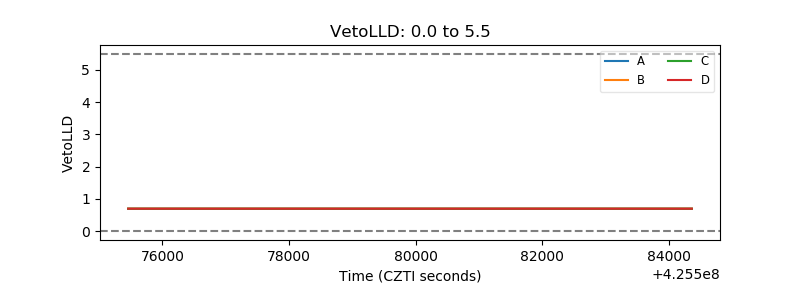 |
| Alpha Counter | 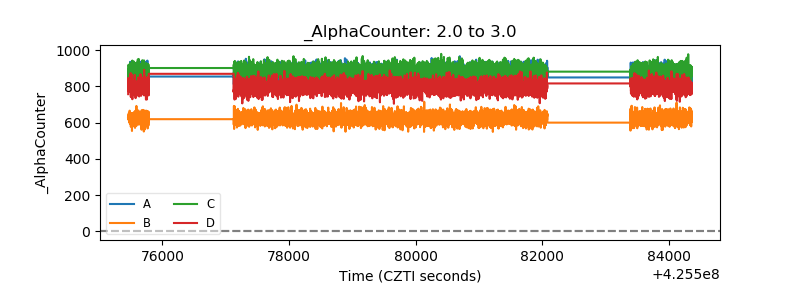 |
| _CPM_Rate | 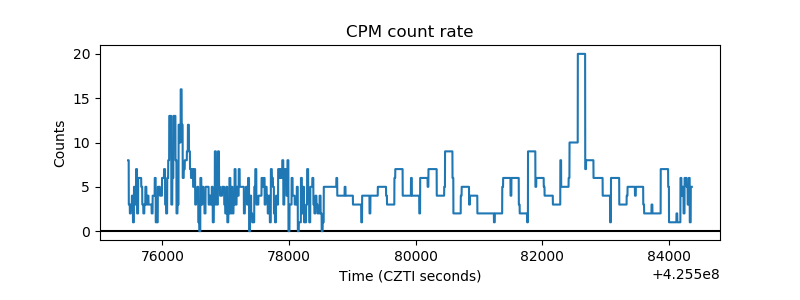 |
| CZT Counter | 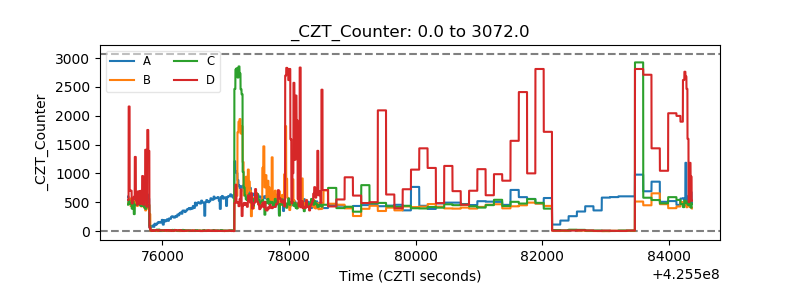 |
| +2.5 Volts monitor | 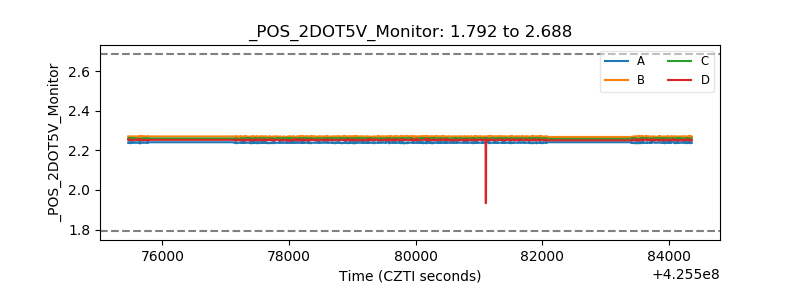 |
| +5 Volts monitor | 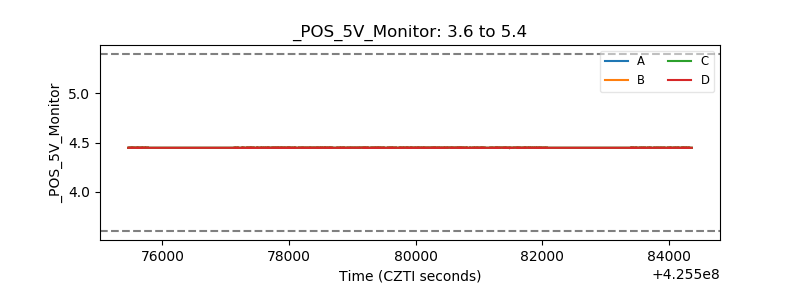 |
| _ROLL_ROT | 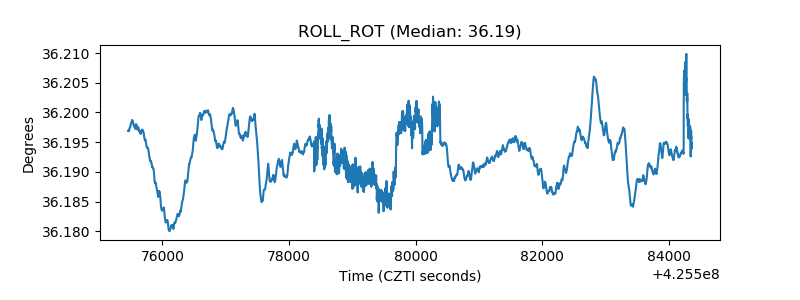 |
| _Roll_DEC | 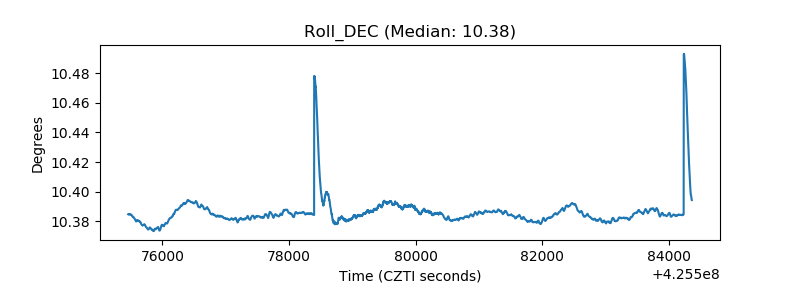 |
| _Roll_RA | 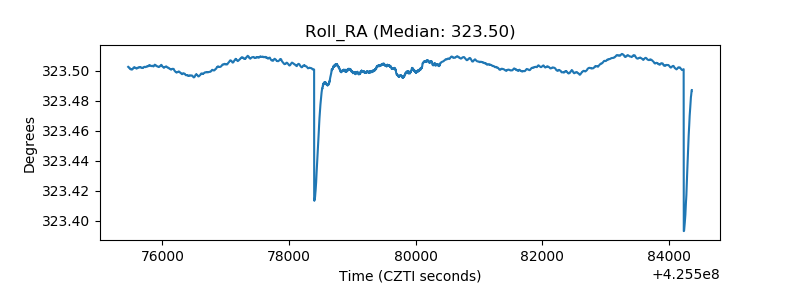 |
| Veto Counter | 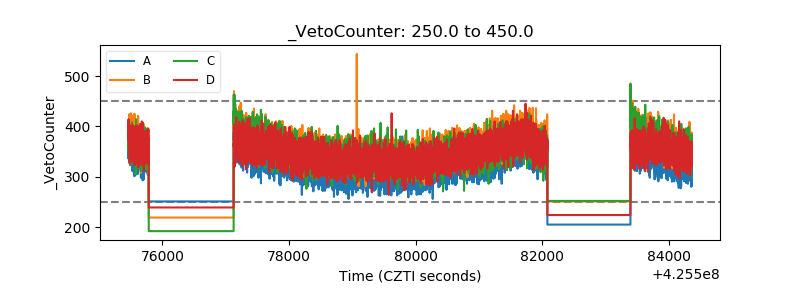 |