| Param | Original file | Final file |
|---|---|---|
| Filename | modeM0/AS1A12_101T04_9000005714_41889cztM0_level2.fits | modeM0/AS1A12_101T04_9000005714_41889cztM0_level2_quad_clean.evt |
| Size (bytes) | 898,493,760 | 155,125,440 |
| Size | 856.9 MB | 147.9 MB |
| Events in quadrant A | 7,901,389 | 1,072,228 |
| Events in quadrant B | 4,828,967 | 1,139,714 |
| Events in quadrant C | 5,797,069 | 1,032,466 |
| Events in quadrant D | 13,933,743 | 738,118 |
| Mode M9 | |||
|---|---|---|---|
| Quadrant | BADHDUFLAG | Total packets | Discarded packets |
| A | 0 | 41 | 0 |
| B | 0 | 41 | 0 |
| C | 0 | 41 | 0 |
| D | 0 | 41 | 0 |
| Mode M0 | |||
|---|---|---|---|
| Quadrant | BADHDUFLAG | Total packets | Discarded packets |
| A | 0 | 30146 | 3 |
| B | 0 | 21640 | 3 |
| C | 0 | 23937 | 3 |
| D | 0 | 48539 | 3 |
| Mode SS | |||
|---|---|---|---|
| Quadrant | BADHDUFLAG | Total packets | Discarded packets |
| A | 0 | 212 | 0 |
| B | 0 | 212 | 0 |
| C | 0 | 212 | 0 |
| D | 0 | 212 | 0 |
| Quadrant | Total seconds | Saturated seconds | Saturation percentage |
|---|---|---|---|
| A | 10308 | 528 | 5.122235% |
| B | 10308 | 57 | 0.552969% |
| C | 10309 | 410 | 3.977107% |
| D | 10309 | 3064 | 29.721602% |
Noise dominated data is calculated using 1-second bins in cleaned event files. If a bin has >2000 counts, and if more than 50% of those come from <1% of pixels, then it is considered to be noise-dominated and hence unusable.
| Quadrant | # 1 sec bins | Bins with >0 counts | Bins with >2000 counts | High rate bins dominated by noise | Noise dominated (total time) | Noise dominated (detector-on time) | Marked lightcurve |
|---|---|---|---|---|---|---|---|
| A | 14398 | 10311 | 438 | 438 | 3.04% | 4.25% | 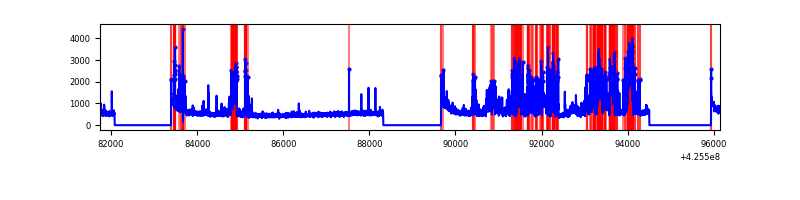 |
| B | 14398 | 10311 | 21 | 21 | 0.15% | 0.20% | 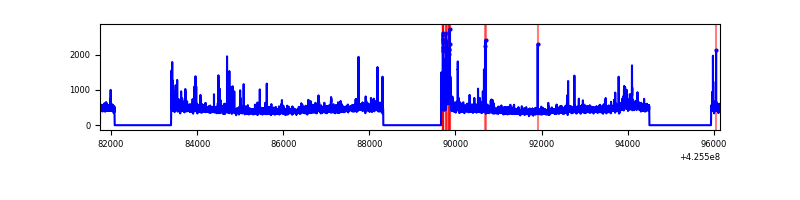 |
| C | 14399 | 10312 | 397 | 397 | 2.76% | 3.85% | 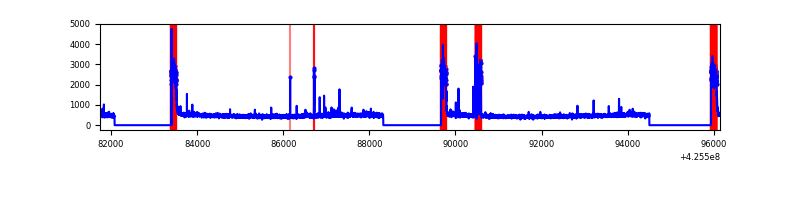 |
| D | 14399 | 10312 | 2723 | 2723 | 18.91% | 26.41% | 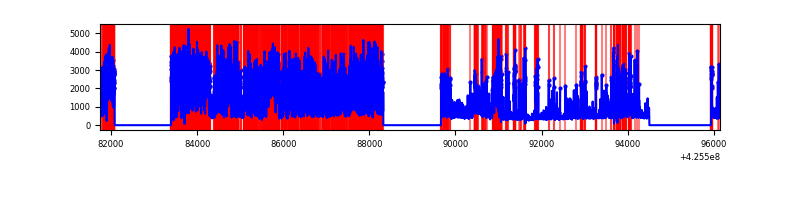 |
Top three noisy pixels from each quadrant. If the there are fewer than three noisy pixels in the level2.evt file, extra rows are filled as -1
| Pixel properties | Quadrant properties | ||||||
|---|---|---|---|---|---|---|---|
| Quadrant | DetID | PixID | Counts | Sigma | Mean | Median | Sigma |
| A | 14 | 24 | 2690427 | 11971.58 | 1096 | 1076 | 224.6 |
| A | 10 | 83 | 878956 | 3907.86 | 1096 | 1076 | 224.6 |
| A | 14 | 250 | 77744 | 341.29 | 1096 | 1076 | 224.6 |
| B | 0 | 190 | 195425 | 905.07 | 1109 | 1079 | 214.7 |
| B | 5 | 255 | 192086 | 889.52 | 1109 | 1079 | 214.7 |
| B | 4 | 141 | 37604 | 170.1 | 1109 | 1079 | 214.7 |
| C | 0 | 10 | 978705 | 3931.12 | 1059 | 1063 | 248.7 |
| C | 15 | 214 | 400864 | 1607.61 | 1059 | 1063 | 248.7 |
| C | 14 | 254 | 243890 | 976.41 | 1059 | 1063 | 248.7 |
| D | 12 | 79 | 8230236 | 35698.65 | 937 | 908 | 230.5 |
| D | 13 | 249 | 1038734 | 4502.07 | 937 | 908 | 230.5 |
| D | 12 | 6 | 493108 | 2135.15 | 937 | 908 | 230.5 |
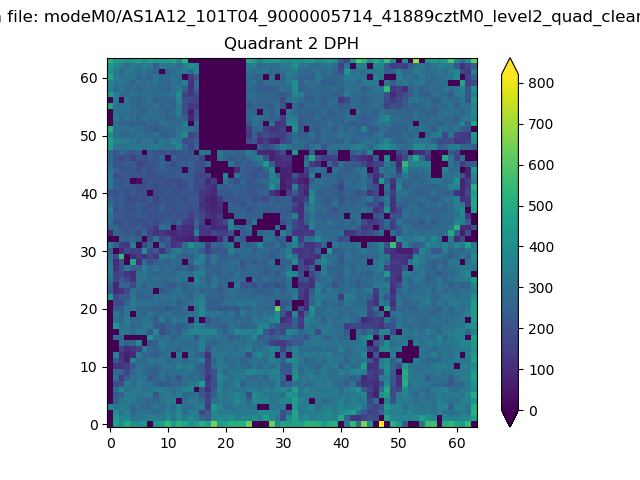
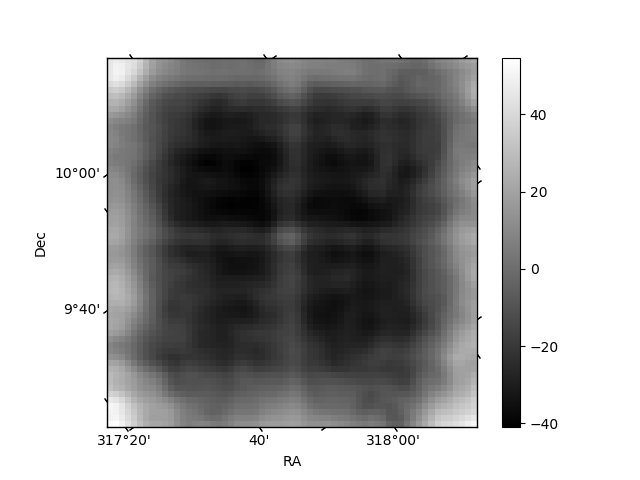
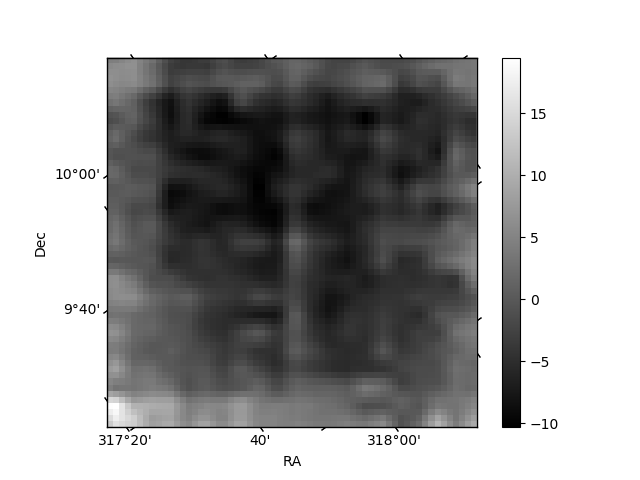
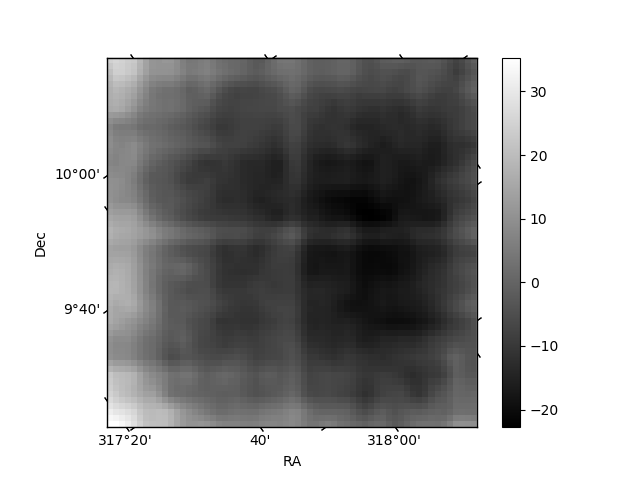
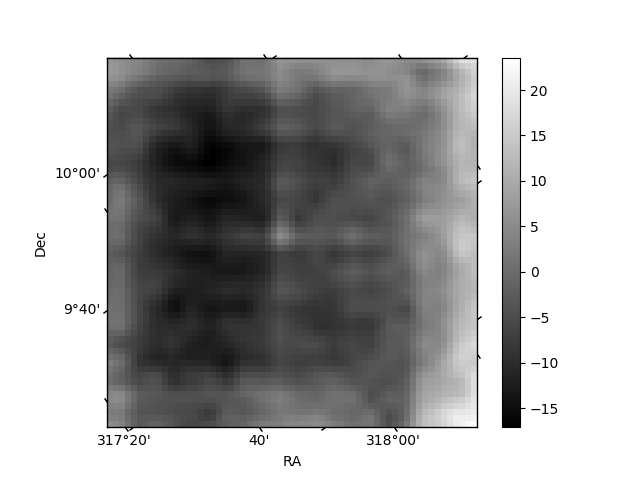
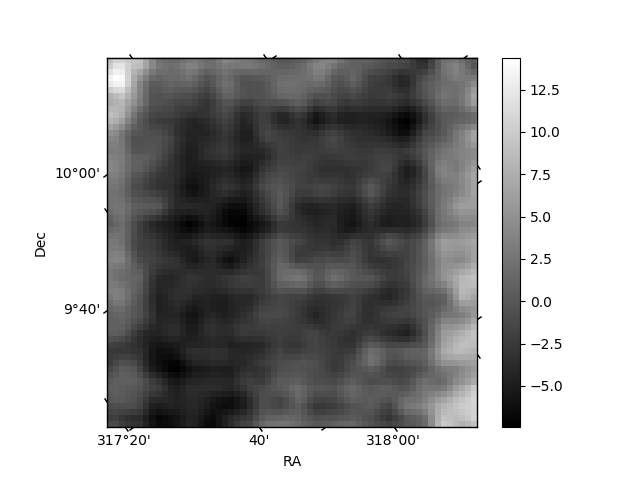
Histogram calculated using DETX and DETY for each event in the final _common_clean file
| Quadrant A | 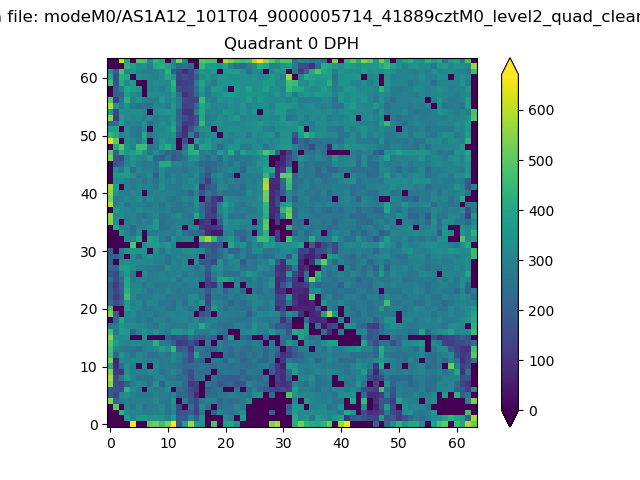 |
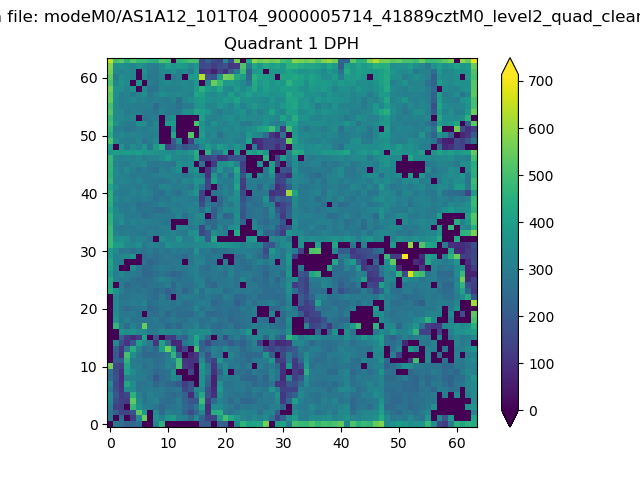 |
Quadrant B |
|---|---|---|---|
| Quadrant D | 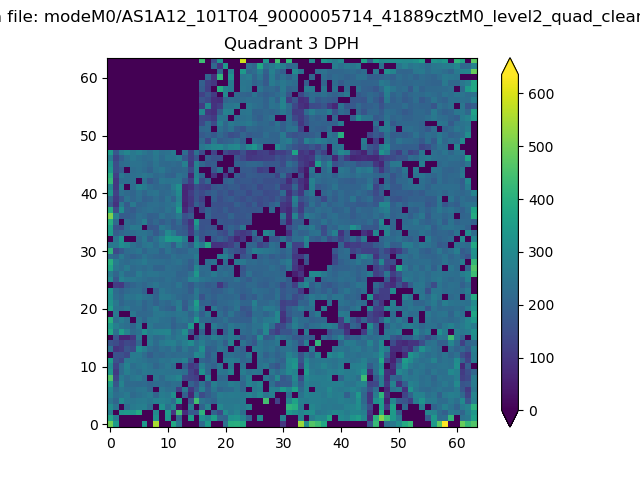 |
 |
Quadrant C |
| Plot type | Count rate plots | Images |
|---|---|---|
| Comparison with Poisson distribution Blue bars denote a histogram of data divided into 1 sec bins. Red curve is a Poisson curve with rate = median count rate of data. |
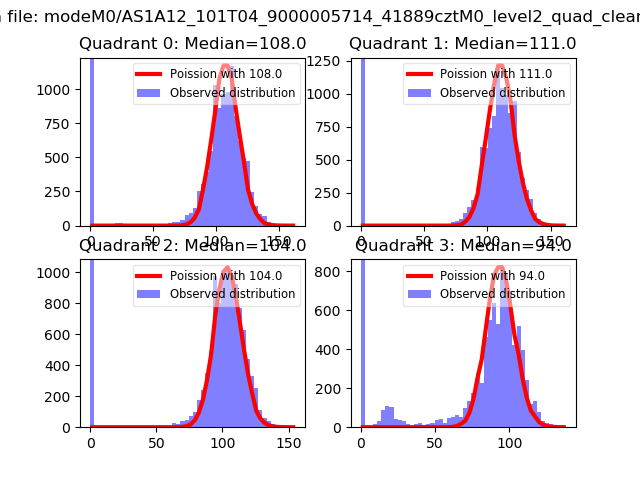 |
 |
| Quadrant-wise count rates Data is divided into 100 sec bins |
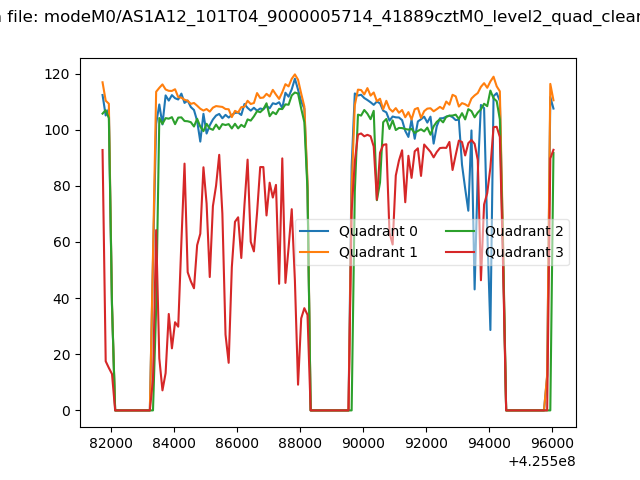 |
|
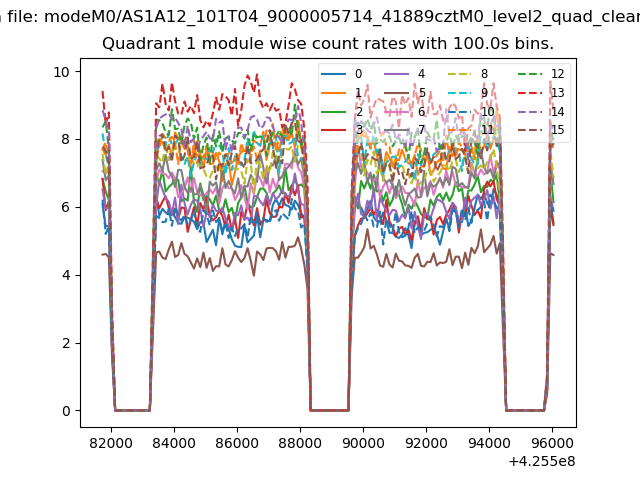
| Module-wise count rates for Quadrant A Data is divided into 100 sec bins |
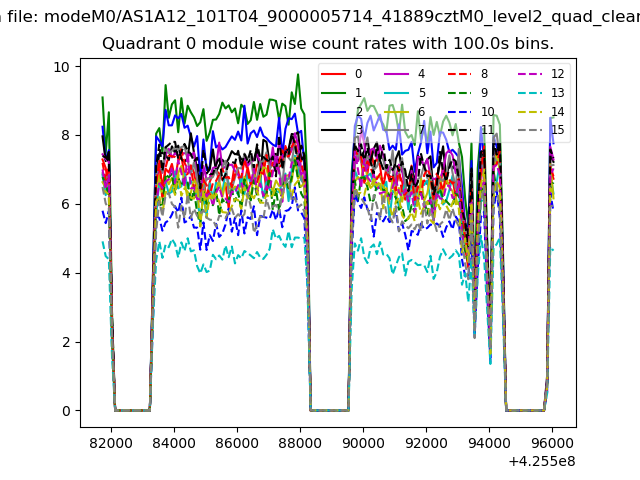 |
 |
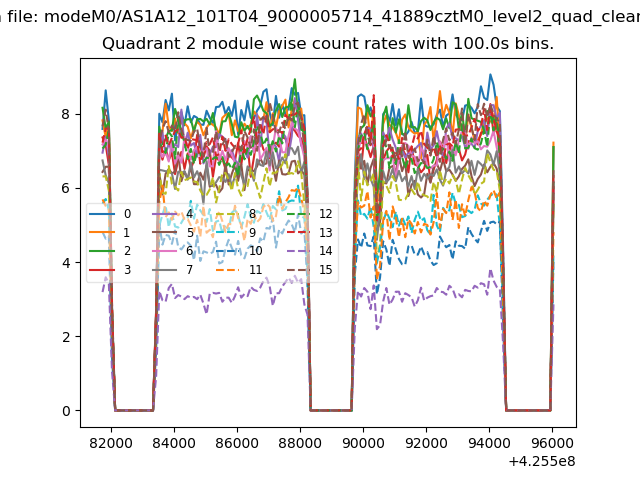
| Module-wise count rates for Quadrant B Data is divided into 100 sec bins |
 |
 |
| Module-wise count rates for Quadrant C Data is divided into 100 sec bins |
 |
 |
| Module-wise count rates for Quadrant D Data is divided into 100 sec bins |
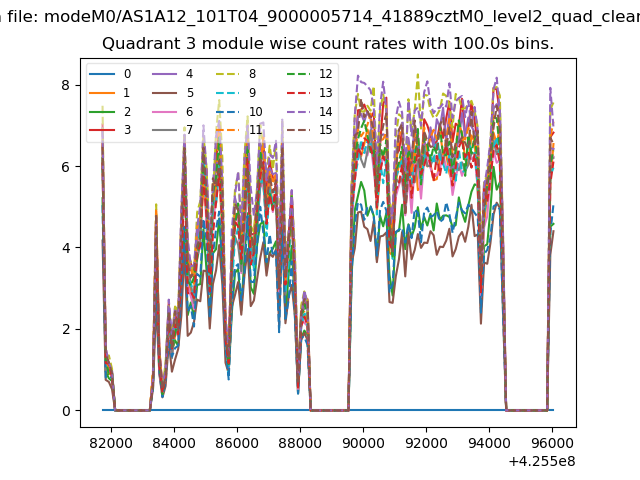 |
 |
| Parameter | Plot |
|---|---|
| CZT HV Monitor | 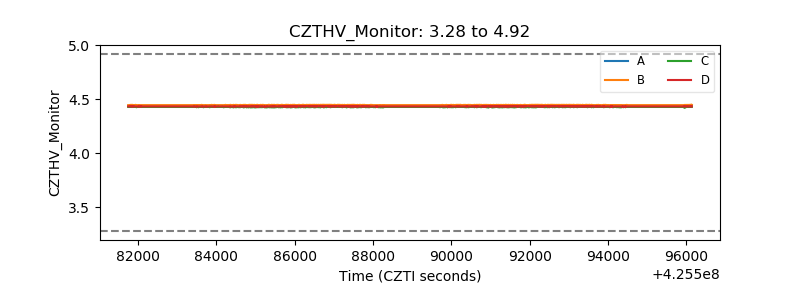 |
| D_VDD | 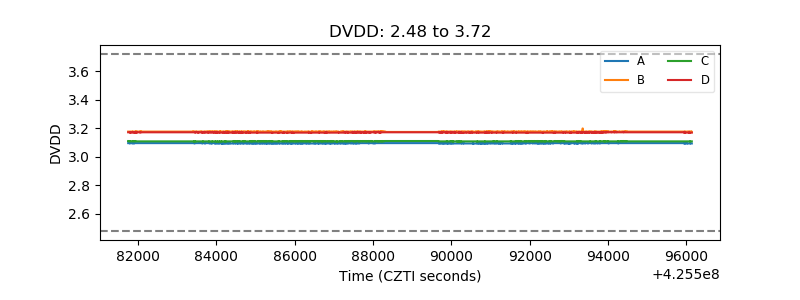 |
| Temperature 1 | 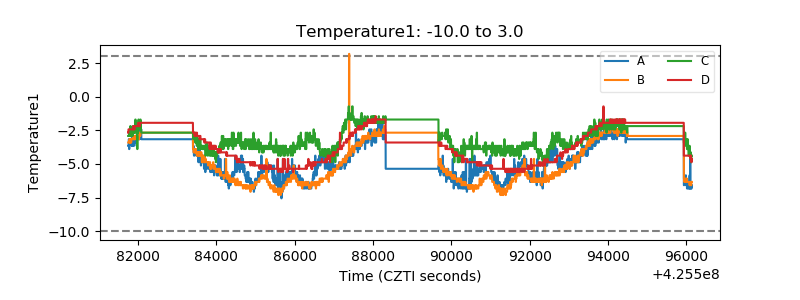 |
| Veto HV Monitor | 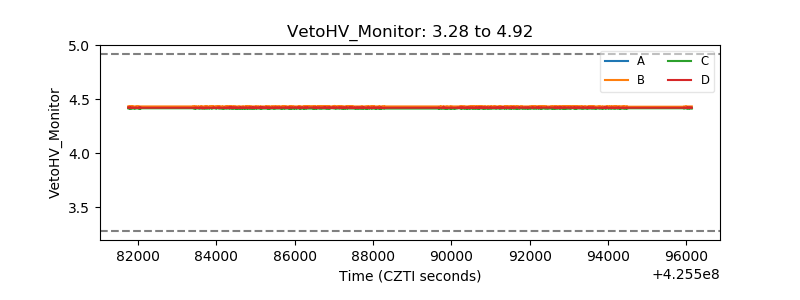 |
| Veto LLD | 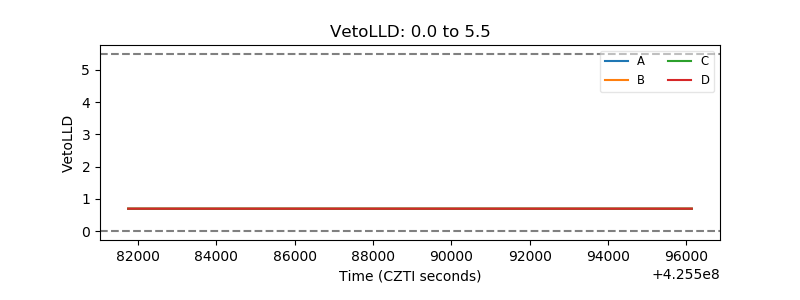 |
| Alpha Counter | 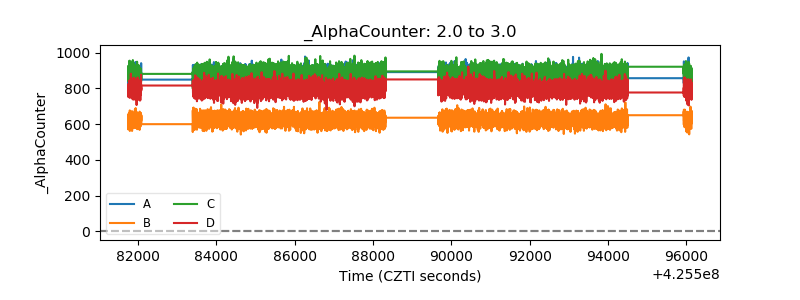 |
| _CPM_Rate |  |
| CZT Counter | 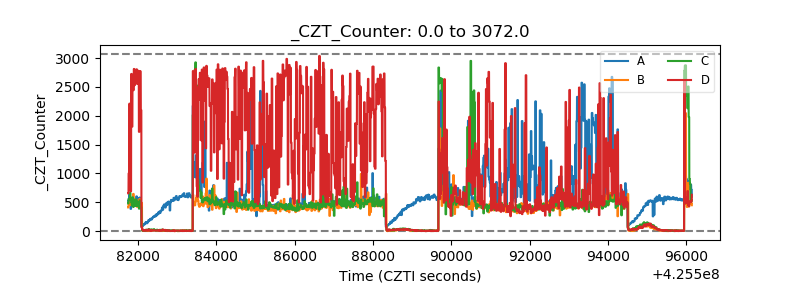 |
| +2.5 Volts monitor | 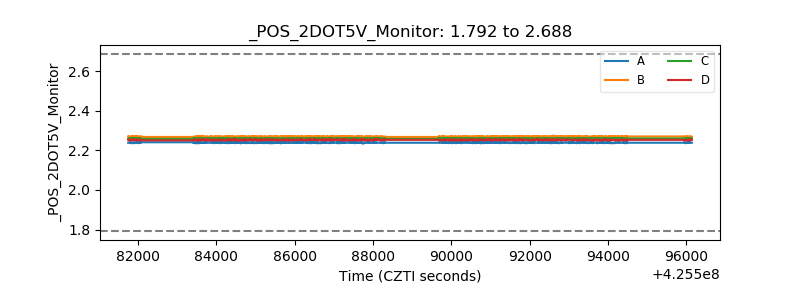 |
| +5 Volts monitor | 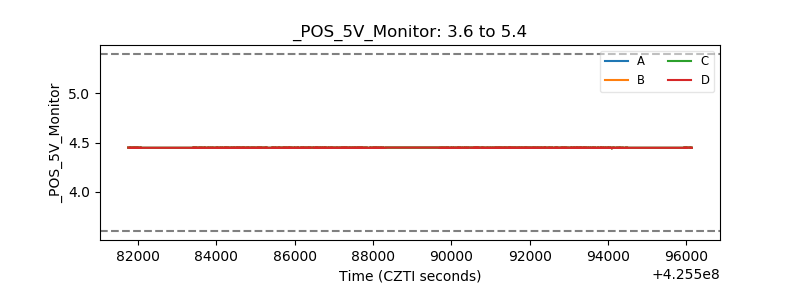 |
| _ROLL_ROT | 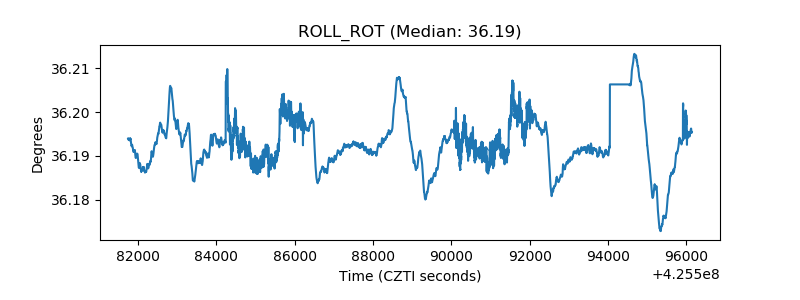 |
| _Roll_DEC |  |
| _Roll_RA | 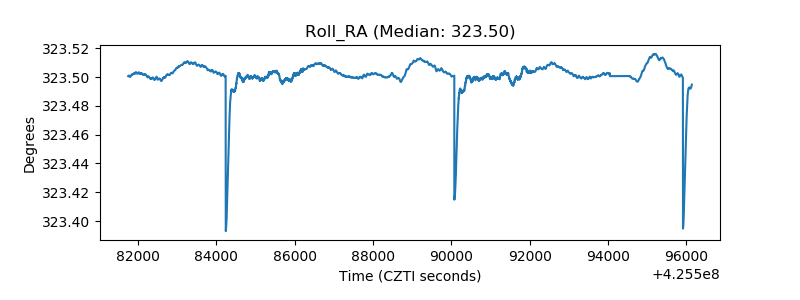 |
| Veto Counter | 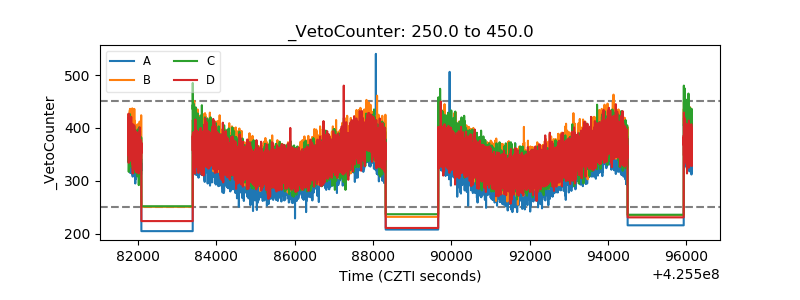 |