| Param | Original file | Final file |
|---|---|---|
| Filename | modeM0/AS1T05_118T01_9000005718_41914cztM0_level2.fits | modeM0/AS1T05_118T01_9000005718_41914cztM0_level2_quad_clean.evt |
| Size (bytes) | 330,782,400 | 38,779,200 |
| Size | 315.5 MB | 37.0 MB |
| Events in quadrant A | 2,196,406 | 293,671 |
| Events in quadrant B | 1,414,666 | 313,474 |
| Events in quadrant C | 1,679,228 | 294,612 |
| Events in quadrant D | 6,733,949 | 71,186 |
| Mode SS | |||
|---|---|---|---|
| Quadrant | BADHDUFLAG | Total packets | Discarded packets |
| A | 0 | 60 | 0 |
| B | 0 | 60 | 0 |
| C | 0 | 60 | 0 |
| D | 0 | 60 | 0 |
| Mode M9 | |||
|---|---|---|---|
| Quadrant | BADHDUFLAG | Total packets | Discarded packets |
| A | 0 | 13 | 0 |
| B | 0 | 13 | 0 |
| C | 0 | 13 | 0 |
| D | 0 | 13 | 0 |
| Mode M0 | |||
|---|---|---|---|
| Quadrant | BADHDUFLAG | Total packets | Discarded packets |
| A | 0 | 8319 | 1 |
| B | 0 | 5996 | 1 |
| C | 0 | 6655 | 1 |
| D | 0 | 21812 | 7 |
| Quadrant | Total seconds | Saturated seconds | Saturation percentage |
|---|---|---|---|
| A | 2811 | 182 | 6.474564% |
| B | 2811 | 21 | 0.747065% |
| C | 2811 | 121 | 4.304518% |
| D | 2810 | 2248 | 80.000000% |
Noise dominated data is calculated using 1-second bins in cleaned event files. If a bin has >2000 counts, and if more than 50% of those come from <1% of pixels, then it is considered to be noise-dominated and hence unusable.
| Quadrant | # 1 sec bins | Bins with >0 counts | Bins with >2000 counts | High rate bins dominated by noise | Noise dominated (total time) | Noise dominated (detector-on time) | Marked lightcurve |
|---|---|---|---|---|---|---|---|
| A | 4154 | 2812 | 136 | 136 | 3.27% | 4.84% | 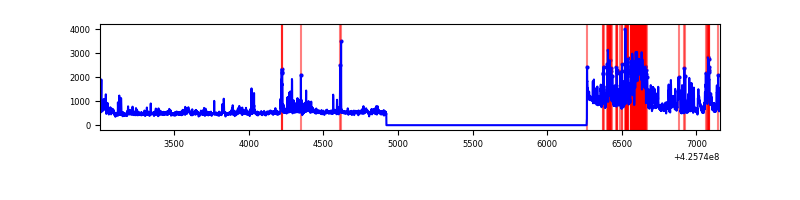 |
| B | 4154 | 2812 | 11 | 11 | 0.26% | 0.39% | 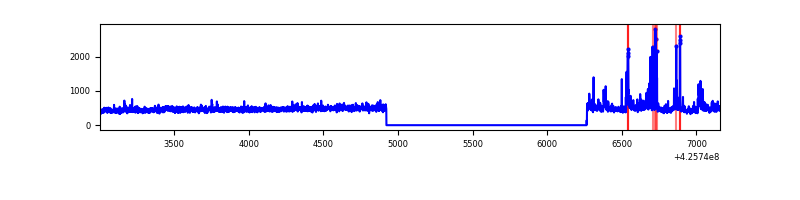 |
| C | 4154 | 2812 | 123 | 123 | 2.96% | 4.37% | 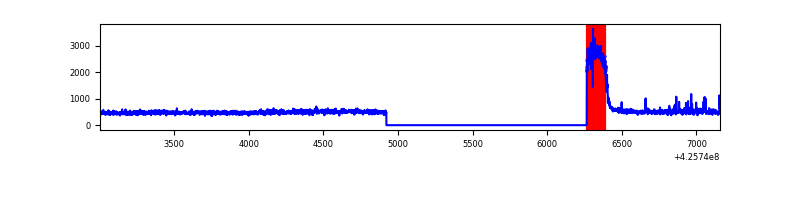 |
| D | 4153 | 2811 | 2179 | 2179 | 52.47% | 77.52% | 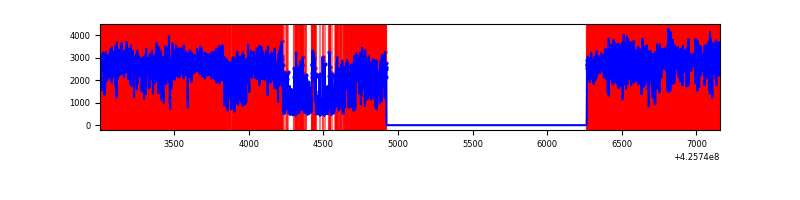 |
Top three noisy pixels from each quadrant. If the there are fewer than three noisy pixels in the level2.evt file, extra rows are filled as -1
| Pixel properties | Quadrant properties | ||||||
|---|---|---|---|---|---|---|---|
| Quadrant | DetID | PixID | Counts | Sigma | Mean | Median | Sigma |
| A | 14 | 24 | 667341 | 10469.07 | 303 | 296 | 63.7 |
| A | 10 | 83 | 275558 | 4320.16 | 303 | 296 | 63.7 |
| A | 7 | 3 | 41954 | 653.81 | 303 | 296 | 63.7 |
| B | 5 | 32 | 78766 | 1278.56 | 310 | 301 | 61.4 |
| B | 7 | 202 | 46901 | 759.33 | 310 | 301 | 61.4 |
| B | 0 | 190 | 20161 | 323.61 | 310 | 301 | 61.4 |
| C | 0 | 10 | 376953 | 5425.85 | 294 | 294 | 69.4 |
| C | 15 | 214 | 109800 | 1577.46 | 294 | 294 | 69.4 |
| C | 15 | 111 | 26869 | 382.82 | 294 | 294 | 69.4 |
| D | 12 | 79 | 5960386 | 155134.86 | 152 | 147 | 38.4 |
| D | 13 | 249 | 92550 | 2405.09 | 152 | 147 | 38.4 |
| D | 12 | 6 | 57158 | 1483.9 | 152 | 147 | 38.4 |
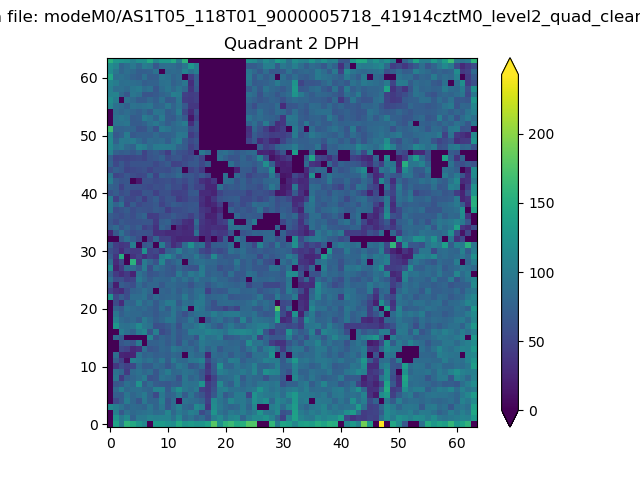
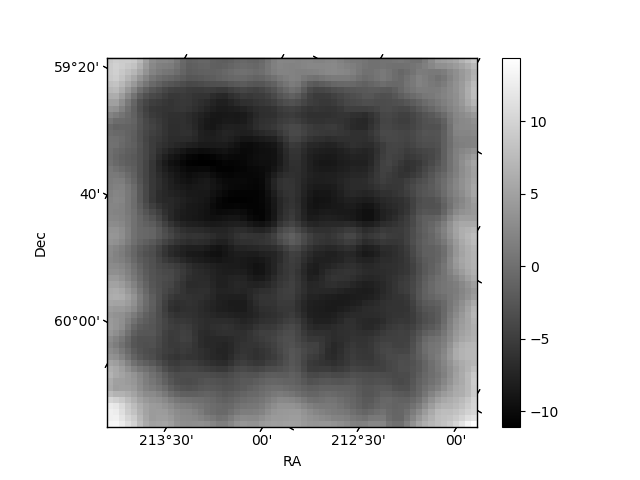
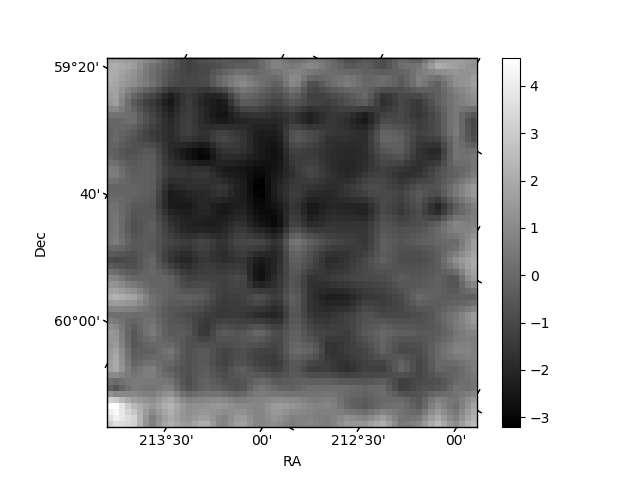
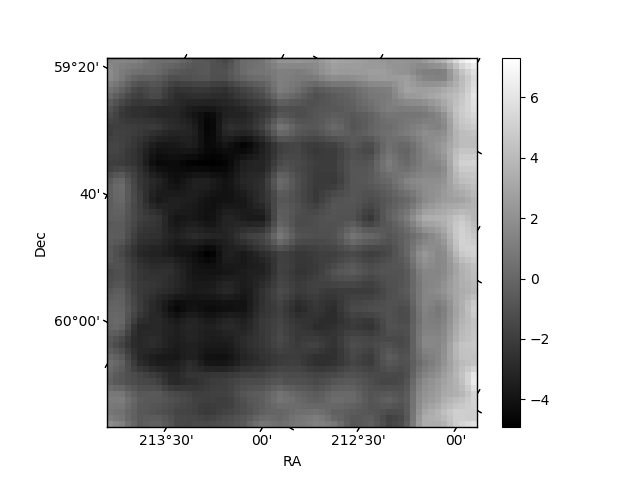
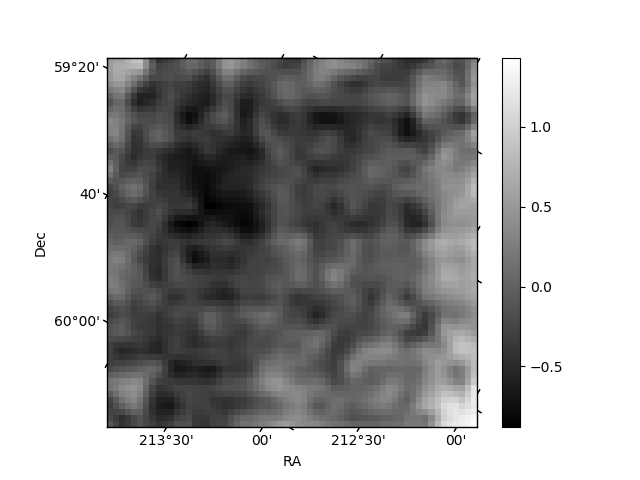
Histogram calculated using DETX and DETY for each event in the final _common_clean file
| Quadrant A | 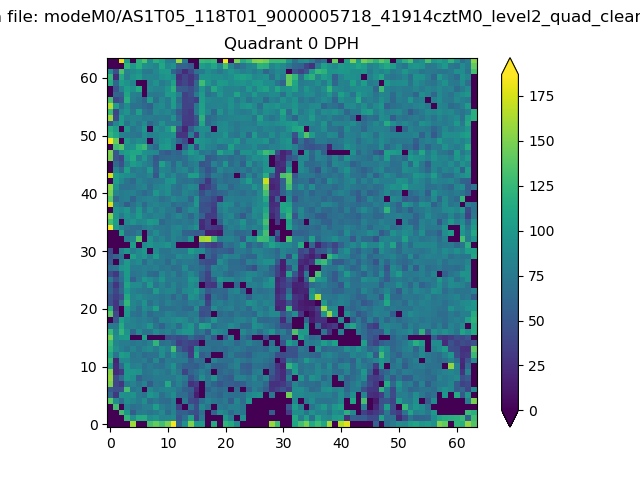 |
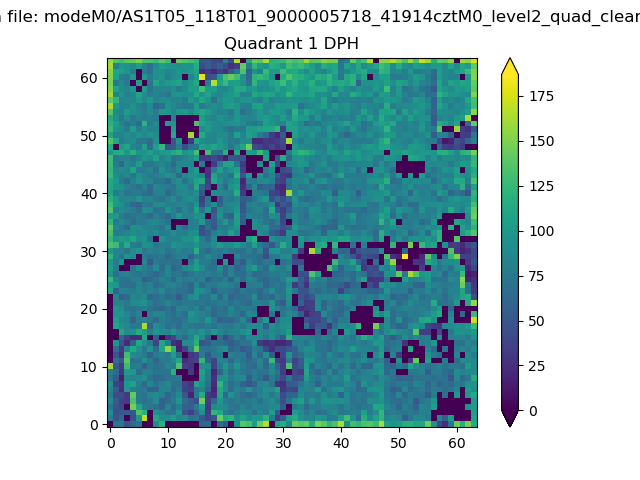 |
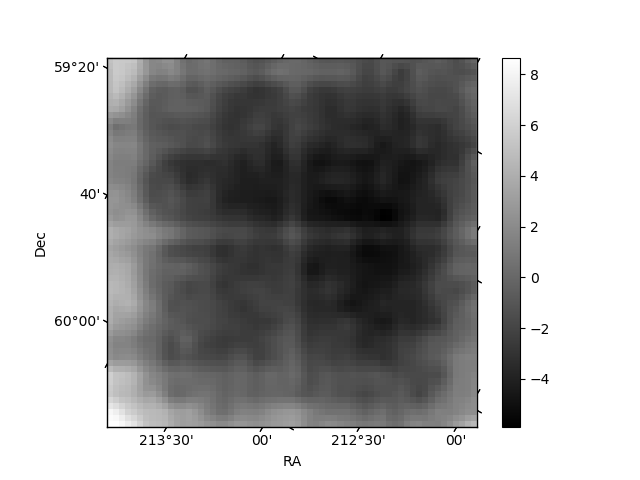
Quadrant B |
|---|---|---|---|
| Quadrant D | 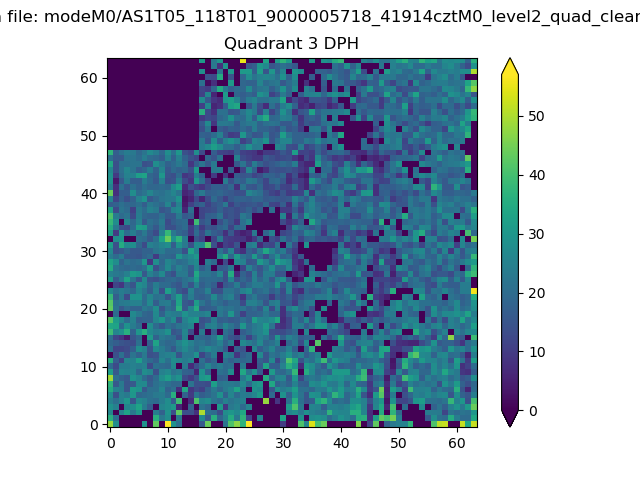 |
 |
Quadrant C |
| Plot type | Count rate plots | Images |
|---|---|---|
| Comparison with Poisson distribution Blue bars denote a histogram of data divided into 1 sec bins. Red curve is a Poisson curve with rate = median count rate of data. |
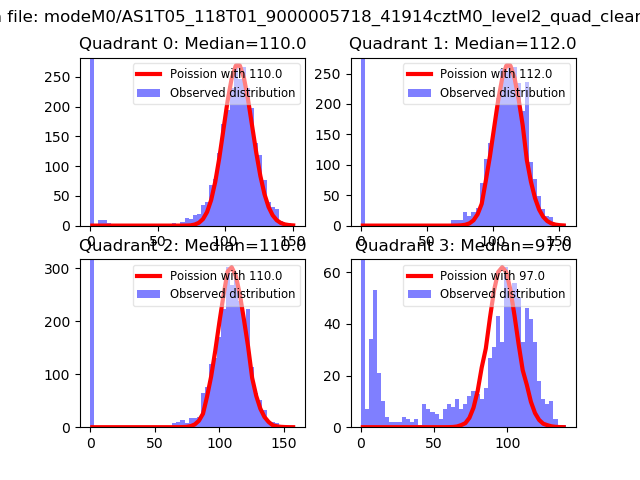 |
 |
| Quadrant-wise count rates Data is divided into 100 sec bins |
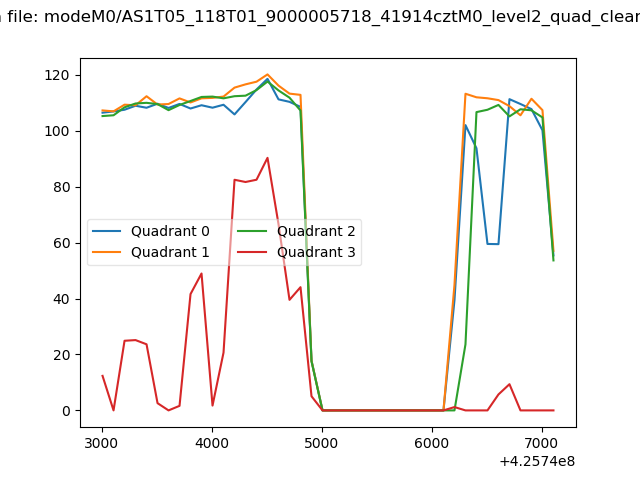 |
|
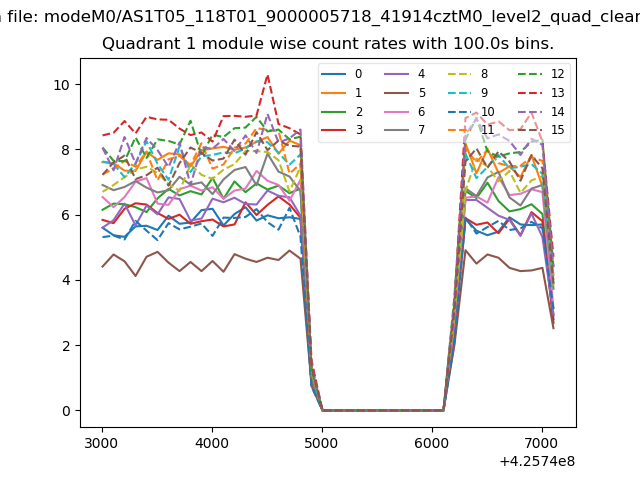
| Module-wise count rates for Quadrant A Data is divided into 100 sec bins |
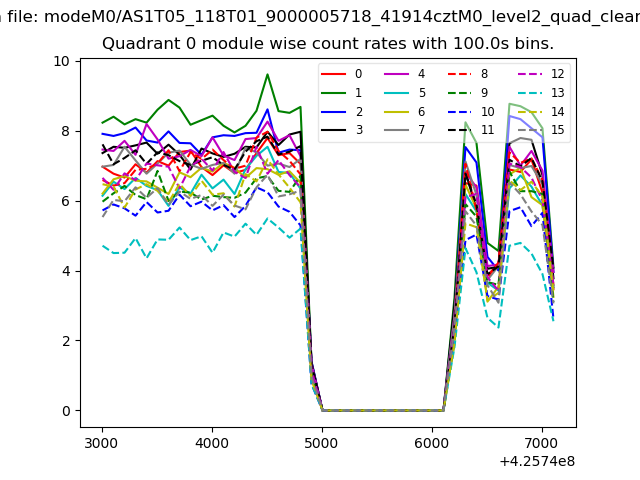 |
 |
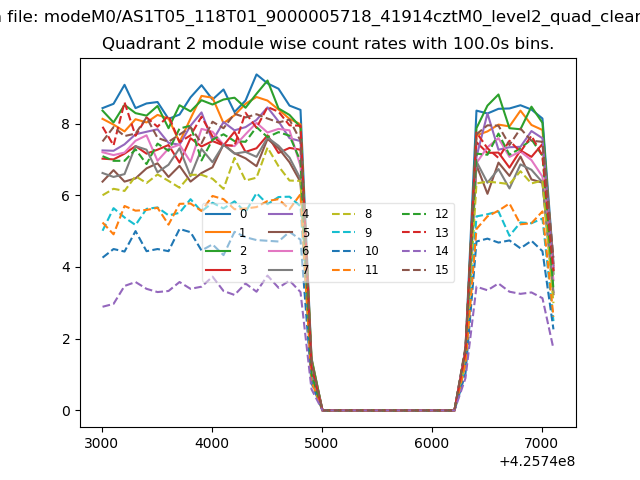
| Module-wise count rates for Quadrant B Data is divided into 100 sec bins |
 |
 |
| Module-wise count rates for Quadrant C Data is divided into 100 sec bins |
 |
 |
| Module-wise count rates for Quadrant D Data is divided into 100 sec bins |
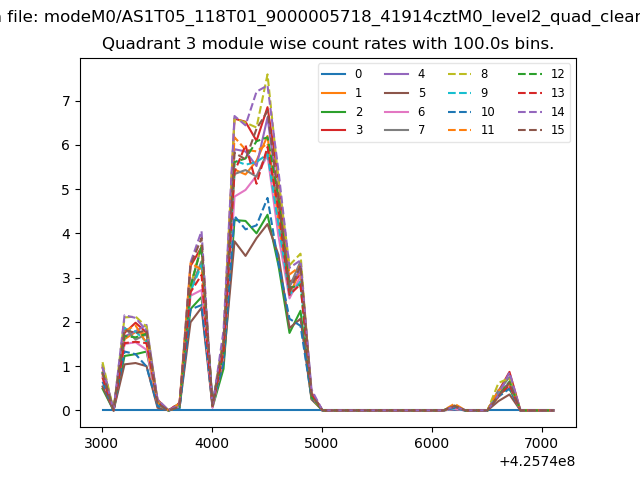 |
 |
| Parameter | Plot |
|---|---|
| CZT HV Monitor | 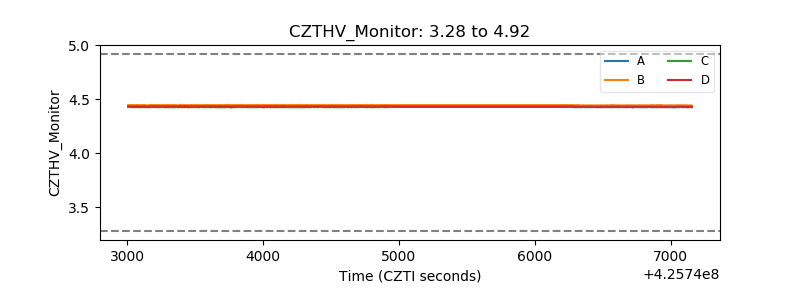 |
| D_VDD | 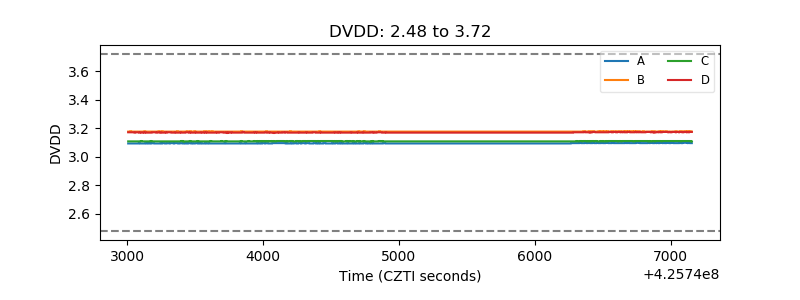 |
| Temperature 1 | 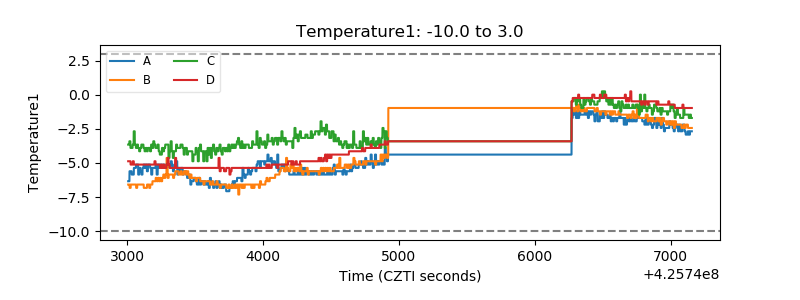 |
| Veto HV Monitor | 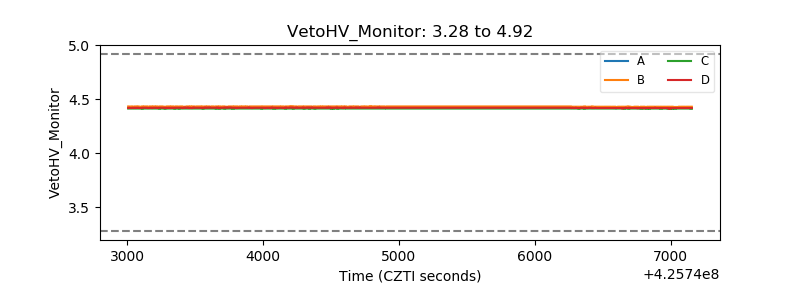 |
| Veto LLD | 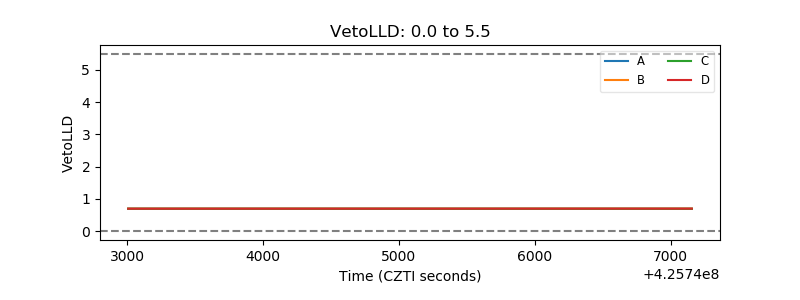 |
| Alpha Counter | 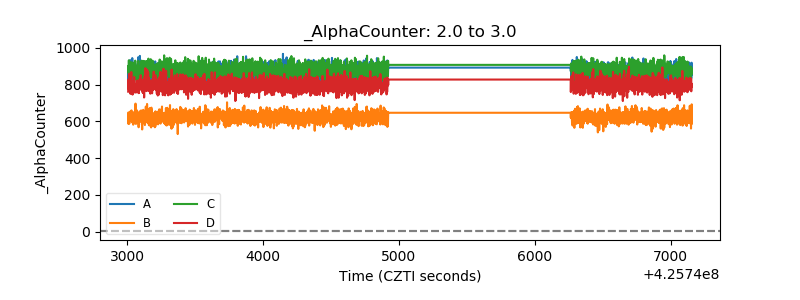 |
| _CPM_Rate | 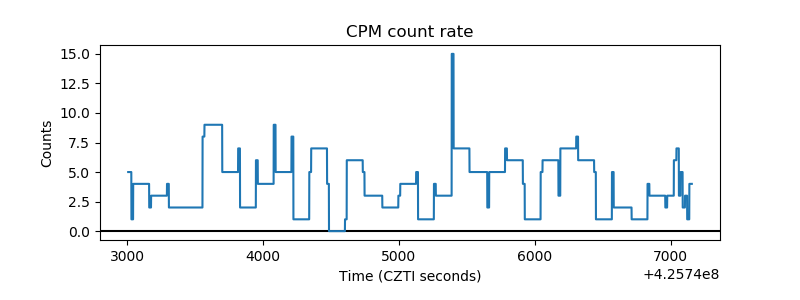 |
| CZT Counter | 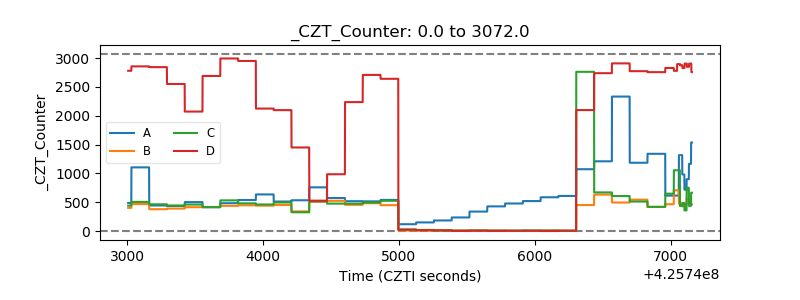 |
| +2.5 Volts monitor | 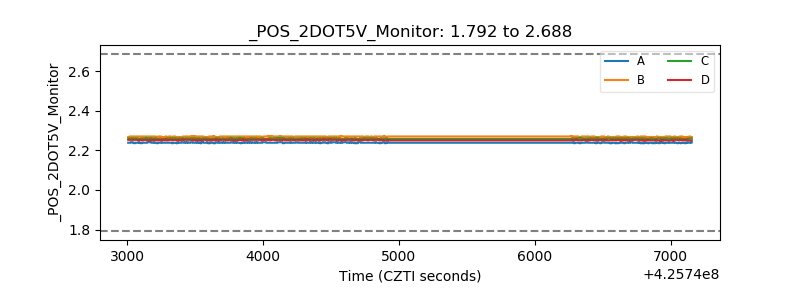 |
| +5 Volts monitor | 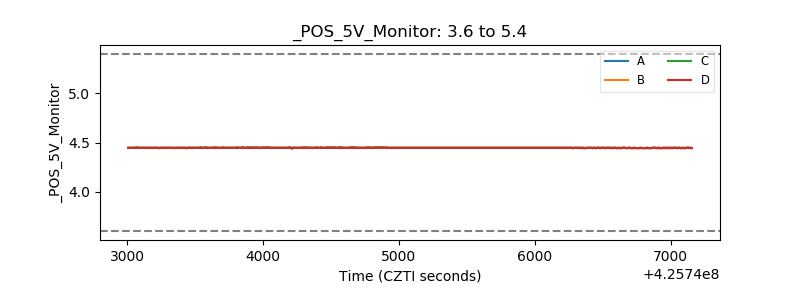 |
| _ROLL_ROT | 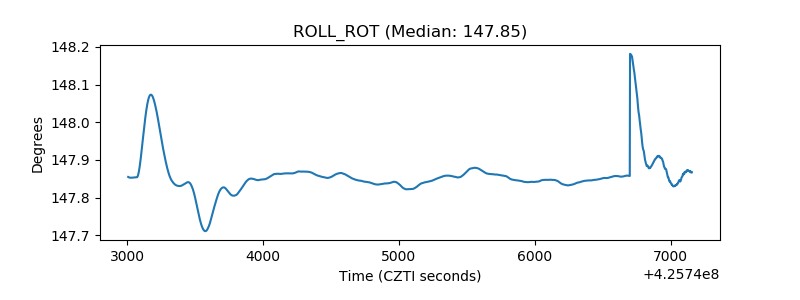 |
| _Roll_DEC | 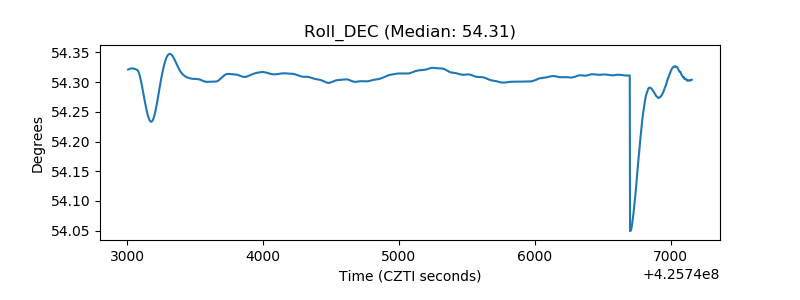 |
| _Roll_RA | 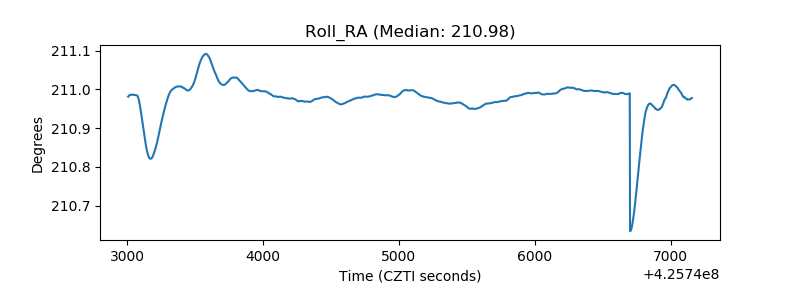 |
| Veto Counter | 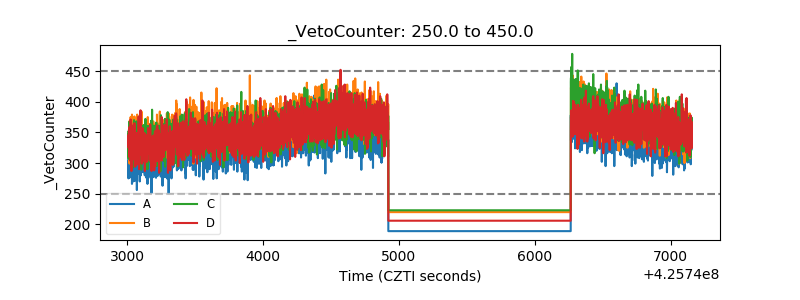 |