| Param | Original file | Final file |
|---|---|---|
| Filename | modeM0/AS1T05_118T01_9000005718_41915cztM0_level2.fits | modeM0/AS1T05_118T01_9000005718_41915cztM0_level2_quad_clean.evt |
| Size (bytes) | 744,762,240 | 76,055,040 |
| Size | 710.3 MB | 72.5 MB |
| Events in quadrant A | 4,529,743 | 605,147 |
| Events in quadrant B | 3,172,551 | 644,502 |
| Events in quadrant C | 3,119,858 | 623,536 |
| Events in quadrant D | 16,284,253 | 13,515 |
| Mode SS | |||
|---|---|---|---|
| Quadrant | BADHDUFLAG | Total packets | Discarded packets |
| A | 0 | 122 | 0 |
| B | 0 | 122 | 0 |
| C | 0 | 122 | 0 |
| D | 0 | 122 | 0 |
| Mode M9 | |||
|---|---|---|---|
| Quadrant | BADHDUFLAG | Total packets | Discarded packets |
| A | 0 | 13 | 0 |
| B | 0 | 13 | 0 |
| C | 0 | 13 | 0 |
| D | 0 | 13 | 0 |
| Mode M0 | |||
|---|---|---|---|
| Quadrant | BADHDUFLAG | Total packets | Discarded packets |
| A | 0 | 17286 | 1 |
| B | 0 | 13595 | 1 |
| C | 0 | 13023 | 1 |
| D | 0 | 51955 | 1 |
| Quadrant | Total seconds | Saturated seconds | Saturation percentage |
|---|---|---|---|
| A | 5951 | 432 | 7.259284% |
| B | 5951 | 101 | 1.697194% |
| C | 5951 | 107 | 1.798017% |
| D | 5952 | 5840 | 98.118280% |
Noise dominated data is calculated using 1-second bins in cleaned event files. If a bin has >2000 counts, and if more than 50% of those come from <1% of pixels, then it is considered to be noise-dominated and hence unusable.
| Quadrant | # 1 sec bins | Bins with >0 counts | Bins with >2000 counts | High rate bins dominated by noise | Noise dominated (total time) | Noise dominated (detector-on time) | Marked lightcurve |
|---|---|---|---|---|---|---|---|
| A | 7264 | 5952 | 356 | 356 | 4.90% | 5.98% | 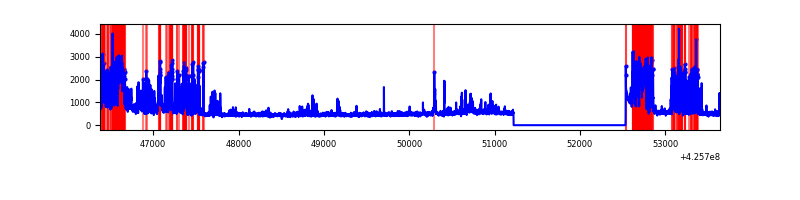 |
| B | 7264 | 5952 | 78 | 78 | 1.07% | 1.31% | 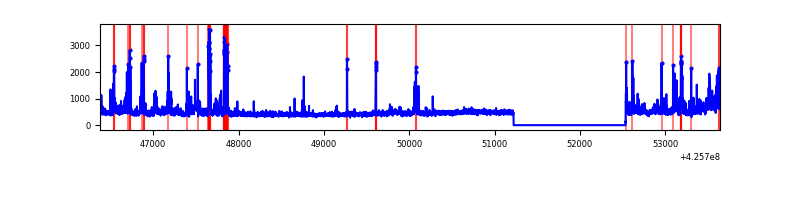 |
| C | 7264 | 5952 | 108 | 108 | 1.49% | 1.81% | 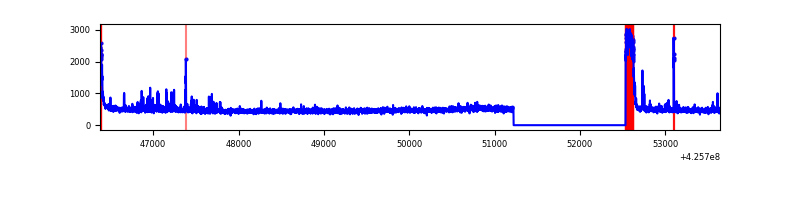 |
| D | 7265 | 5953 | 5644 | 5644 | 77.69% | 94.81% | 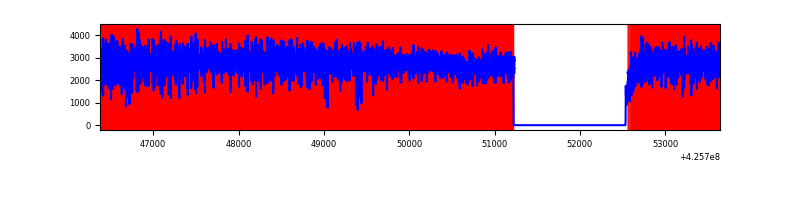 |
Top three noisy pixels from each quadrant. If the there are fewer than three noisy pixels in the level2.evt file, extra rows are filled as -1
| Pixel properties | Quadrant properties | ||||||
|---|---|---|---|---|---|---|---|
| Quadrant | DetID | PixID | Counts | Sigma | Mean | Median | Sigma |
| A | 14 | 24 | 1454959 | 11413.99 | 617 | 604 | 127.4 |
| A | 10 | 83 | 554545 | 4347.41 | 617 | 604 | 127.4 |
| A | 7 | 3 | 91822 | 715.89 | 617 | 604 | 127.4 |
| B | 5 | 32 | 294266 | 2432.16 | 628 | 610 | 120.7 |
| B | 0 | 156 | 124688 | 1027.66 | 628 | 610 | 120.7 |
| B | 5 | 255 | 99725 | 820.91 | 628 | 610 | 120.7 |
| C | 0 | 10 | 341298 | 2349.21 | 619 | 623 | 145.0 |
| C | 15 | 214 | 237035 | 1630.24 | 619 | 623 | 145.0 |
| C | 15 | 111 | 88252 | 604.27 | 619 | 623 | 145.0 |
| D | 12 | 79 | 15265860 | 356536.53 | 167 | 161 | 42.8 |
| D | 5 | 222 | 133250 | 3108.35 | 167 | 161 | 42.8 |
| D | 13 | 249 | 111260 | 2594.76 | 167 | 161 | 42.8 |
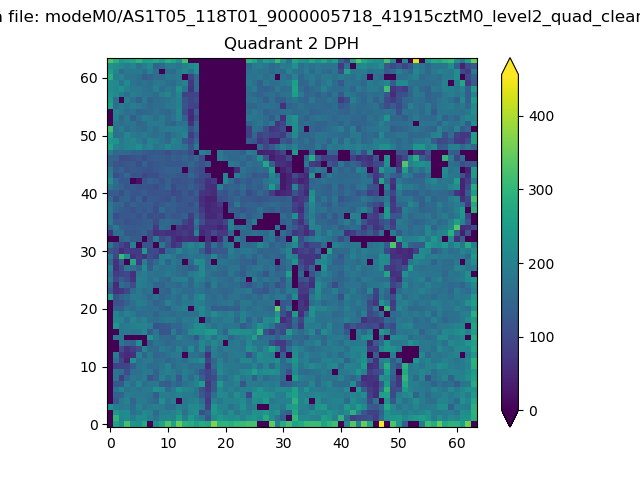
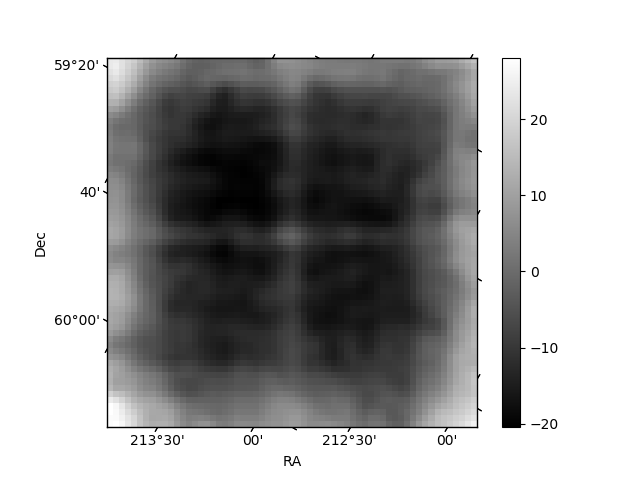
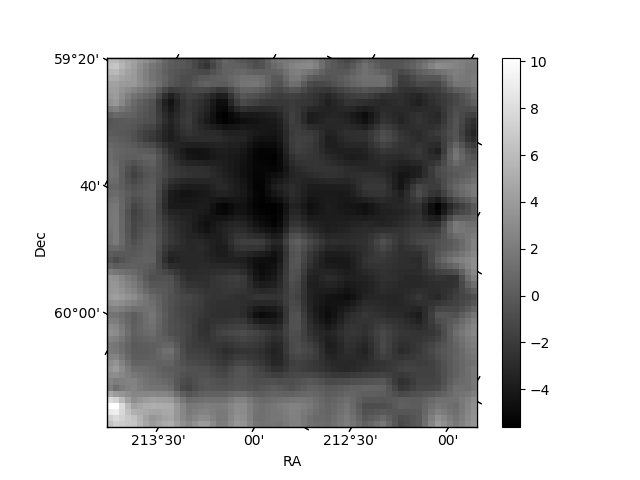
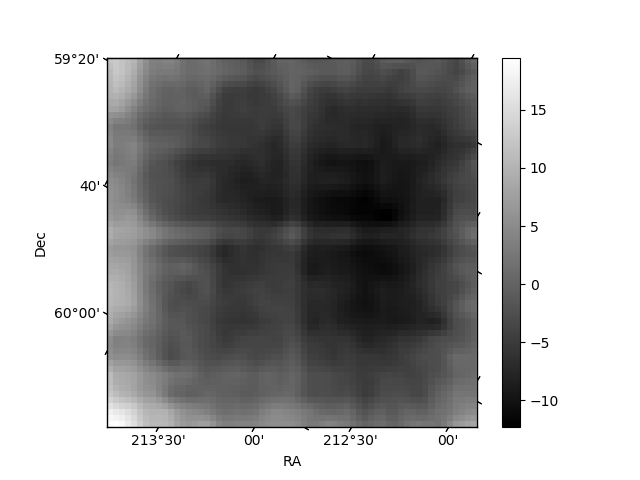
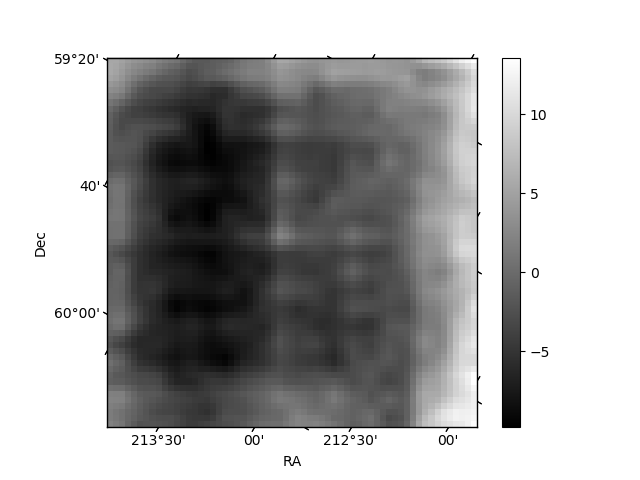
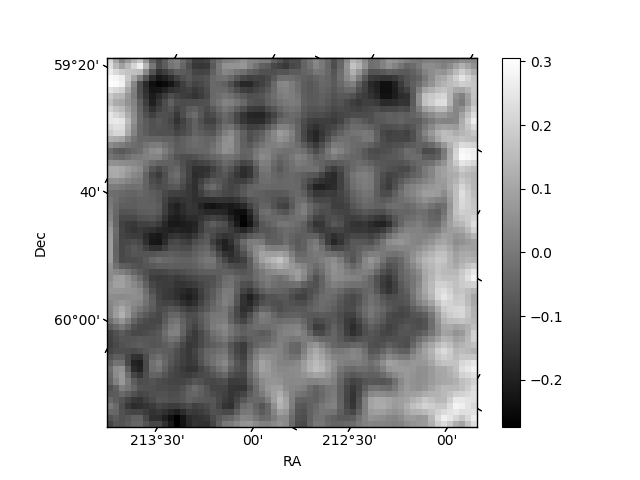
Histogram calculated using DETX and DETY for each event in the final _common_clean file
| Quadrant A | 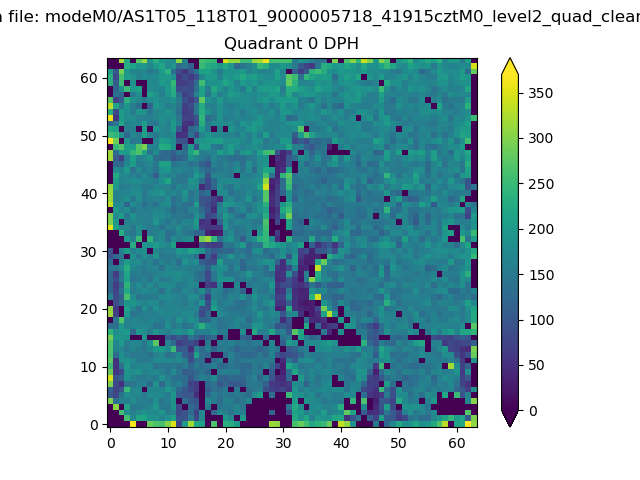 |
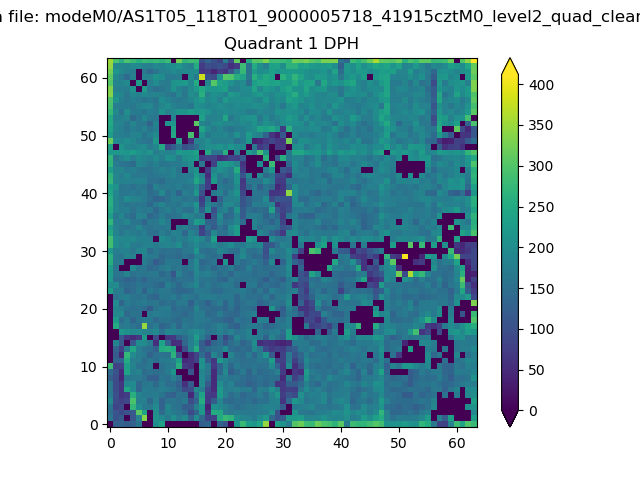 |
Quadrant B |
|---|---|---|---|
| Quadrant D | 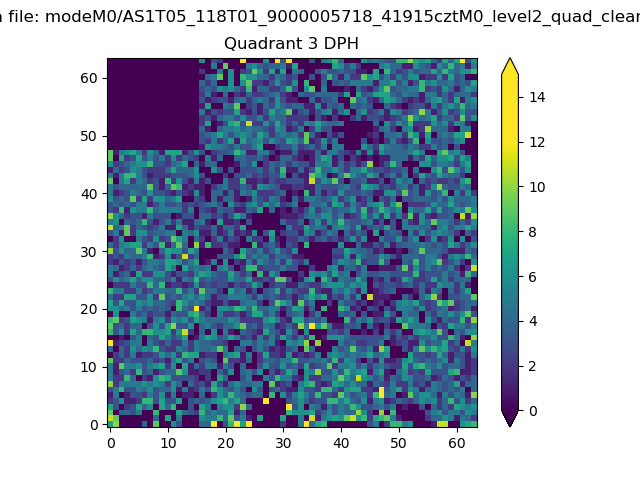 |
 |
Quadrant C |
| Plot type | Count rate plots | Images |
|---|---|---|
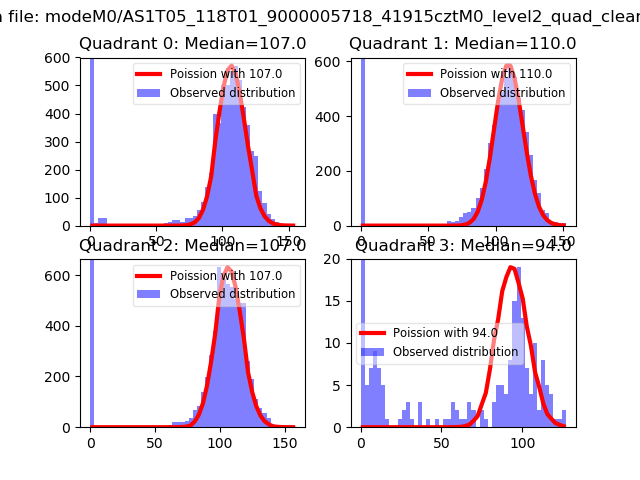
| Comparison with Poisson distribution Blue bars denote a histogram of data divided into 1 sec bins. Red curve is a Poisson curve with rate = median count rate of data. |
 |
 |
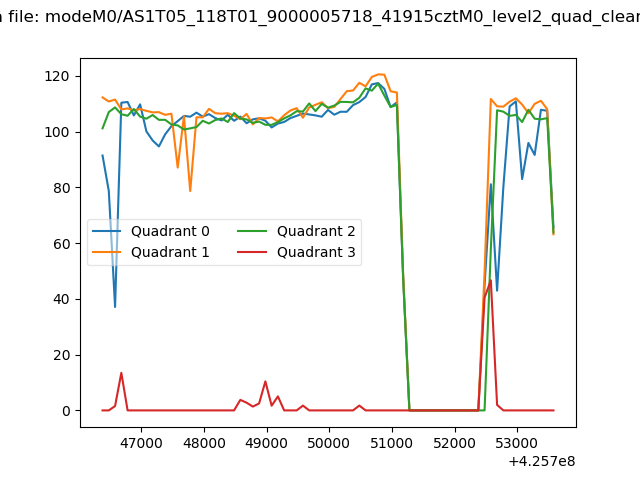
| Quadrant-wise count rates Data is divided into 100 sec bins |
 |
|
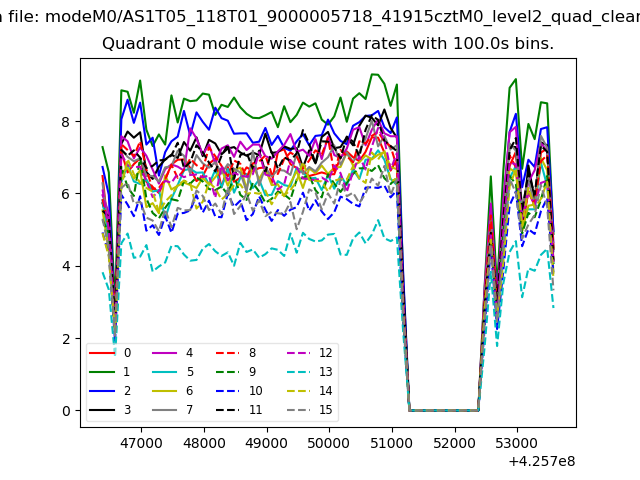
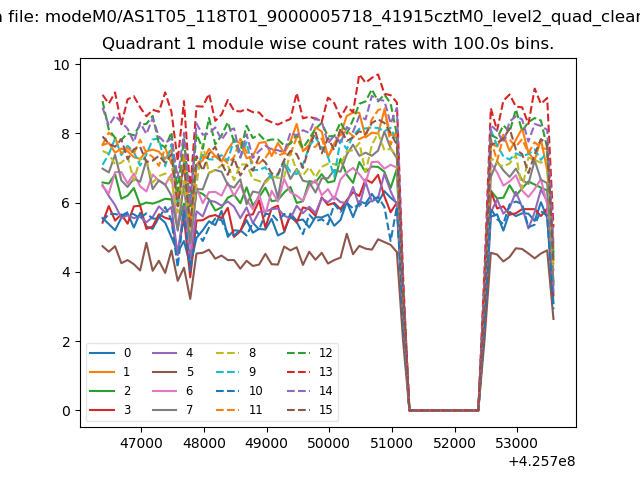
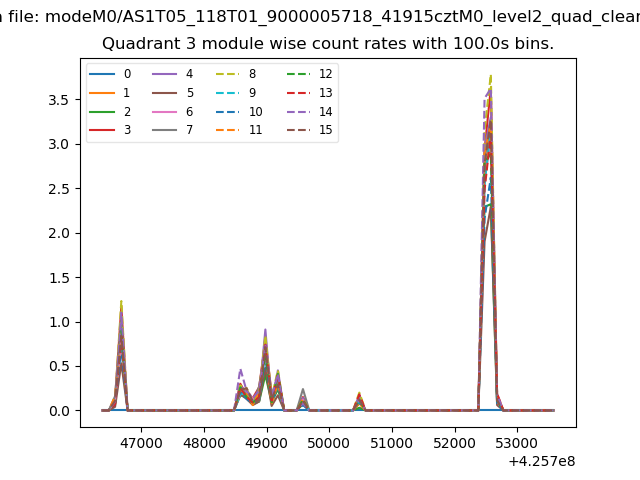
| Module-wise count rates for Quadrant A Data is divided into 100 sec bins |
 |
 |
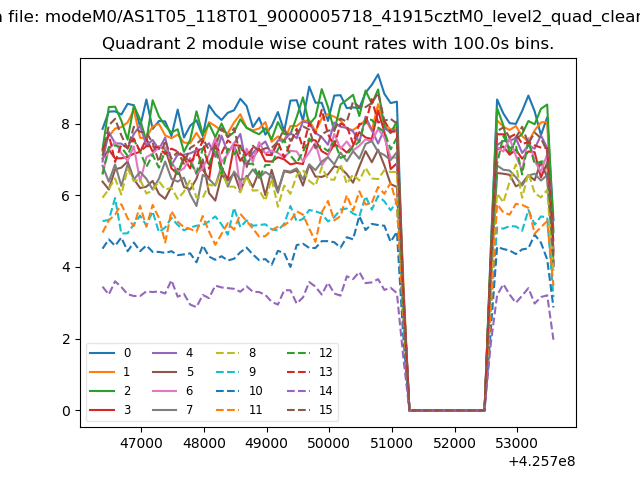
| Module-wise count rates for Quadrant B Data is divided into 100 sec bins |
 |
 |
| Module-wise count rates for Quadrant C Data is divided into 100 sec bins |
 |
 |
| Module-wise count rates for Quadrant D Data is divided into 100 sec bins |
 |
 |
| Parameter | Plot |
|---|---|
| CZT HV Monitor | 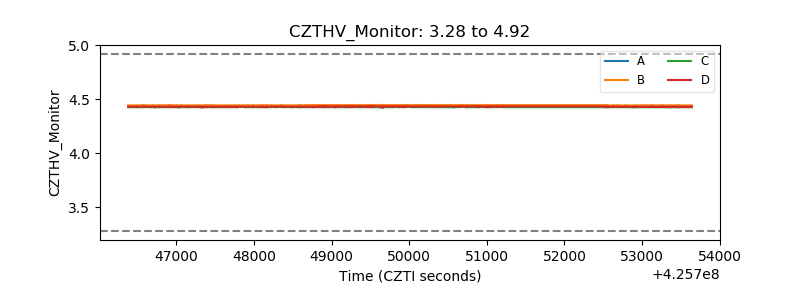 |
| D_VDD | 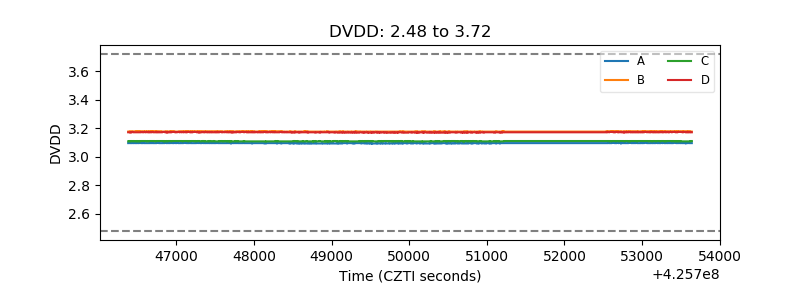 |
| Temperature 1 | 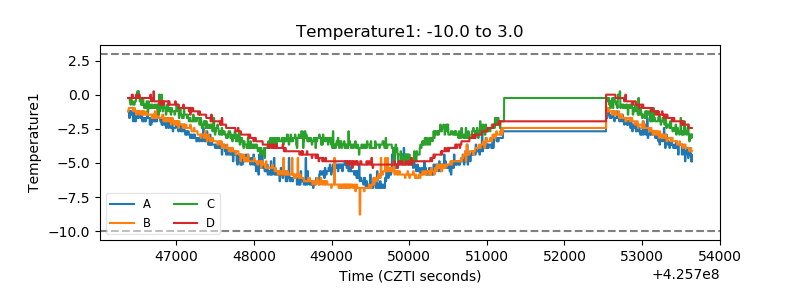 |
| Veto HV Monitor | 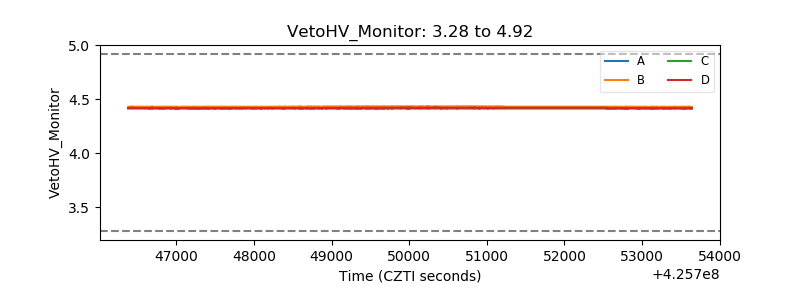 |
| Veto LLD | 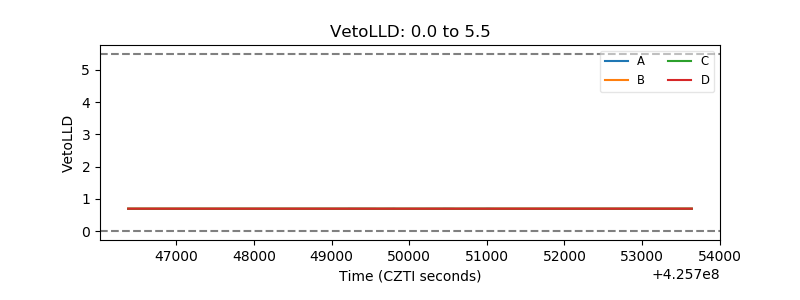 |
| Alpha Counter | 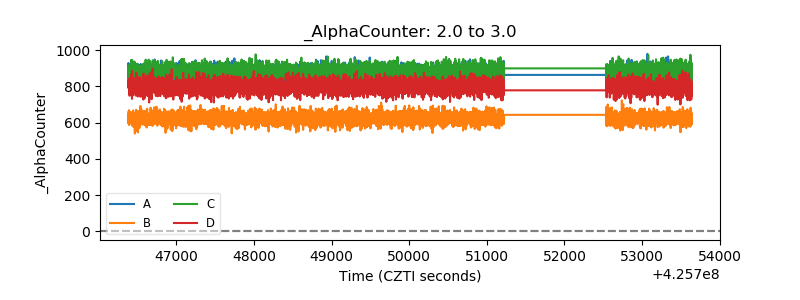 |
| _CPM_Rate | 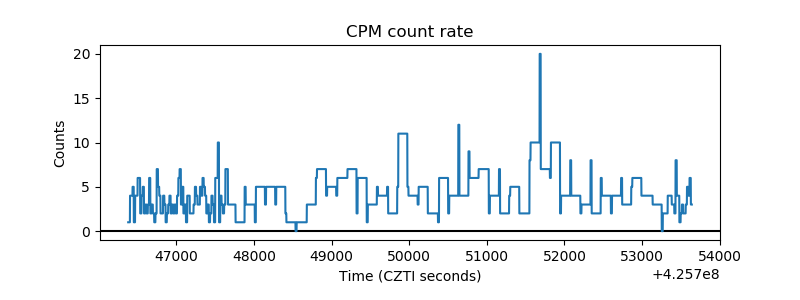 |
| CZT Counter | 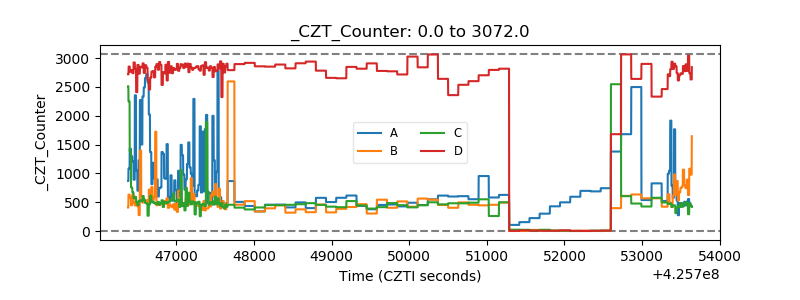 |
| +2.5 Volts monitor |  |
| +5 Volts monitor |  |
| _ROLL_ROT | 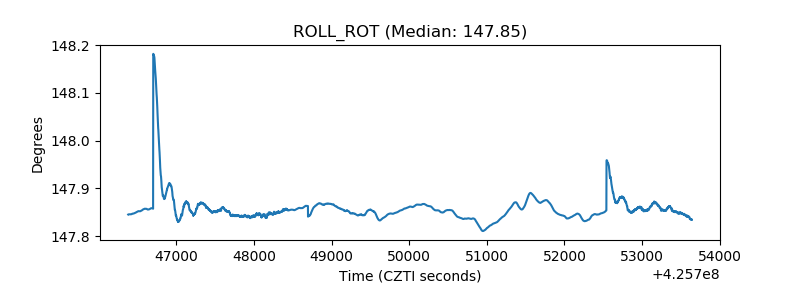 |
| _Roll_DEC | 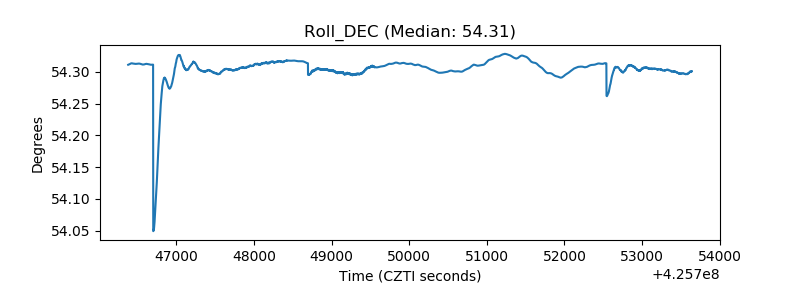 |
| _Roll_RA | 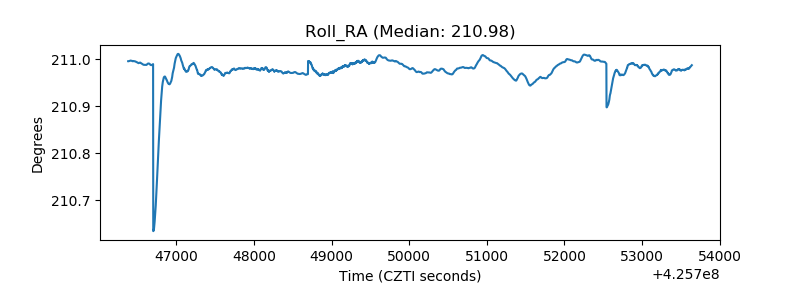 |
| Veto Counter | 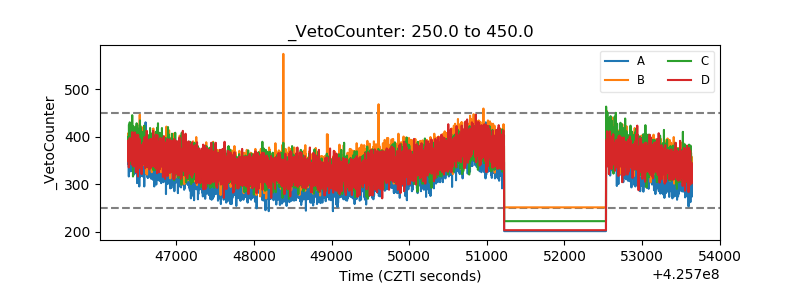 |