| Param | Original file | Final file |
|---|---|---|
| Filename | modeM0/AS1T05_118T01_9000005718_41917cztM0_level2.fits | modeM0/AS1T05_118T01_9000005718_41917cztM0_level2_quad_clean.evt |
| Size (bytes) | 1,239,393,600 | 122,025,600 |
| Size | 1.2 GB | 116.4 MB |
| Events in quadrant A | 8,604,999 | 930,535 |
| Events in quadrant B | 5,057,106 | 1,056,243 |
| Events in quadrant C | 5,036,134 | 1,013,966 |
| Events in quadrant D | 26,424,601 | 16,944 |
| Mode SS | |||
|---|---|---|---|
| Quadrant | BADHDUFLAG | Total packets | Discarded packets |
| A | 0 | 200 | 0 |
| B | 0 | 200 | 0 |
| C | 0 | 200 | 0 |
| D | 0 | 200 | 0 |
| Mode M9 | |||
|---|---|---|---|
| Quadrant | BADHDUFLAG | Total packets | Discarded packets |
| A | 0 | 27 | 0 |
| B | 0 | 27 | 0 |
| C | 0 | 27 | 0 |
| D | 0 | 27 | 0 |
| Mode M0 | |||
|---|---|---|---|
| Quadrant | BADHDUFLAG | Total packets | Discarded packets |
| A | 0 | 31912 | 2 |
| B | 0 | 21742 | 2 |
| C | 0 | 21257 | 10 |
| D | 0 | 84588 | 2 |
| Quadrant | Total seconds | Saturated seconds | Saturation percentage |
|---|---|---|---|
| A | 9756 | 1226 | 12.566626% |
| B | 9756 | 77 | 0.789258% |
| C | 9756 | 205 | 2.101271% |
| D | 9756 | 9628 | 98.687987% |
Noise dominated data is calculated using 1-second bins in cleaned event files. If a bin has >2000 counts, and if more than 50% of those come from <1% of pixels, then it is considered to be noise-dominated and hence unusable.
| Quadrant | # 1 sec bins | Bins with >0 counts | Bins with >2000 counts | High rate bins dominated by noise | Noise dominated (total time) | Noise dominated (detector-on time) | Marked lightcurve |
|---|---|---|---|---|---|---|---|
| A | 12501 | 9758 | 903 | 903 | 7.22% | 9.25% | 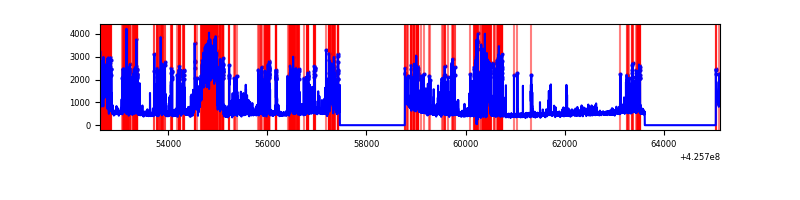 |
| B | 12501 | 9758 | 59 | 59 | 0.47% | 0.60% | 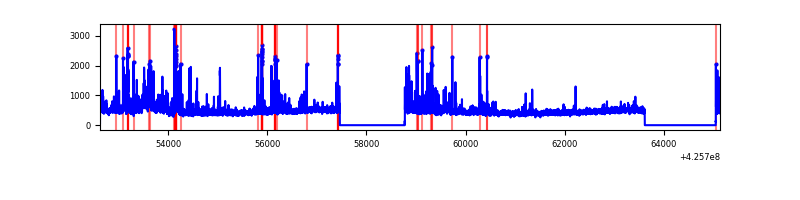 |
| C | 12501 | 9758 | 197 | 197 | 1.58% | 2.02% | 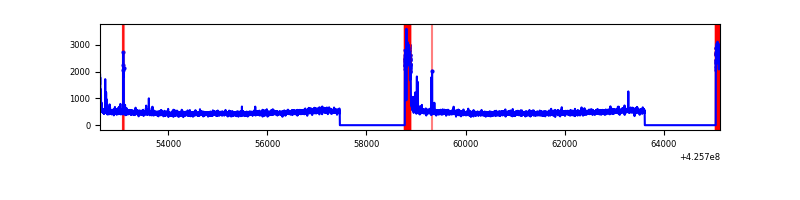 |
| D | 12501 | 9758 | 9503 | 9503 | 76.02% | 97.39% | 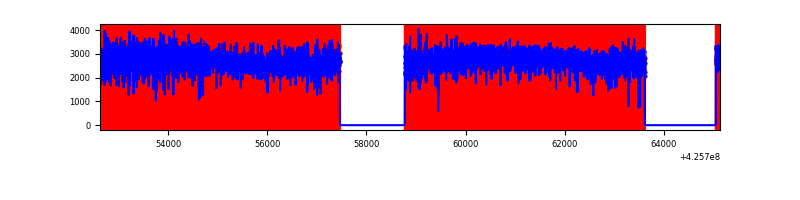 |
Top three noisy pixels from each quadrant. If the there are fewer than three noisy pixels in the level2.evt file, extra rows are filled as -1
| Pixel properties | Quadrant properties | ||||||
|---|---|---|---|---|---|---|---|
| Quadrant | DetID | PixID | Counts | Sigma | Mean | Median | Sigma |
| A | 14 | 24 | 3886814 | 19390.44 | 982 | 962 | 200.4 |
| A | 10 | 83 | 834649 | 4160.11 | 982 | 962 | 200.4 |
| A | 3 | 1 | 27830 | 134.07 | 982 | 962 | 200.4 |
| B | 5 | 255 | 340973 | 1704.66 | 1039 | 1008 | 199.4 |
| B | 0 | 156 | 150291 | 748.54 | 1039 | 1008 | 199.4 |
| B | 0 | 190 | 125586 | 624.66 | 1039 | 1008 | 199.4 |
| C | 0 | 10 | 620778 | 2636.53 | 1009 | 1015 | 235.1 |
| C | 15 | 214 | 379631 | 1610.67 | 1009 | 1015 | 235.1 |
| C | 15 | 111 | 54299 | 226.68 | 1009 | 1015 | 235.1 |
| D | 12 | 79 | 24215555 | 272098.8 | 358 | 347 | 89.0 |
| D | 5 | 222 | 243866 | 2736.35 | 358 | 347 | 89.0 |
| D | 13 | 249 | 185739 | 2083.19 | 358 | 347 | 89.0 |
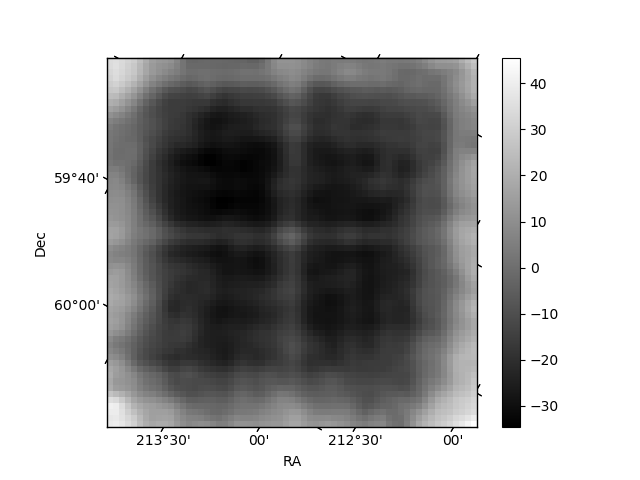
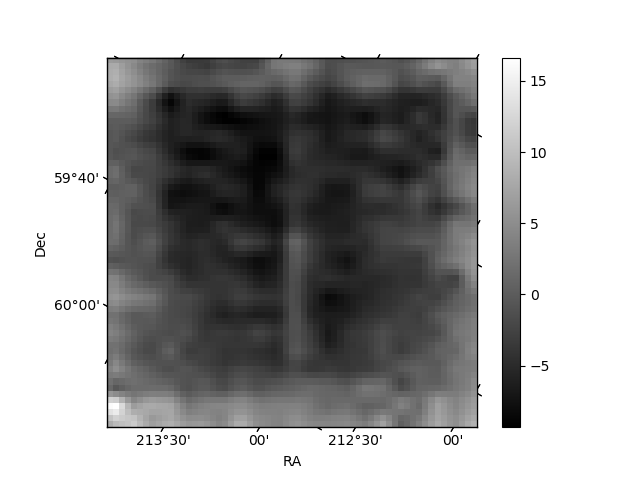
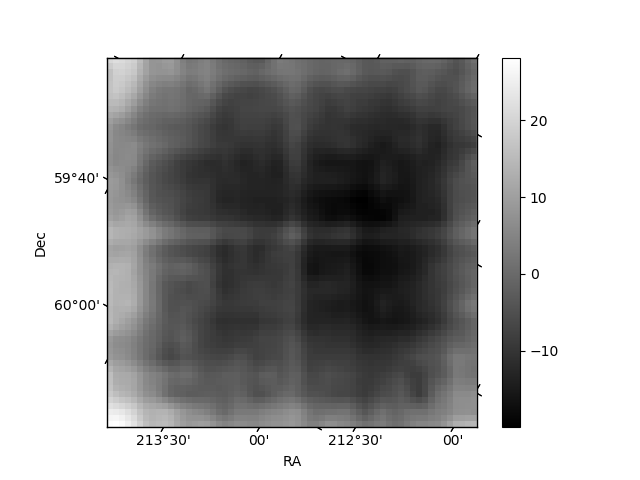
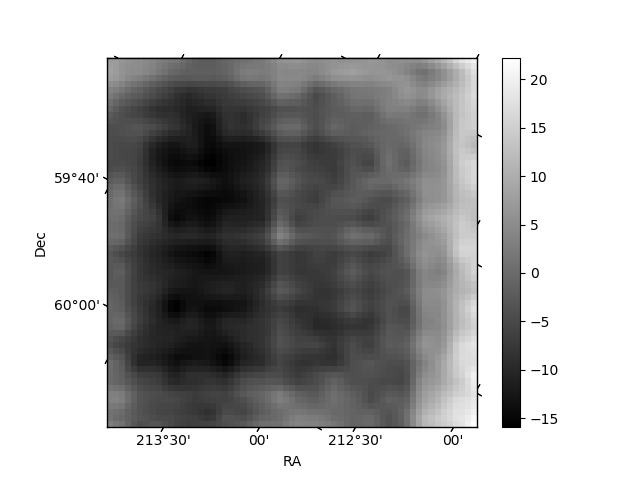
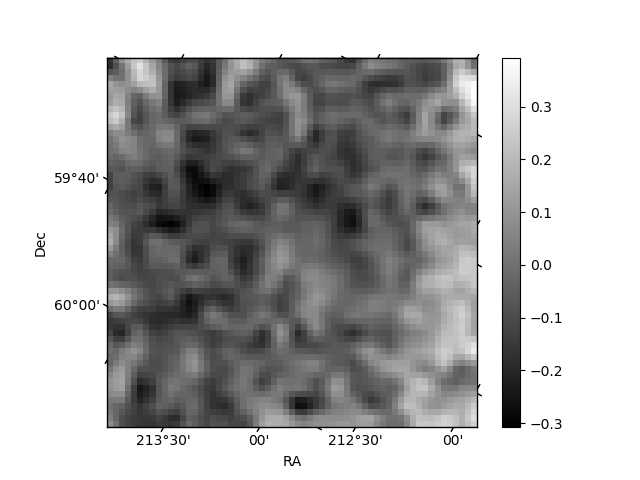
Histogram calculated using DETX and DETY for each event in the final _common_clean file
| Quadrant A | 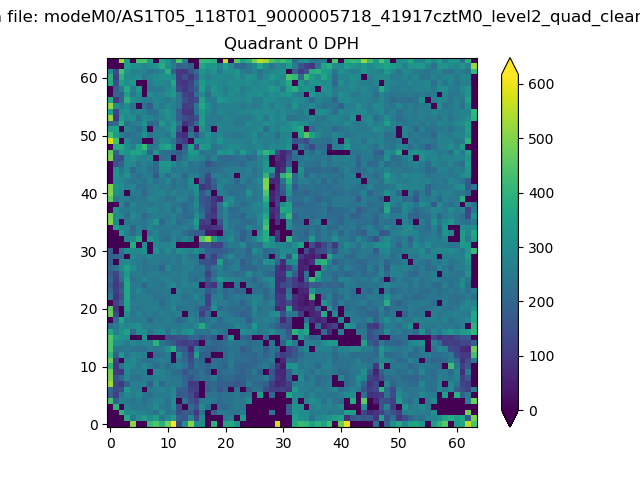 |
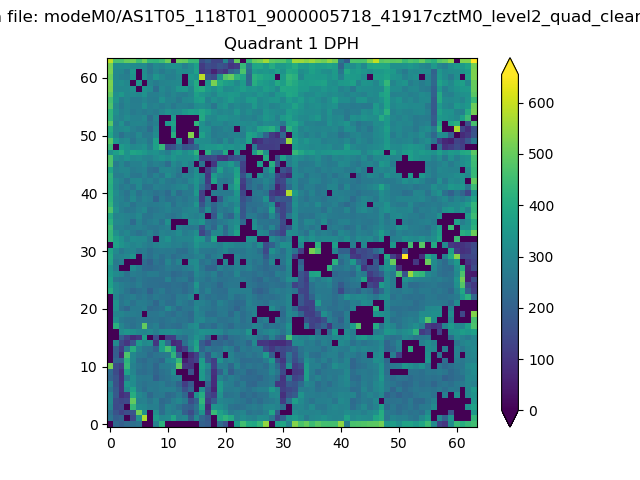 |
Quadrant B |
|---|---|---|---|
| Quadrant D | 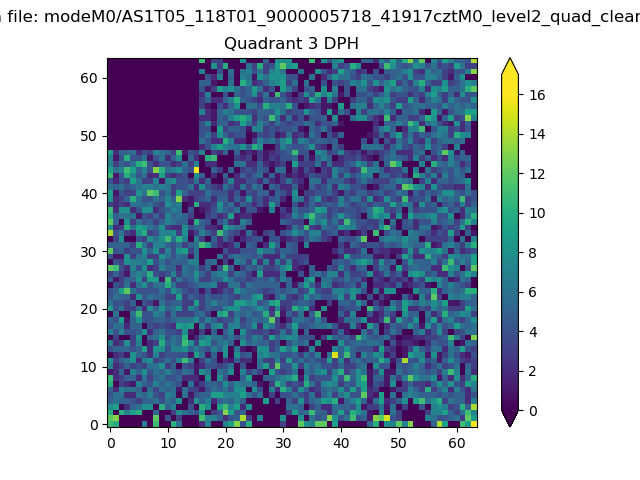 |
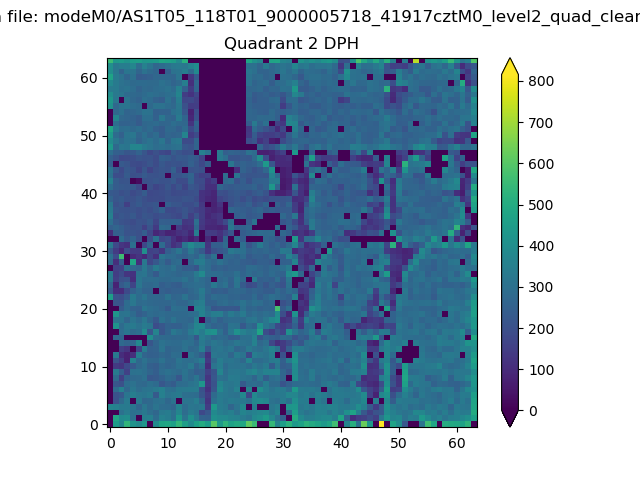 |
Quadrant C |
| Plot type | Count rate plots | Images |
|---|---|---|
| Comparison with Poisson distribution Blue bars denote a histogram of data divided into 1 sec bins. Red curve is a Poisson curve with rate = median count rate of data. |
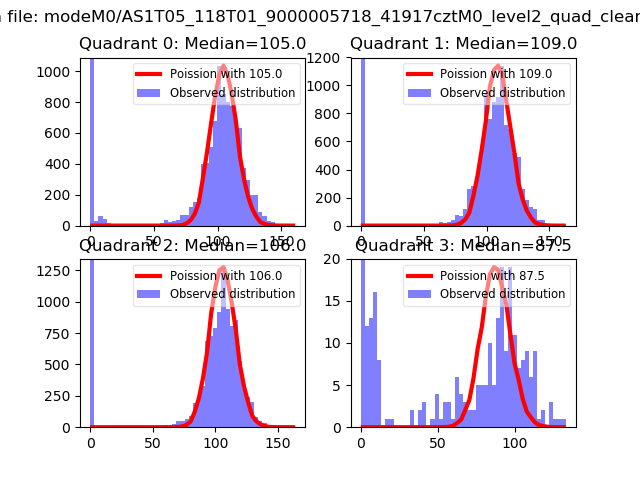 |
 |
| Quadrant-wise count rates Data is divided into 100 sec bins |
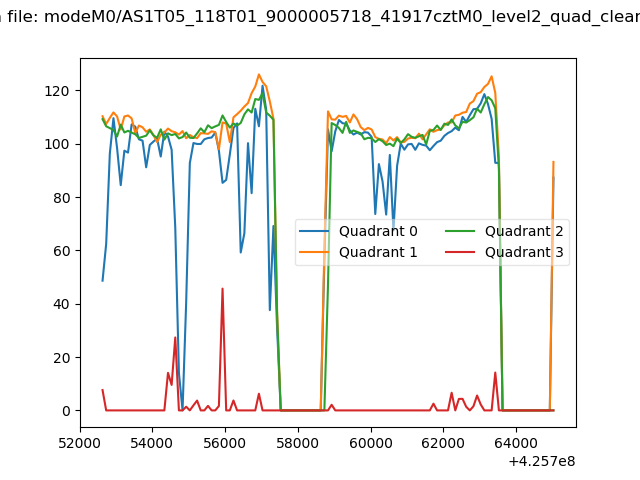 |
|
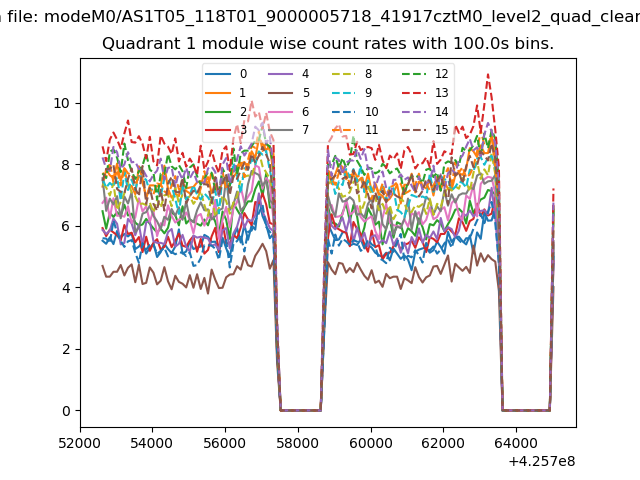
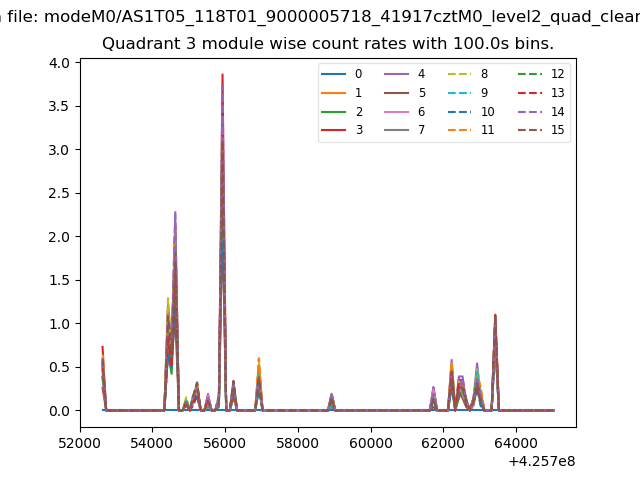
| Module-wise count rates for Quadrant A Data is divided into 100 sec bins |
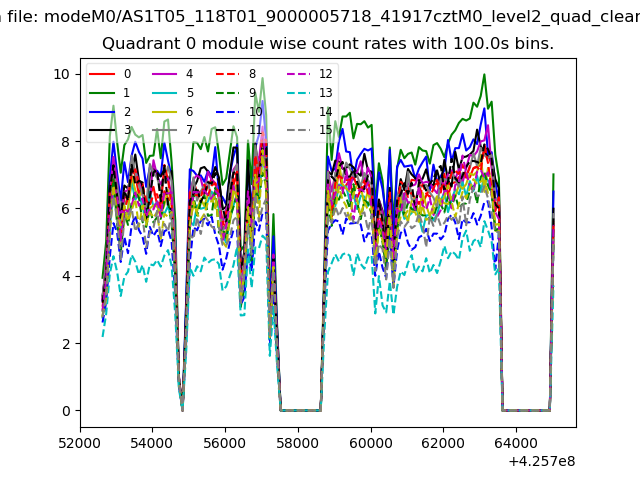 |
 |
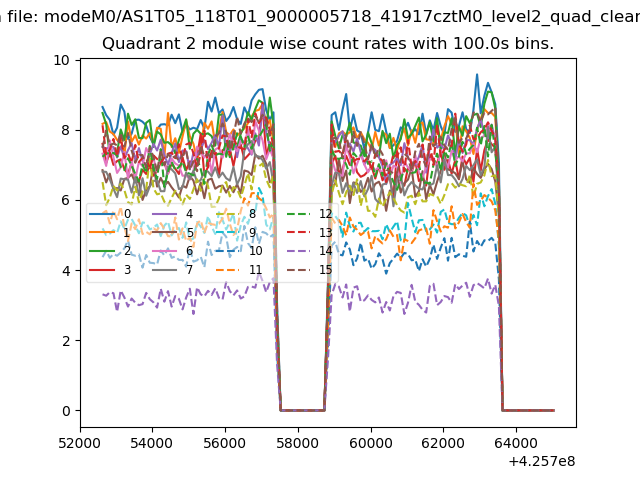
| Module-wise count rates for Quadrant B Data is divided into 100 sec bins |
 |
 |
| Module-wise count rates for Quadrant C Data is divided into 100 sec bins |
 |
 |
| Module-wise count rates for Quadrant D Data is divided into 100 sec bins |
 |
 |
| Parameter | Plot |
|---|---|
| CZT HV Monitor |  |
| D_VDD | 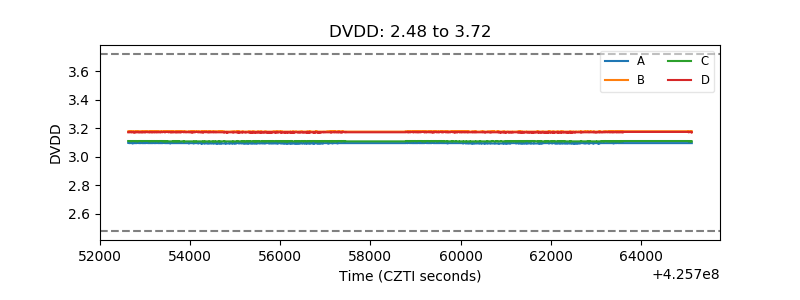 |
| Temperature 1 | 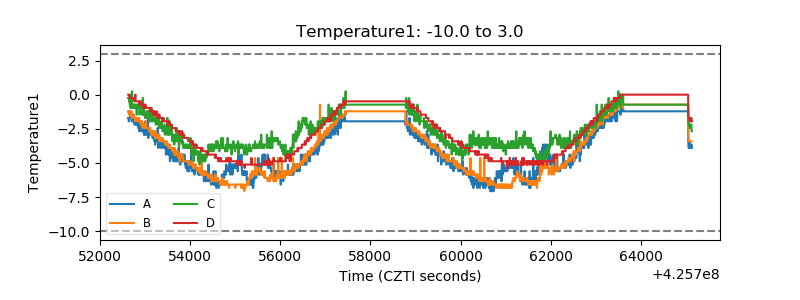 |
| Veto HV Monitor | 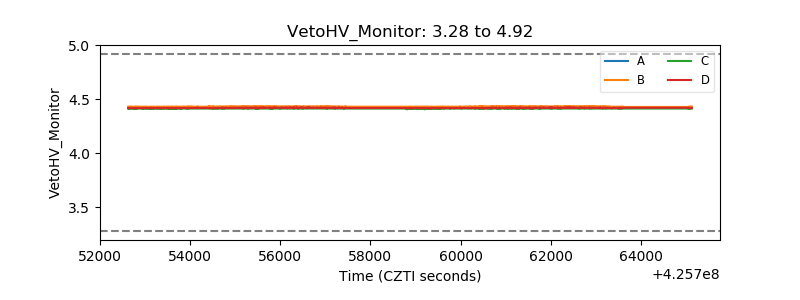 |
| Veto LLD | 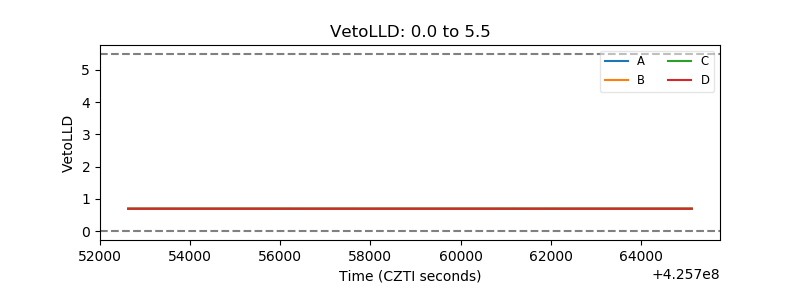 |
| Alpha Counter | 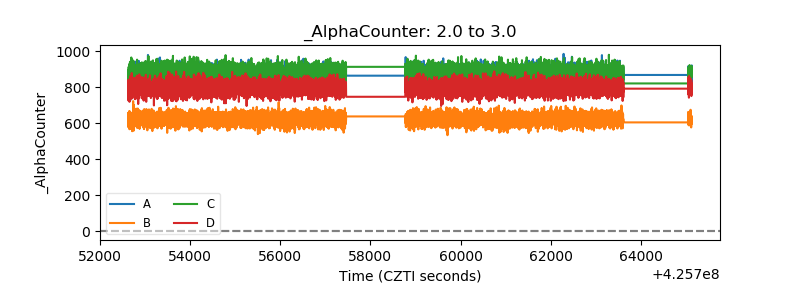 |
| _CPM_Rate | 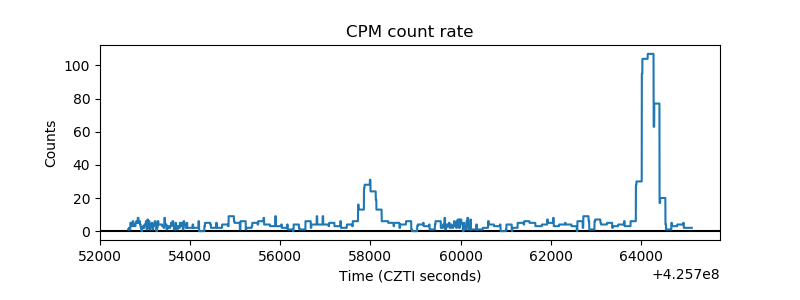 |
| CZT Counter | 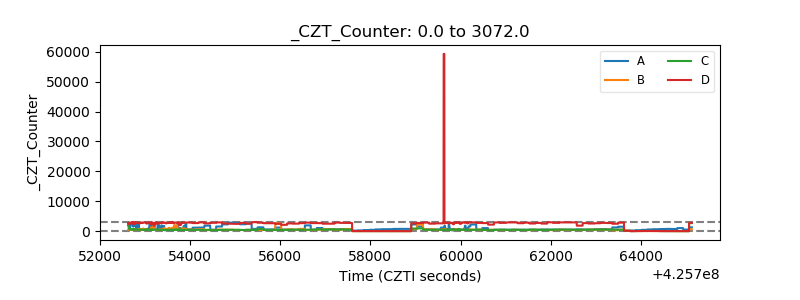 |
| +2.5 Volts monitor | 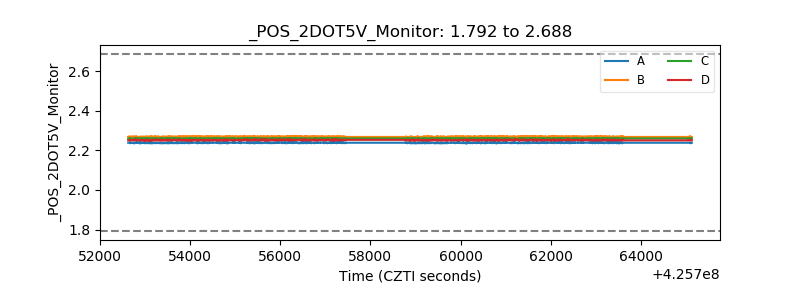 |
| +5 Volts monitor | 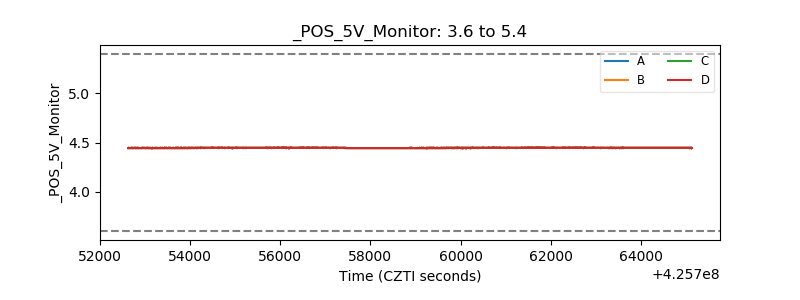 |
| _ROLL_ROT | 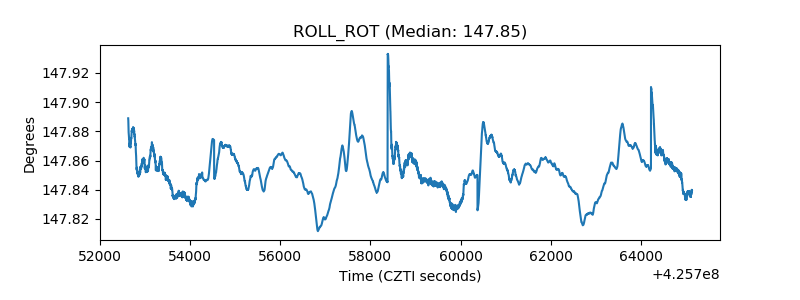 |
| _Roll_DEC | 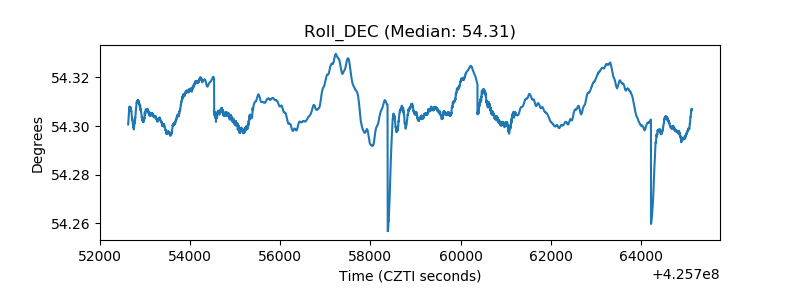 |
| _Roll_RA | 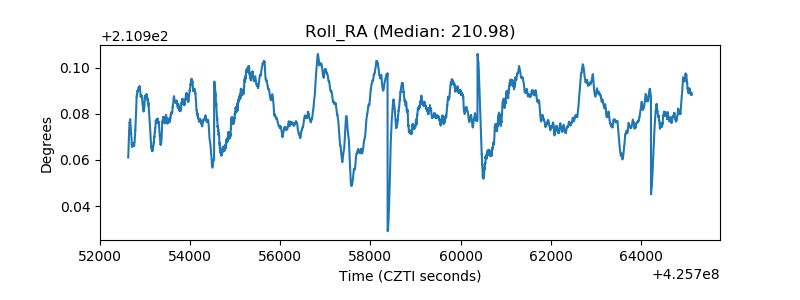 |
| Veto Counter | 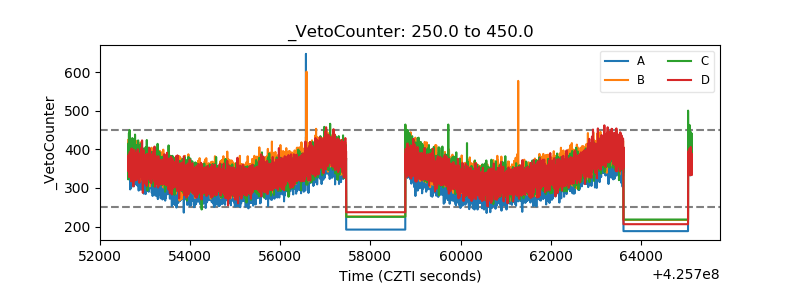 |