| Param | Original file | Final file |
|---|---|---|
| Filename | modeM0/AS1T05_118T01_9000005718_41918cztM0_level2.fits | modeM0/AS1T05_118T01_9000005718_41918cztM0_level2_quad_clean.evt |
| Size (bytes) | 679,775,040 | 75,231,360 |
| Size | 648.3 MB | 71.7 MB |
| Events in quadrant A | 3,880,963 | 598,166 |
| Events in quadrant B | 2,927,338 | 618,879 |
| Events in quadrant C | 3,153,389 | 589,388 |
| Events in quadrant D | 14,756,183 | 71,117 |
| Mode SS | |||
|---|---|---|---|
| Quadrant | BADHDUFLAG | Total packets | Discarded packets |
| A | 0 | 116 | 0 |
| B | 0 | 116 | 0 |
| C | 0 | 116 | 0 |
| D | 0 | 116 | 0 |
| Mode M9 | |||
|---|---|---|---|
| Quadrant | BADHDUFLAG | Total packets | Discarded packets |
| A | 0 | 23 | 0 |
| B | 0 | 23 | 0 |
| C | 0 | 23 | 0 |
| D | 0 | 24 | 0 |
| Mode M0 | |||
|---|---|---|---|
| Quadrant | BADHDUFLAG | Total packets | Discarded packets |
| A | 0 | 15284 | 3 |
| B | 0 | 12861 | 2 |
| C | 0 | 13019 | 2 |
| D | 0 | 47390 | 2 |
| Quadrant | Total seconds | Saturated seconds | Saturation percentage |
|---|---|---|---|
| A | 5725 | 214 | 3.737991% |
| B | 5725 | 86 | 1.502183% |
| C | 5725 | 207 | 3.615721% |
| D | 5725 | 5076 | 88.663755% |
Noise dominated data is calculated using 1-second bins in cleaned event files. If a bin has >2000 counts, and if more than 50% of those come from <1% of pixels, then it is considered to be noise-dominated and hence unusable.
| Quadrant | # 1 sec bins | Bins with >0 counts | Bins with >2000 counts | High rate bins dominated by noise | Noise dominated (total time) | Noise dominated (detector-on time) | Marked lightcurve |
|---|---|---|---|---|---|---|---|
| A | 7278 | 5726 | 147 | 147 | 2.02% | 2.57% | 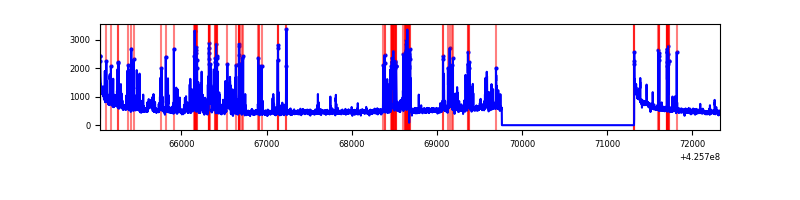 |
| B | 7278 | 5726 | 55 | 55 | 0.76% | 0.96% | 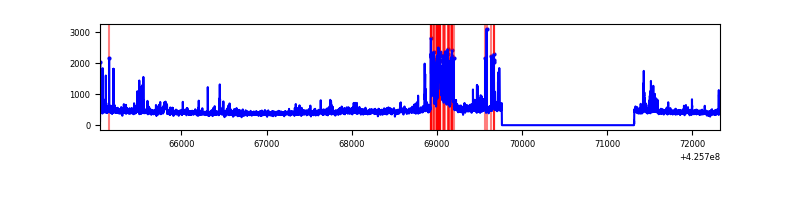 |
| C | 7278 | 5726 | 203 | 203 | 2.79% | 3.55% | 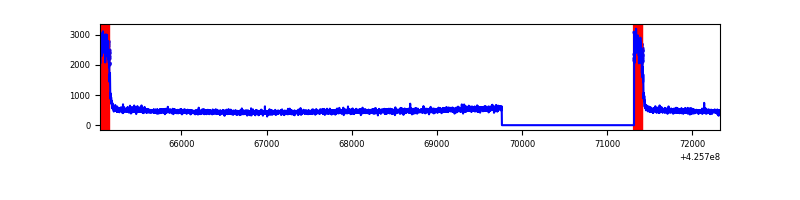 |
| D | 7278 | 5726 | 5050 | 5050 | 69.39% | 88.19% | 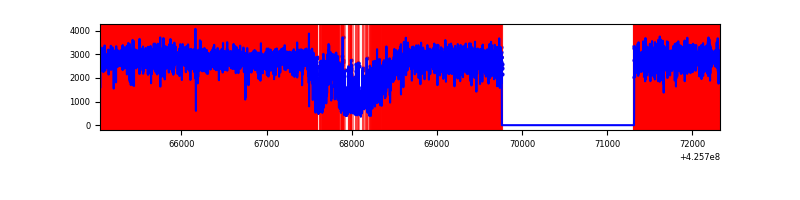 |
Top three noisy pixels from each quadrant. If the there are fewer than three noisy pixels in the level2.evt file, extra rows are filled as -1
| Pixel properties | Quadrant properties | ||||||
|---|---|---|---|---|---|---|---|
| Quadrant | DetID | PixID | Counts | Sigma | Mean | Median | Sigma |
| A | 14 | 24 | 925909 | 7520.76 | 600 | 588 | 123.0 |
| A | 10 | 83 | 567146 | 4604.83 | 600 | 588 | 123.0 |
| A | 2 | 79 | 29216 | 232.68 | 600 | 588 | 123.0 |
| B | 12 | 0 | 310364 | 2622.42 | 606 | 588 | 118.1 |
| B | 5 | 255 | 74534 | 625.99 | 606 | 588 | 118.1 |
| B | 0 | 229 | 52724 | 441.36 | 606 | 588 | 118.1 |
| C | 0 | 10 | 594506 | 4293.84 | 585 | 589 | 138.3 |
| C | 15 | 214 | 226837 | 1635.71 | 585 | 589 | 138.3 |
| C | 0 | 15 | 51124 | 365.35 | 585 | 589 | 138.3 |
| D | 12 | 79 | 13300673 | 236418.04 | 226 | 219 | 56.3 |
| D | 13 | 249 | 207473 | 3683.98 | 226 | 219 | 56.3 |
| D | 12 | 6 | 113596 | 2015.3 | 226 | 219 | 56.3 |
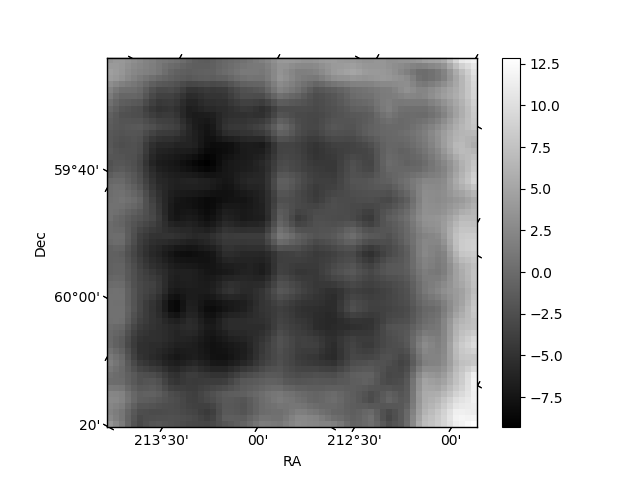
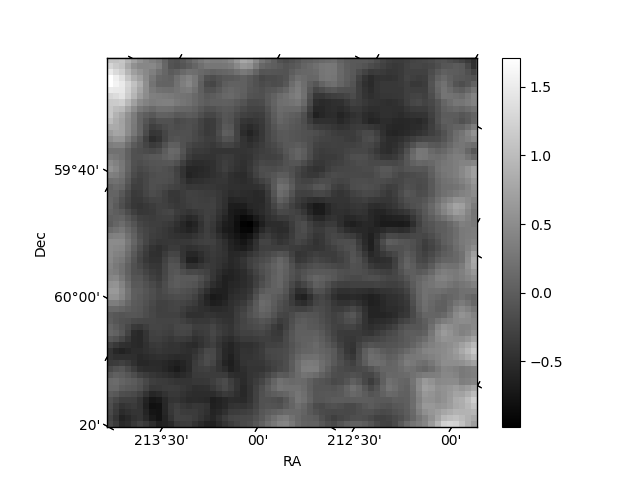
Histogram calculated using DETX and DETY for each event in the final _common_clean file
| Quadrant A |  |
 |
Quadrant B |
|---|---|---|---|
| Quadrant D |  |
 |
Quadrant C |
| Plot type | Count rate plots | Images |
|---|---|---|
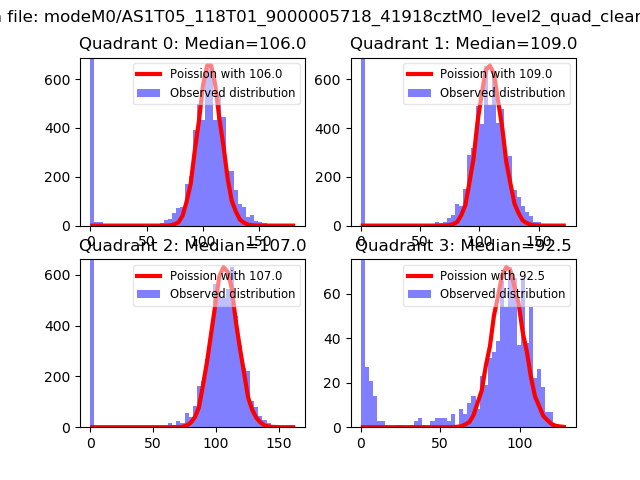
| Comparison with Poisson distribution Blue bars denote a histogram of data divided into 1 sec bins. Red curve is a Poisson curve with rate = median count rate of data. |
 |
 |
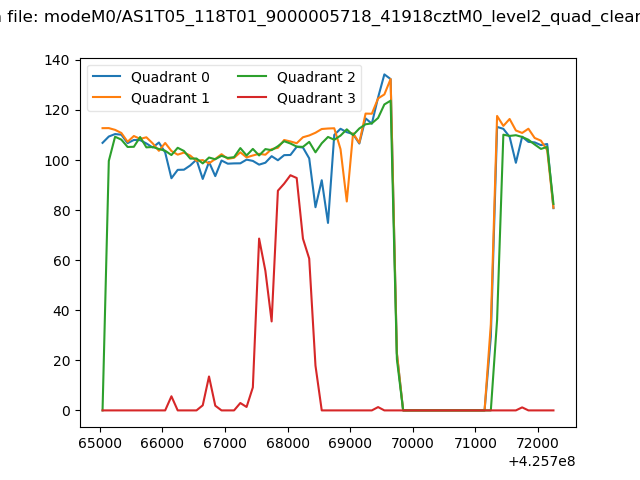
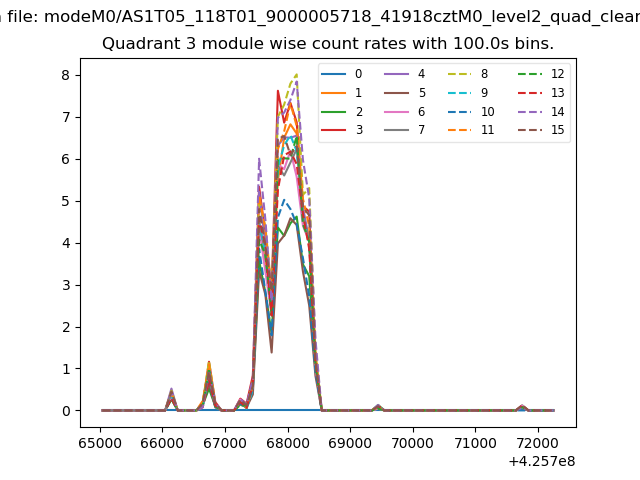
| Quadrant-wise count rates Data is divided into 100 sec bins |
 |
|
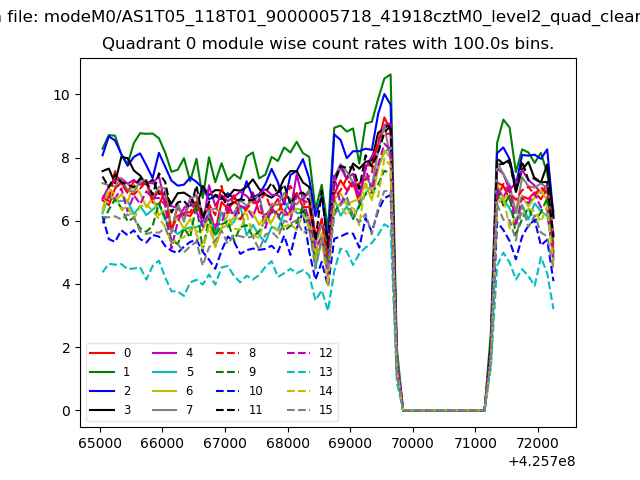
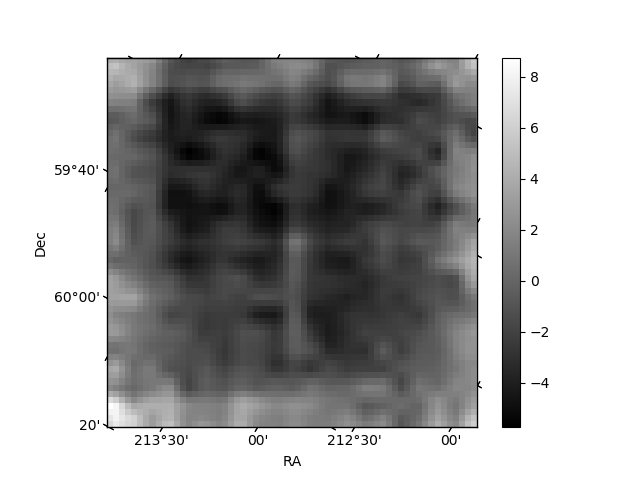
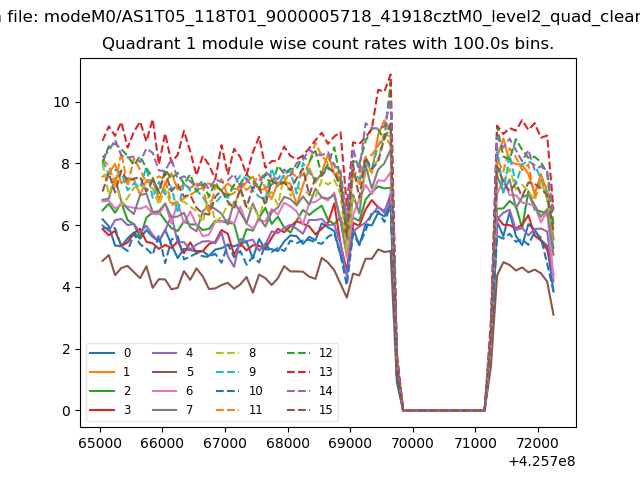
| Module-wise count rates for Quadrant A Data is divided into 100 sec bins |
 |
 |
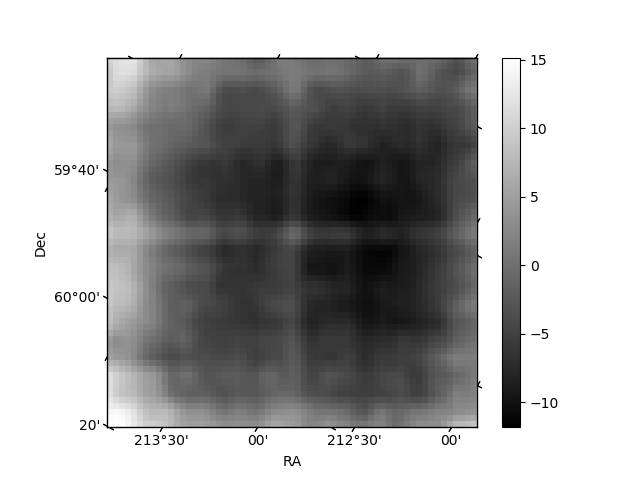
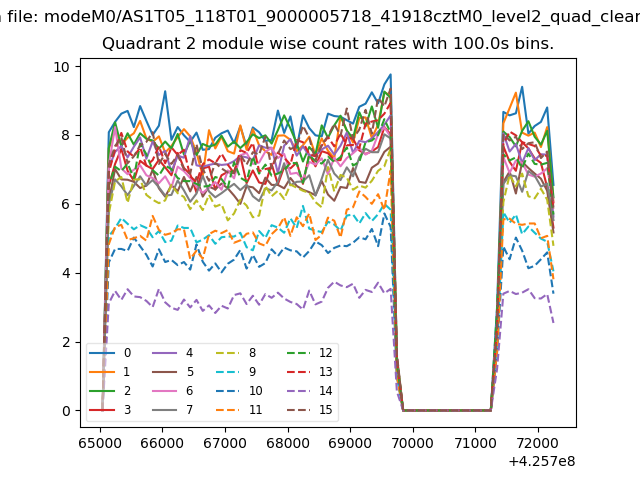
| Module-wise count rates for Quadrant B Data is divided into 100 sec bins |
 |
 |
| Module-wise count rates for Quadrant C Data is divided into 100 sec bins |
 |
 |
| Module-wise count rates for Quadrant D Data is divided into 100 sec bins |
 |
 |
| Parameter | Plot |
|---|---|
| CZT HV Monitor | 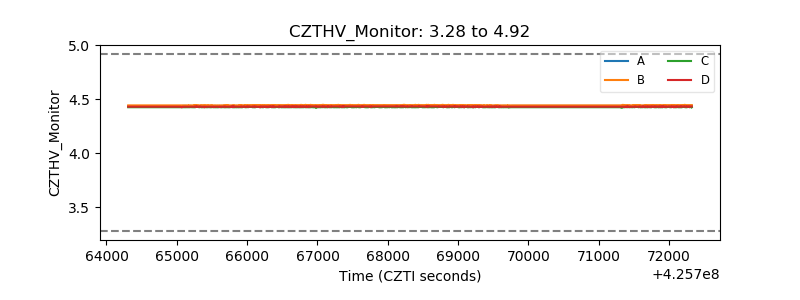 |
| D_VDD | 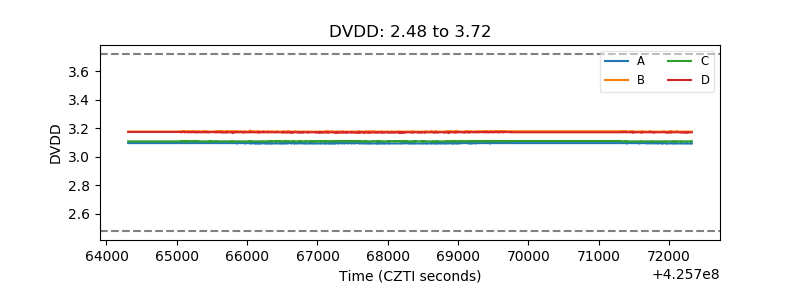 |
| Temperature 1 | 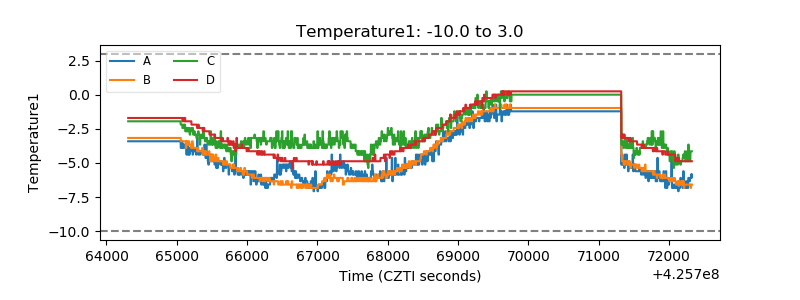 |
| Veto HV Monitor | 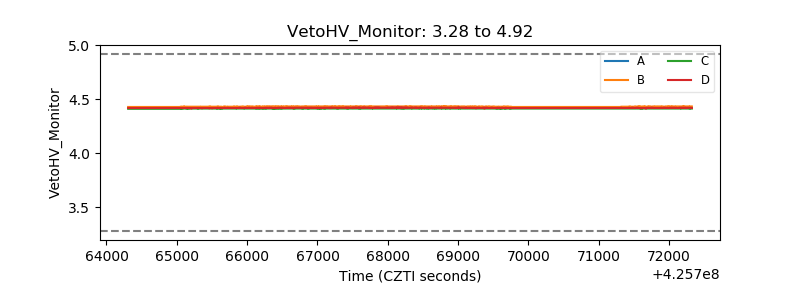 |
| Veto LLD | 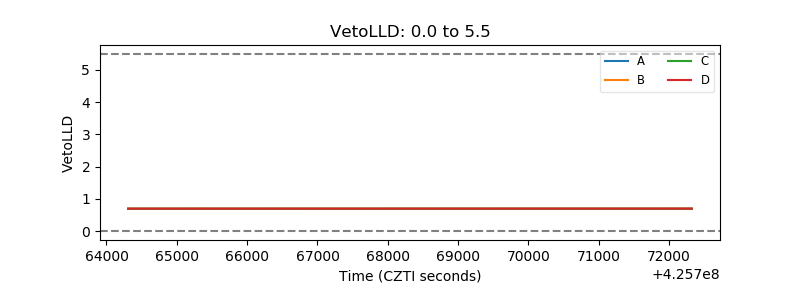 |
| Alpha Counter | 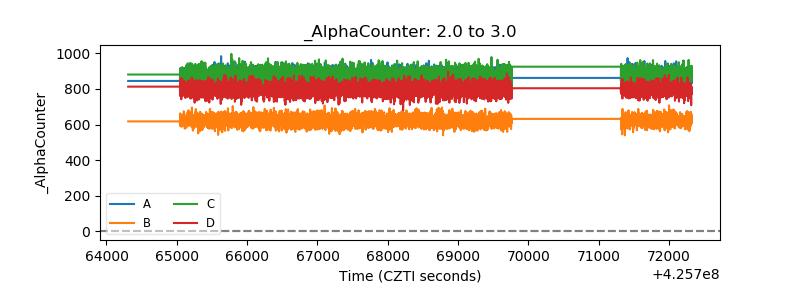 |
| _CPM_Rate | 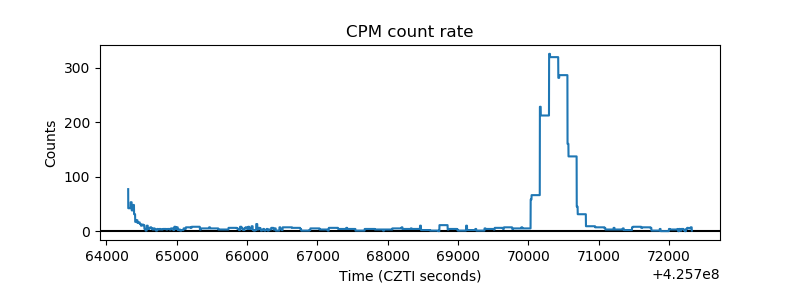 |
| CZT Counter | 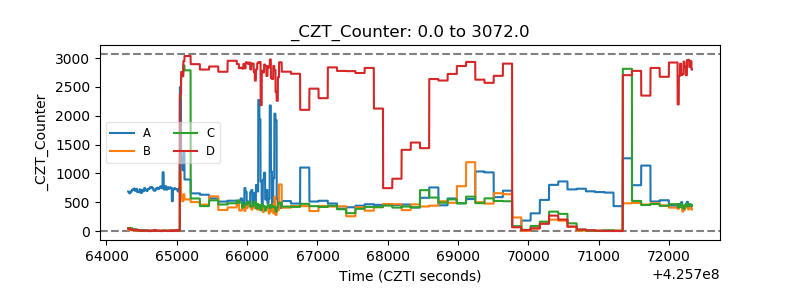 |
| +2.5 Volts monitor | 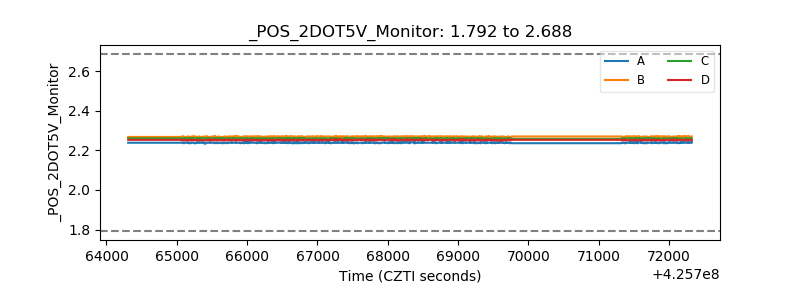 |
| +5 Volts monitor | 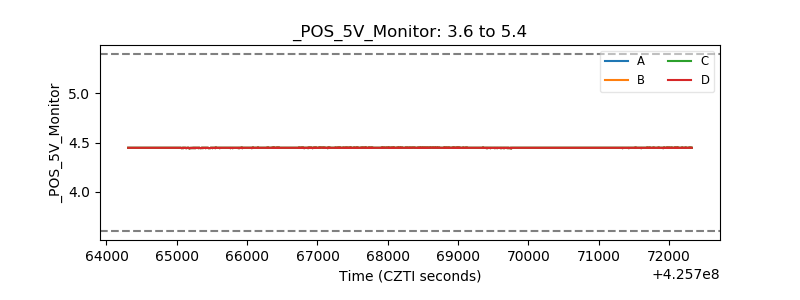 |
| _ROLL_ROT | 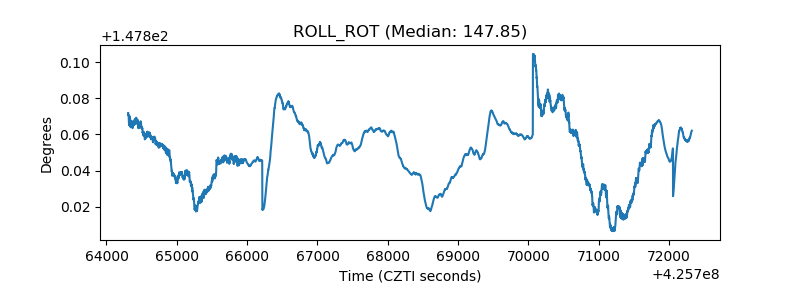 |
| _Roll_DEC | 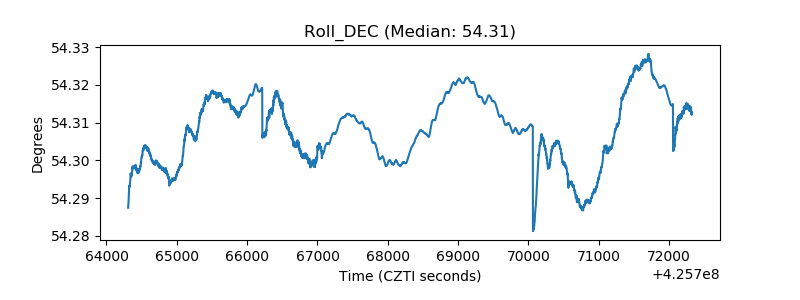 |
| _Roll_RA | 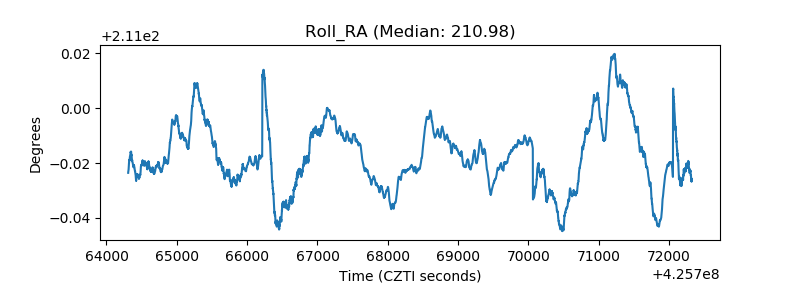 |
| Veto Counter | 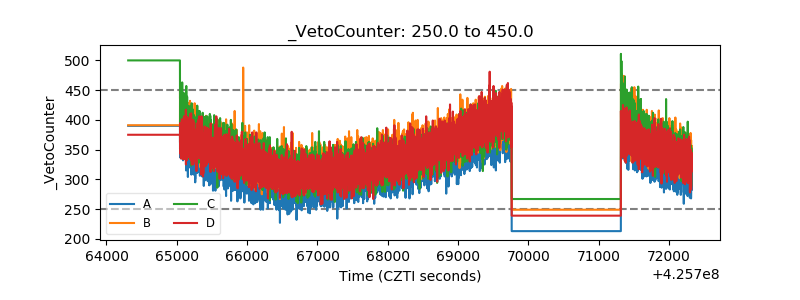 |